Doomiest Graphs of 2022
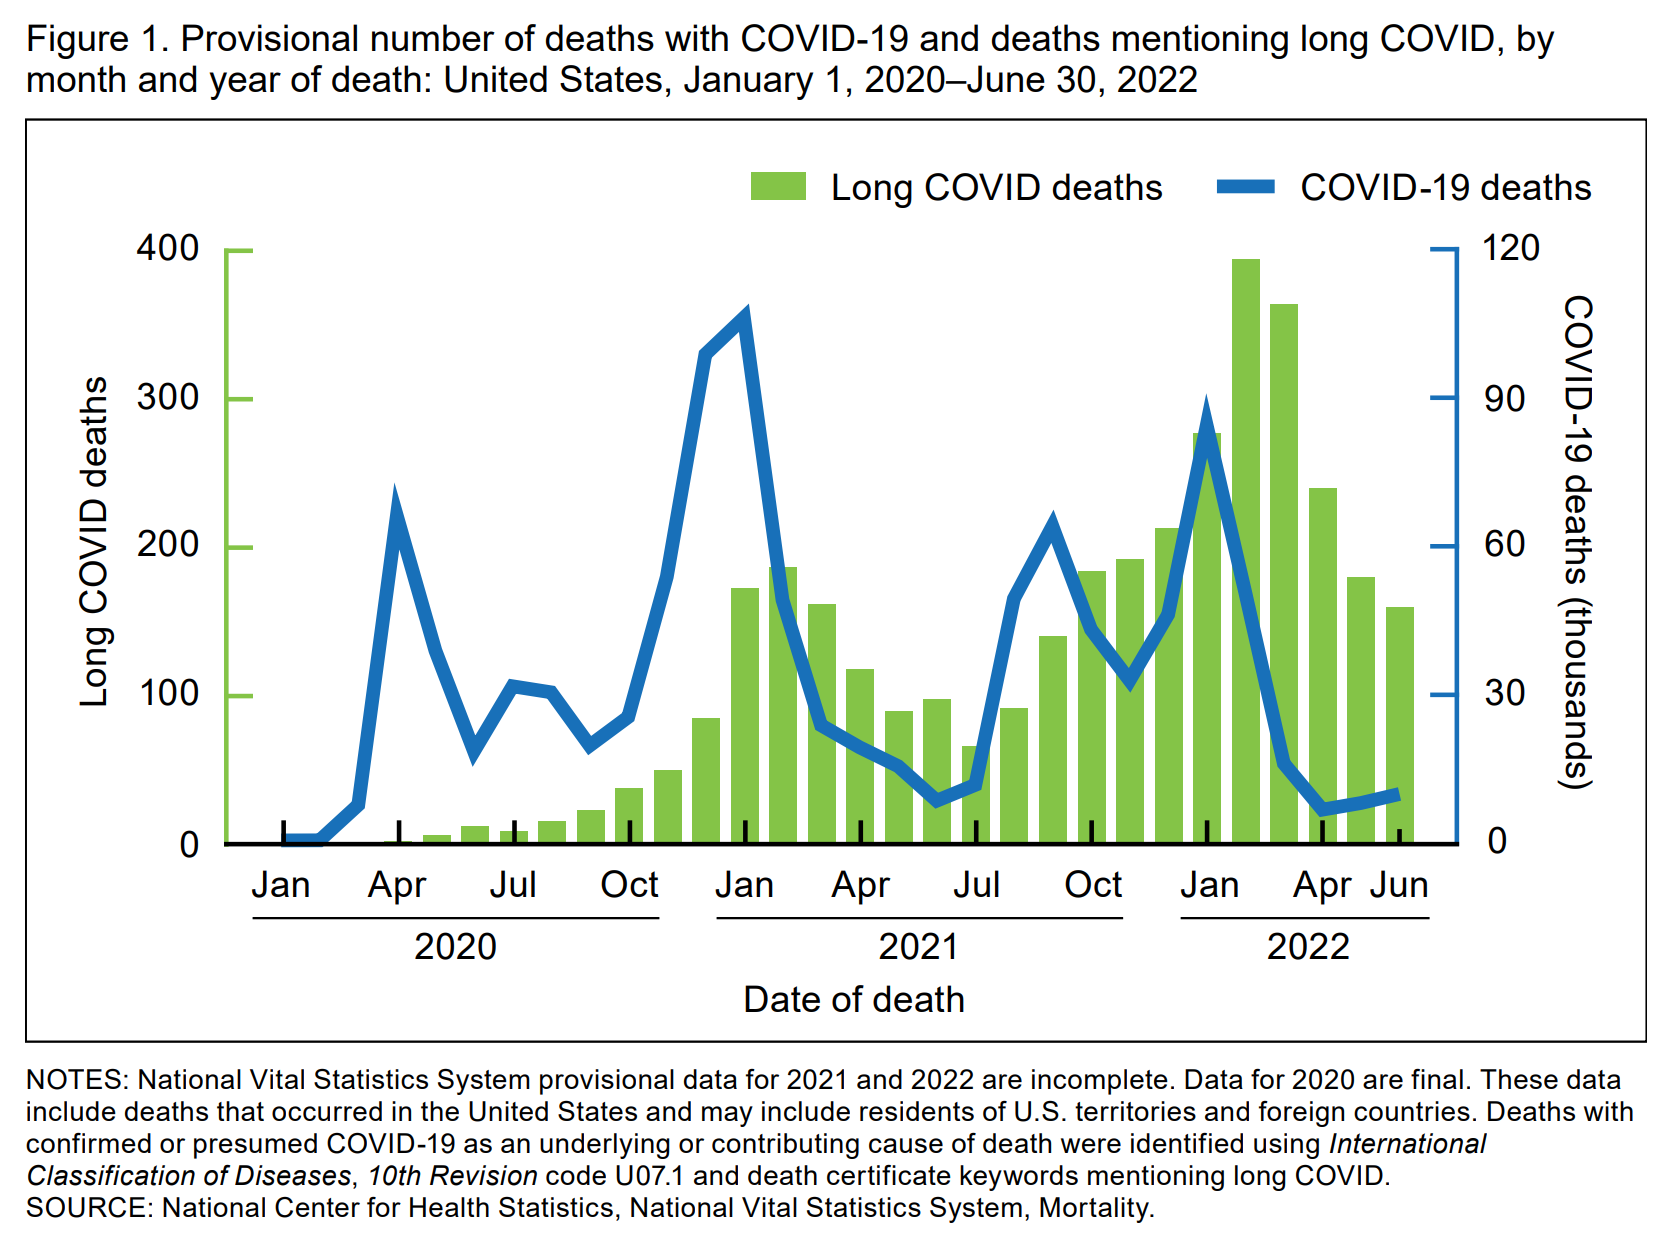
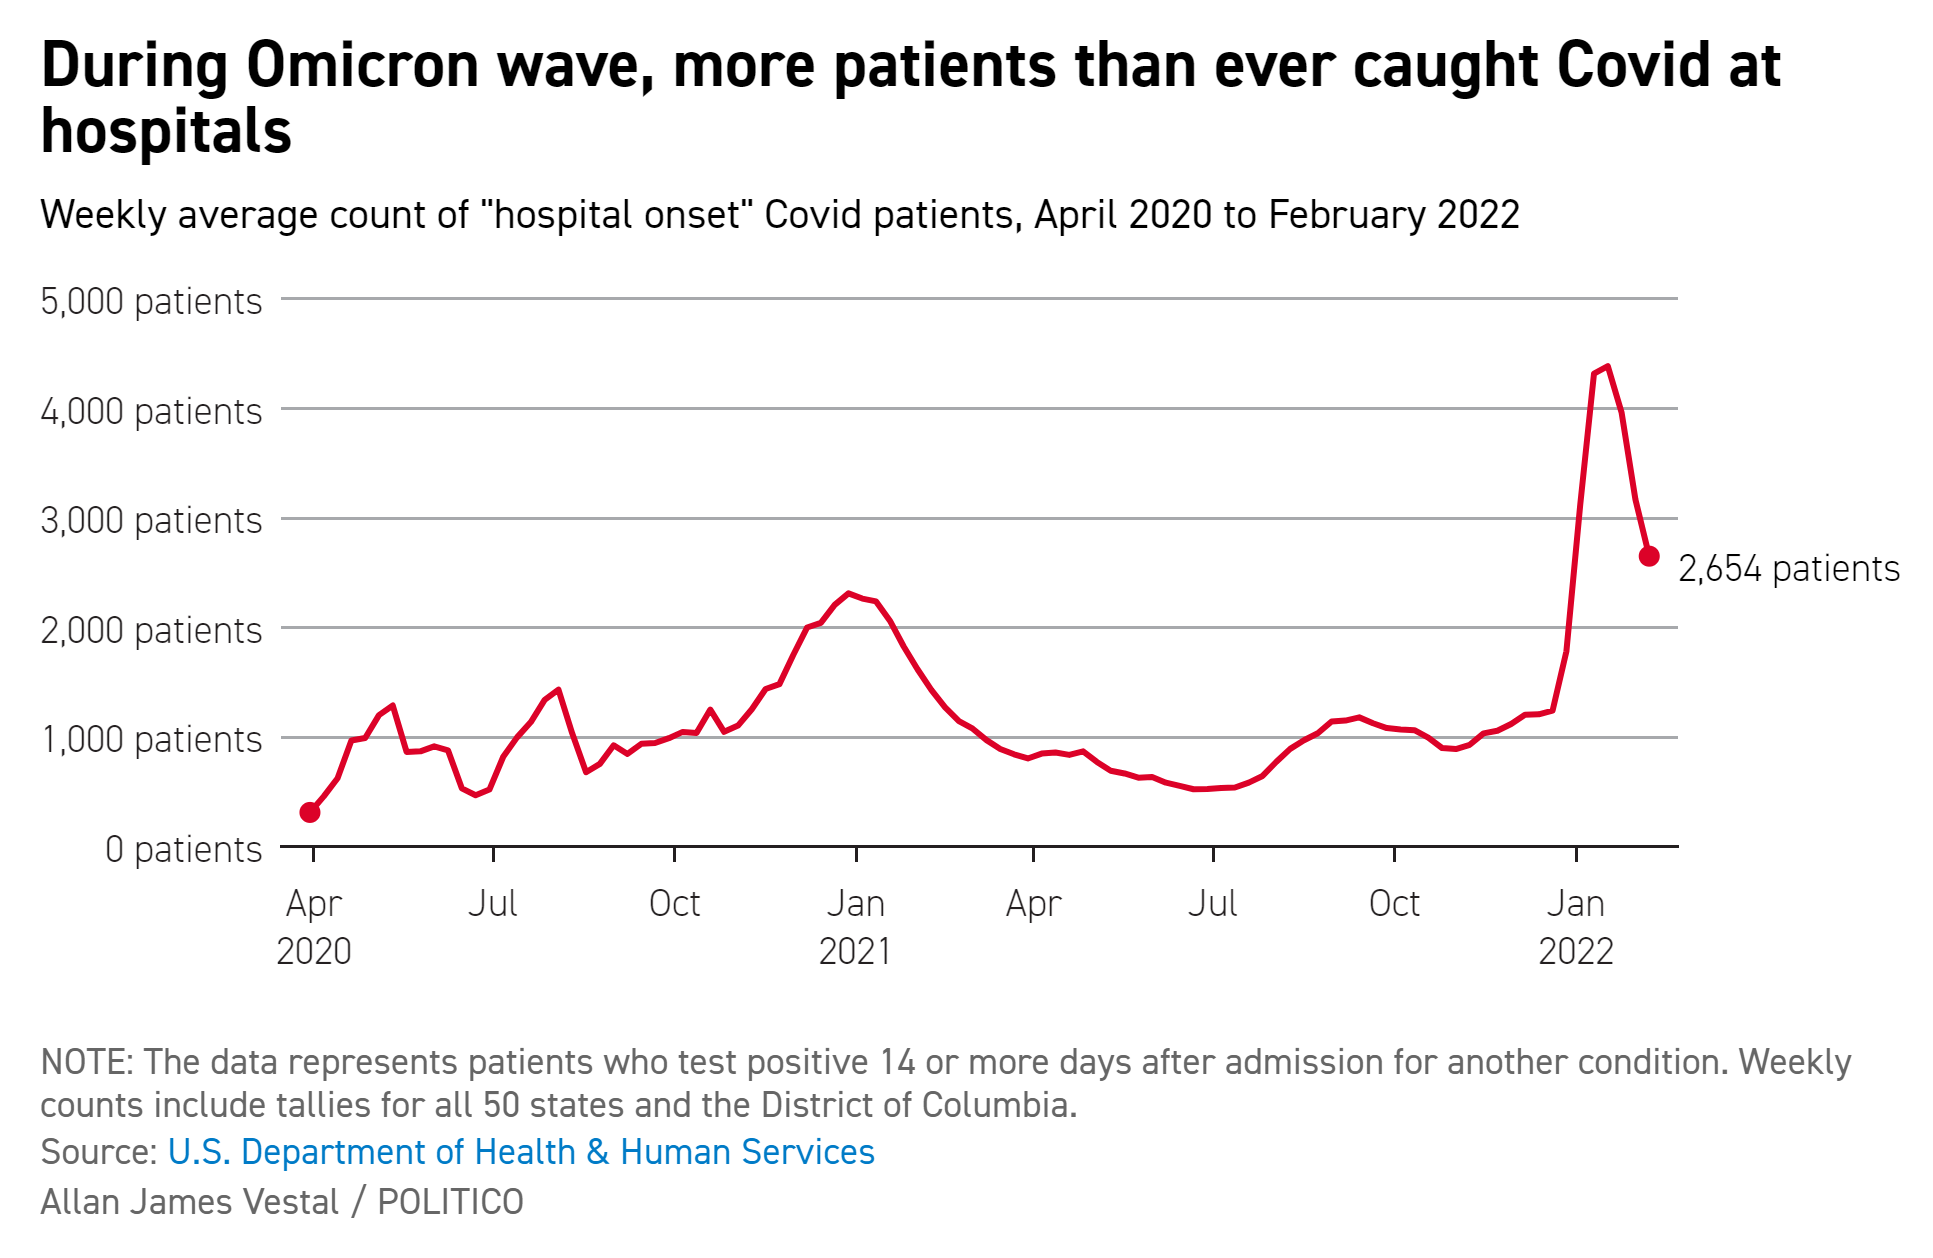
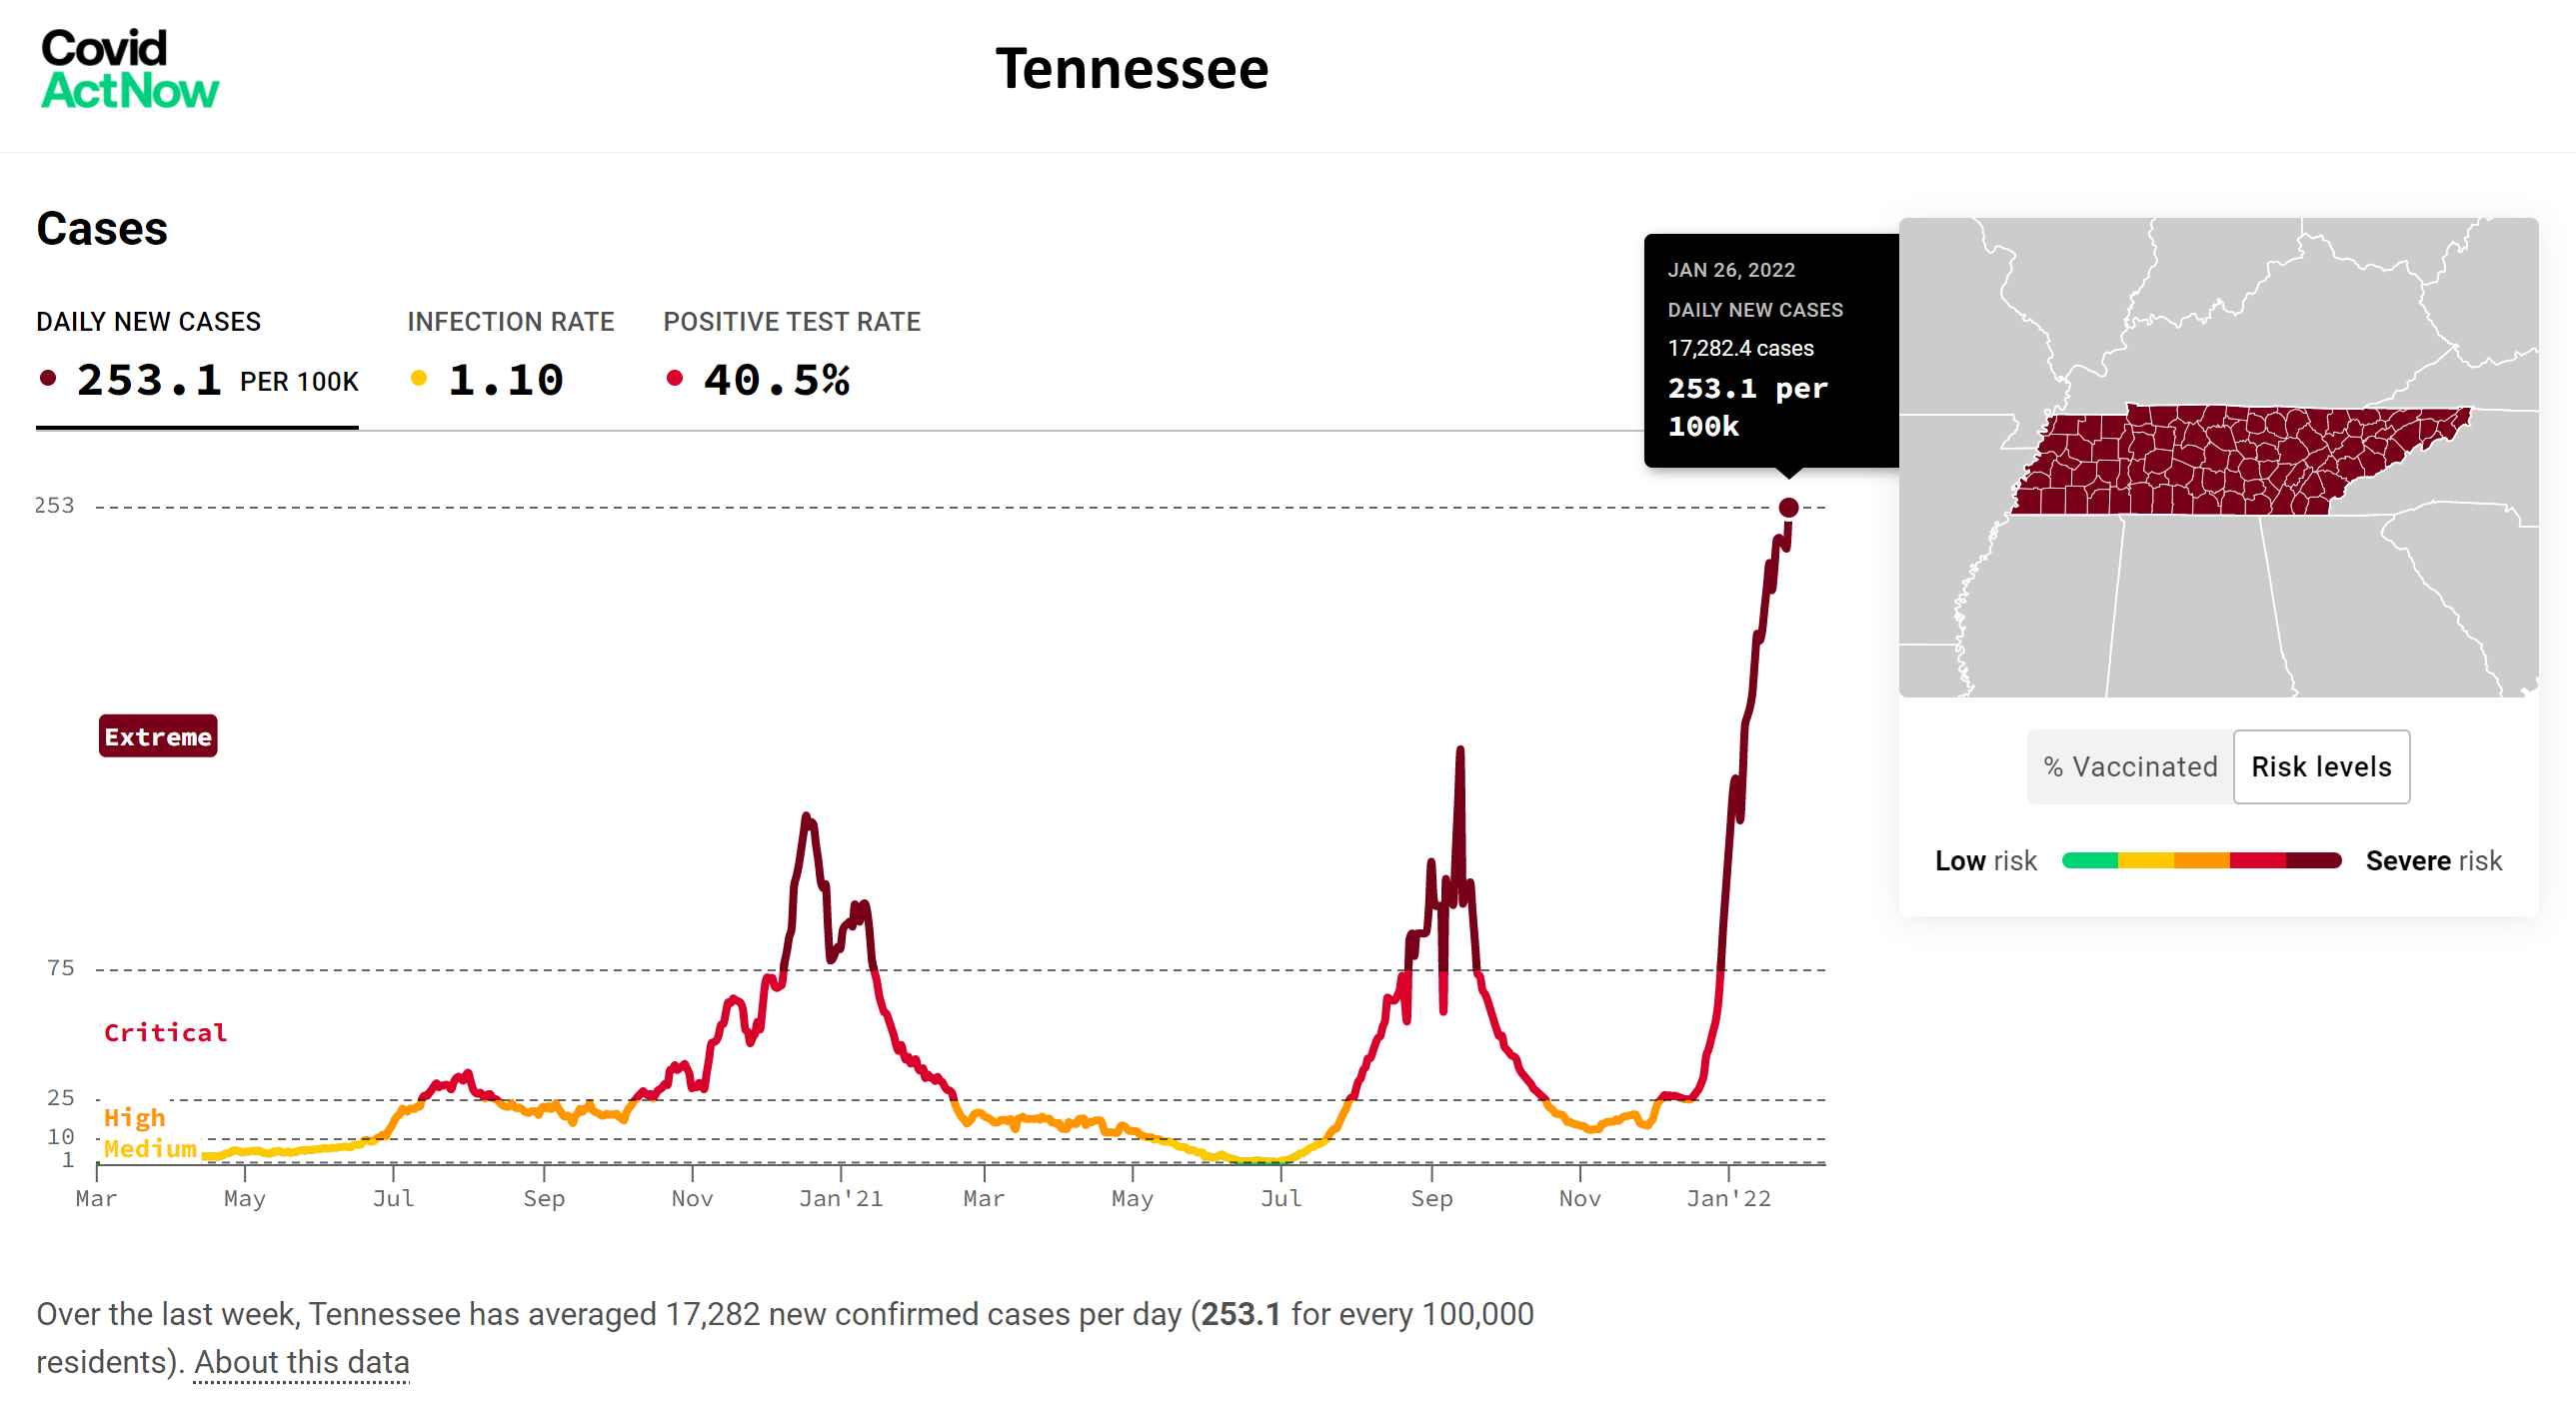
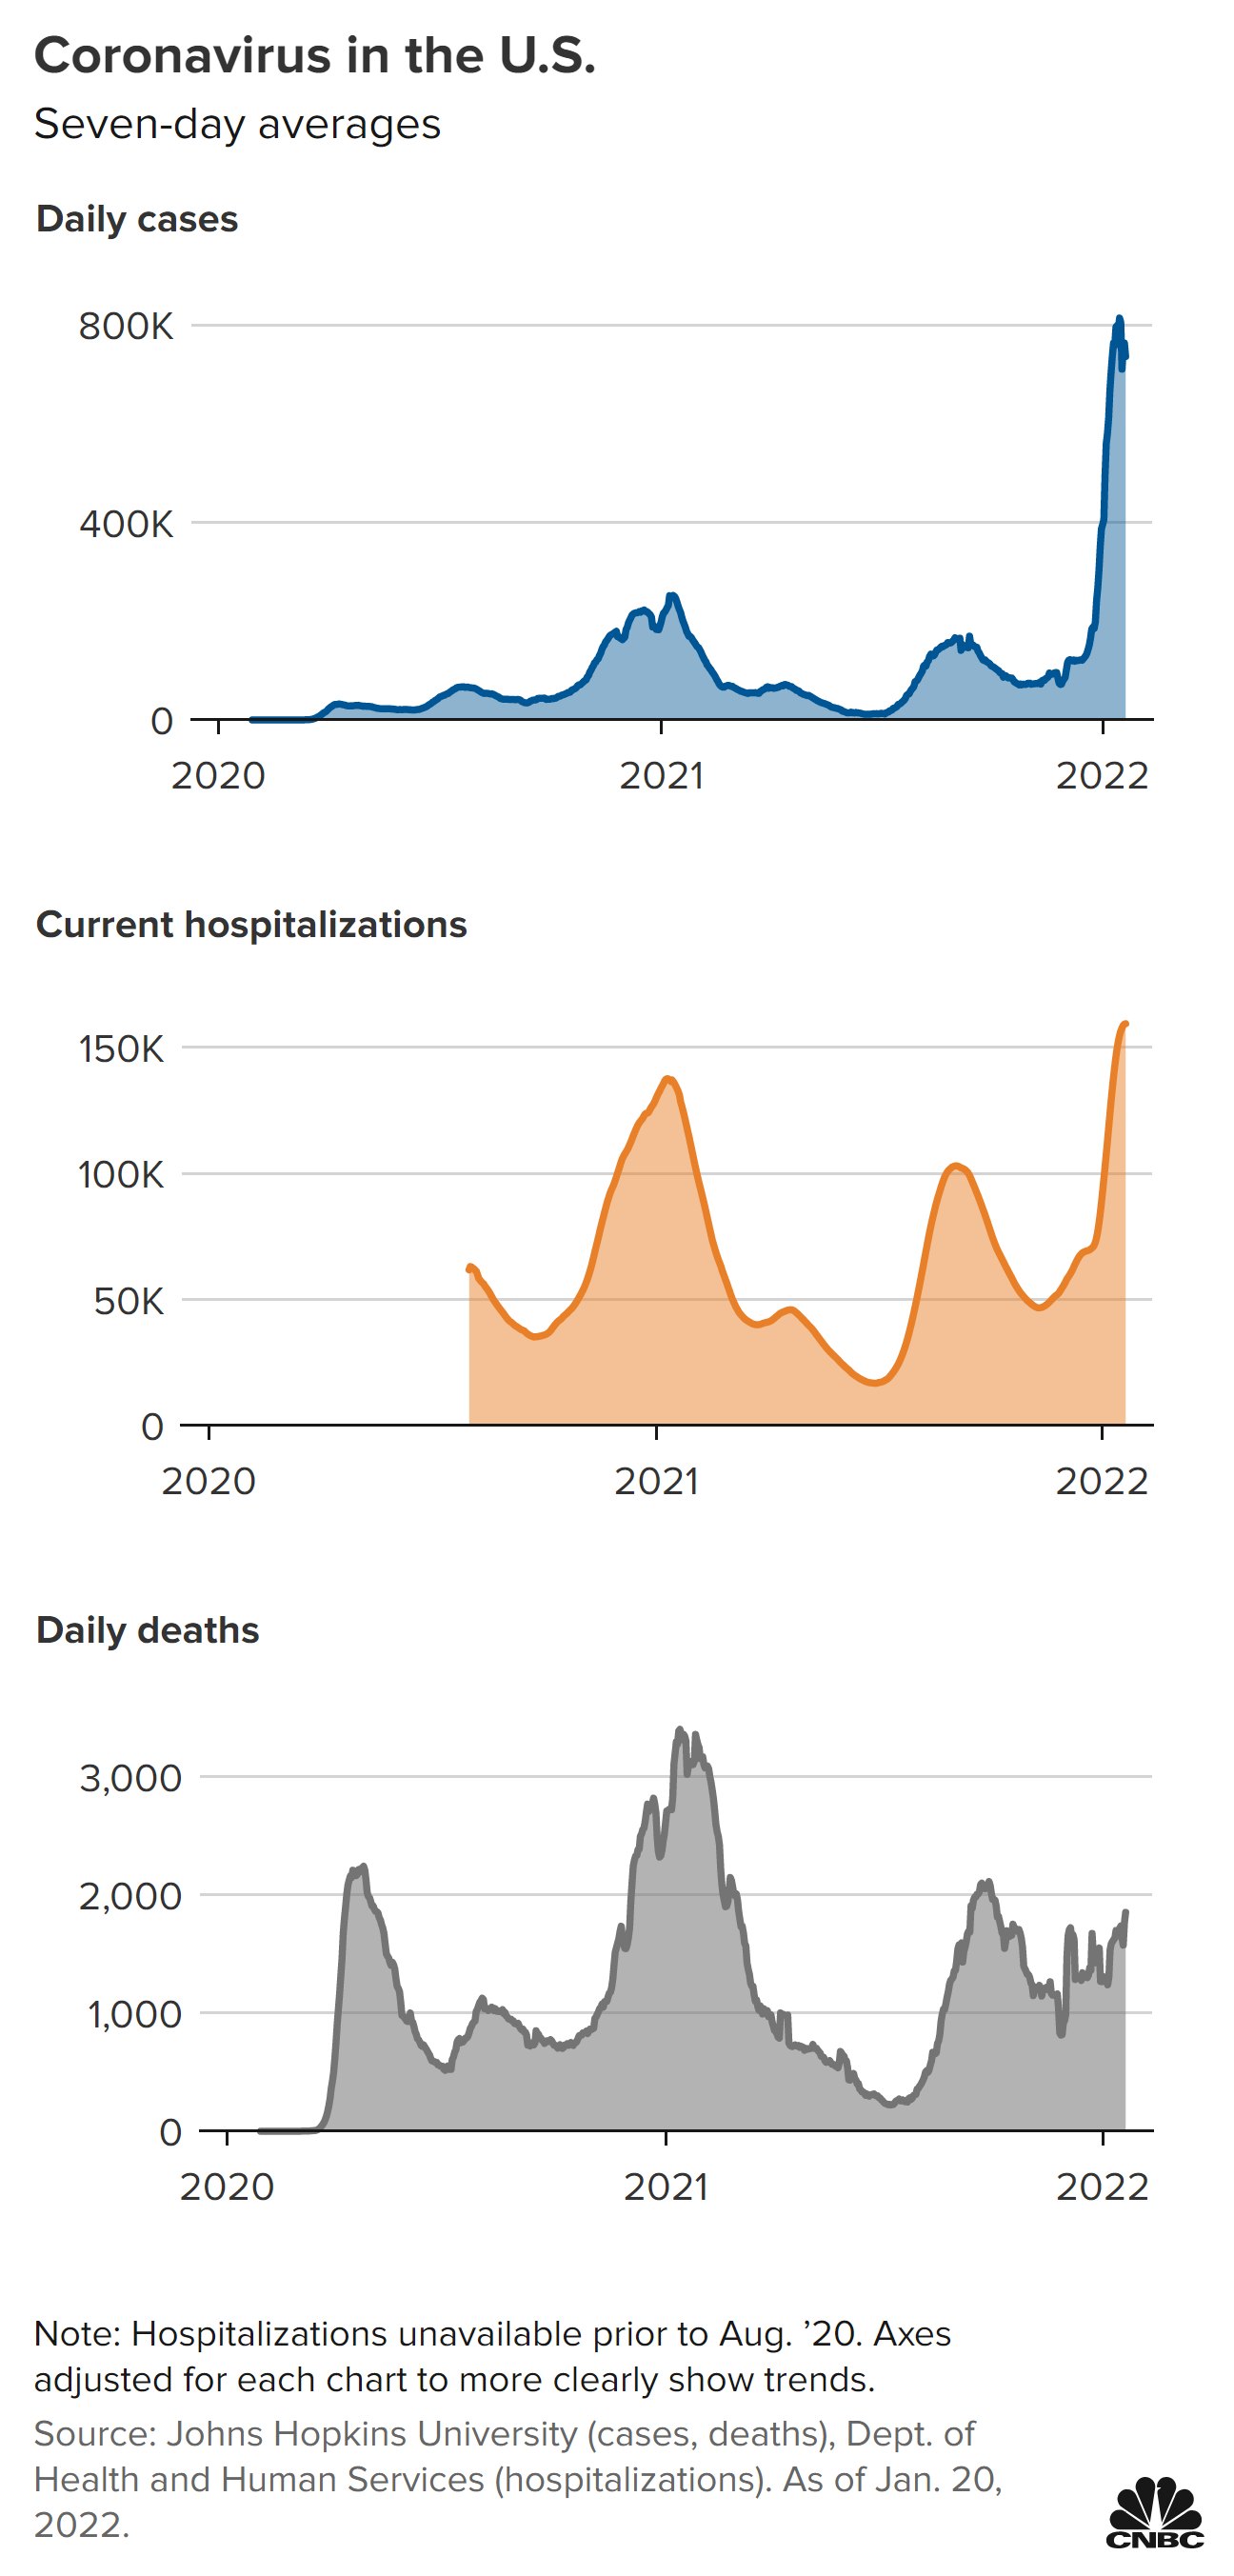
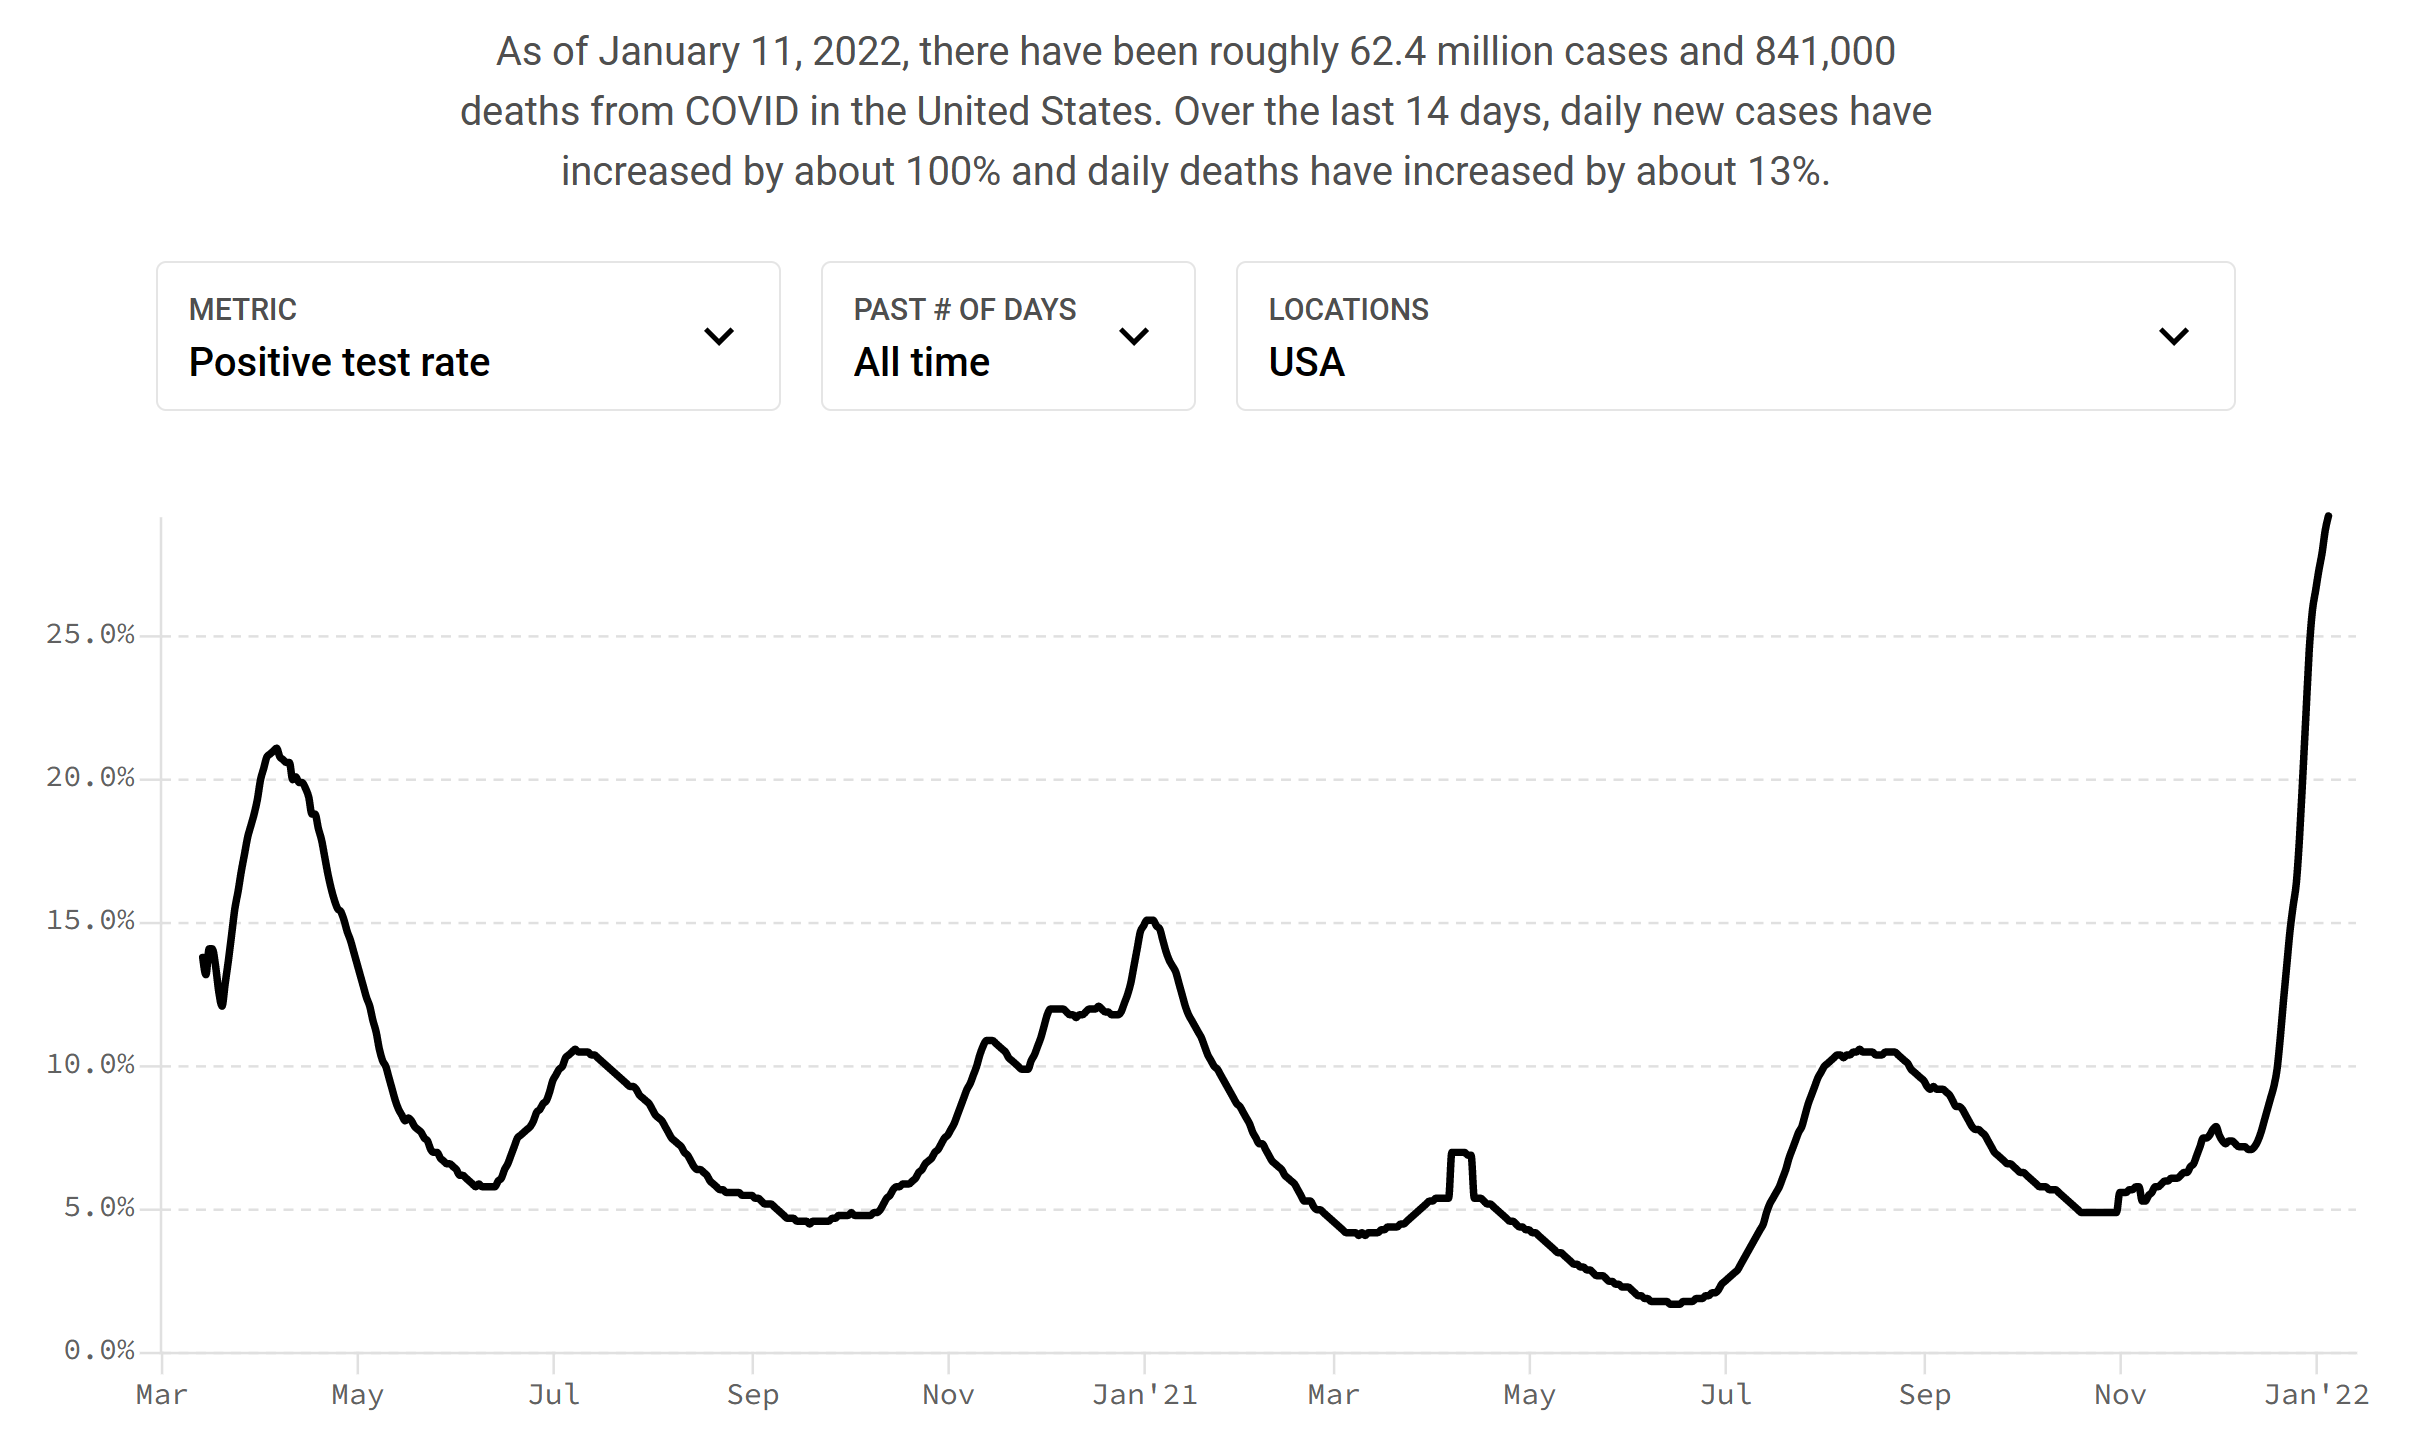
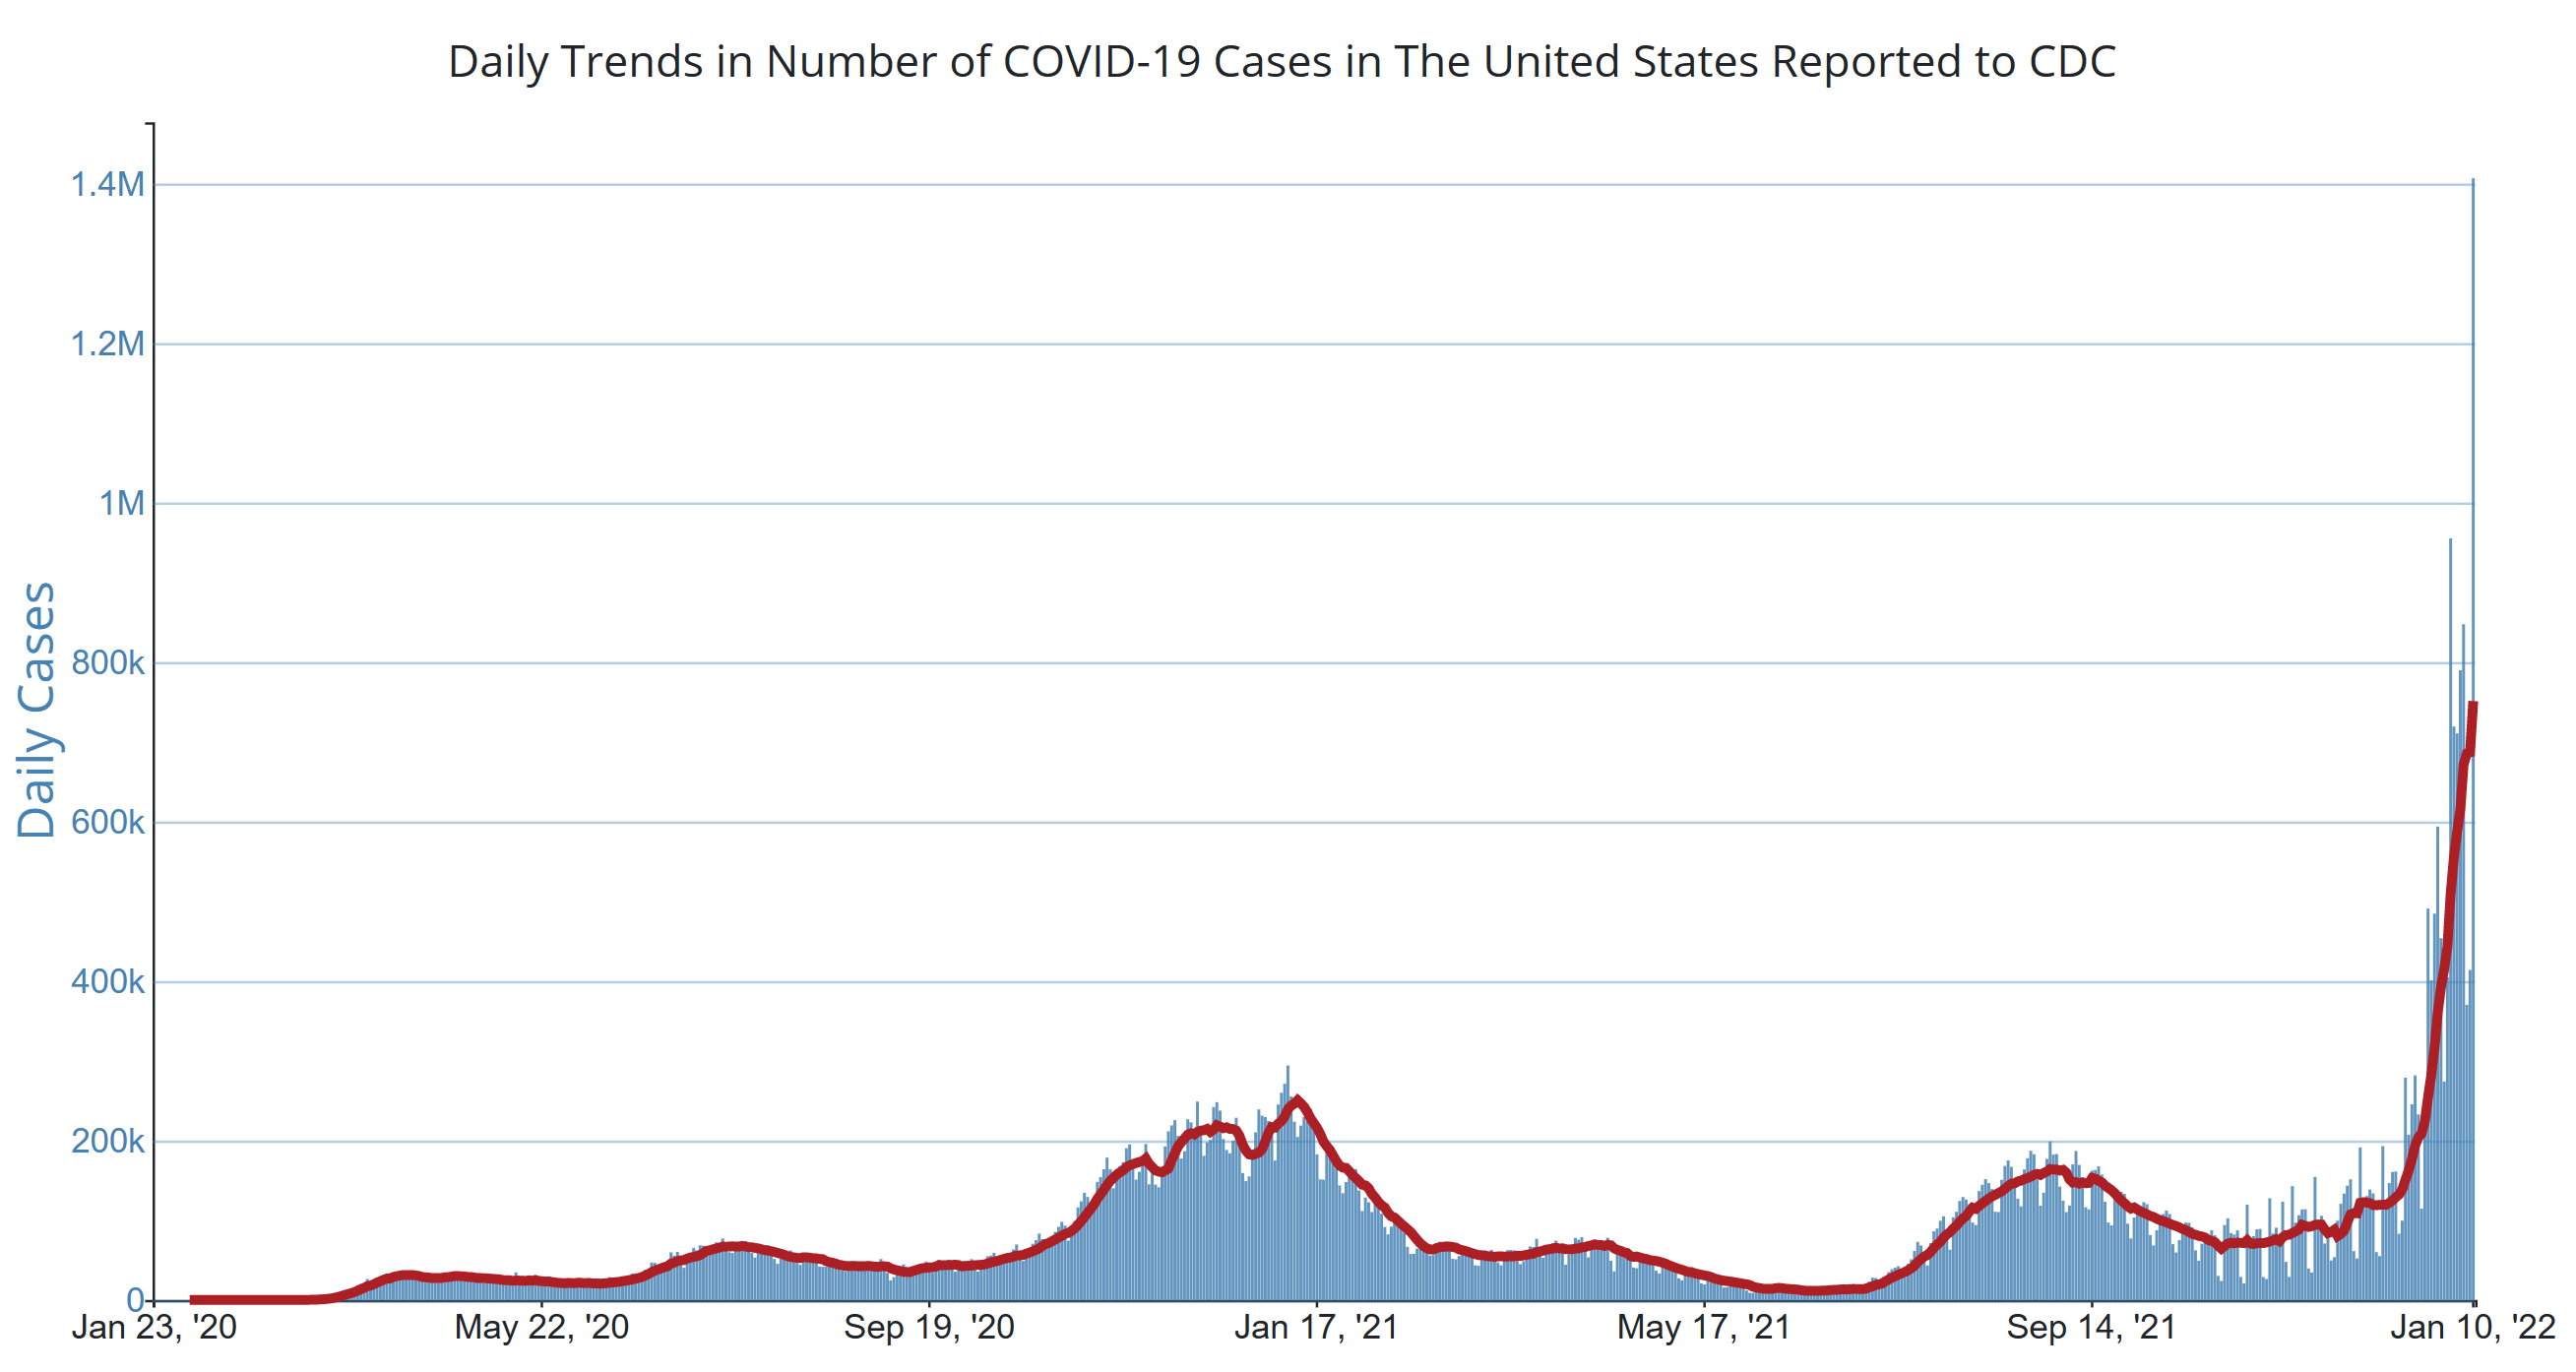
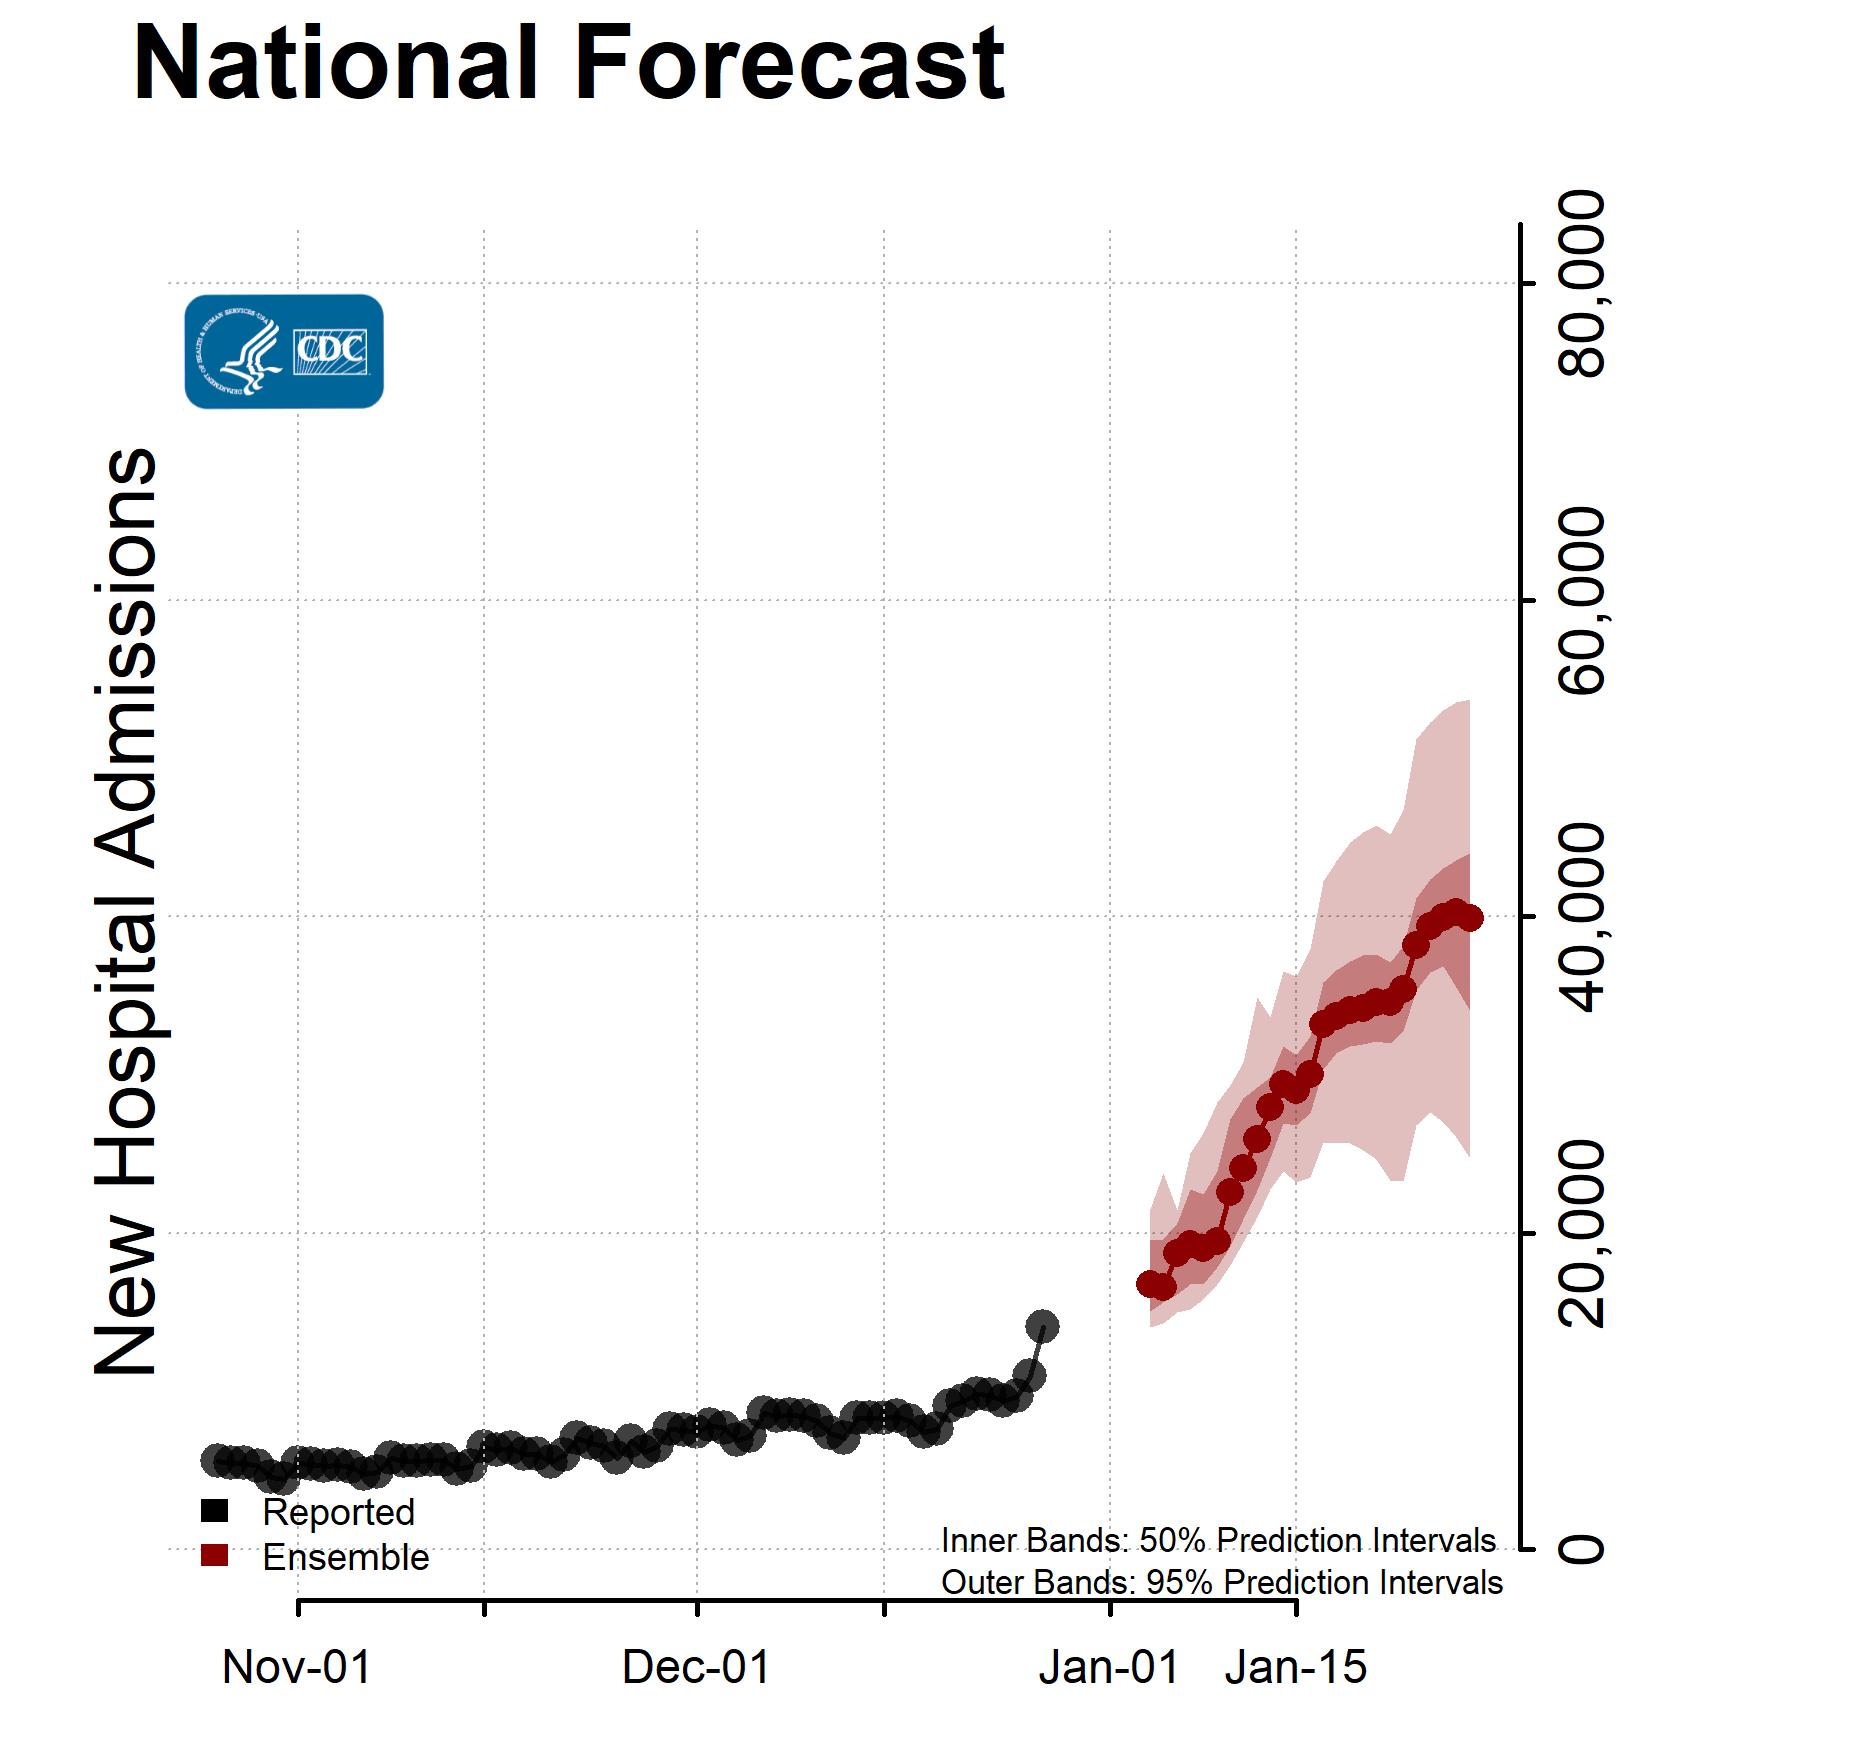
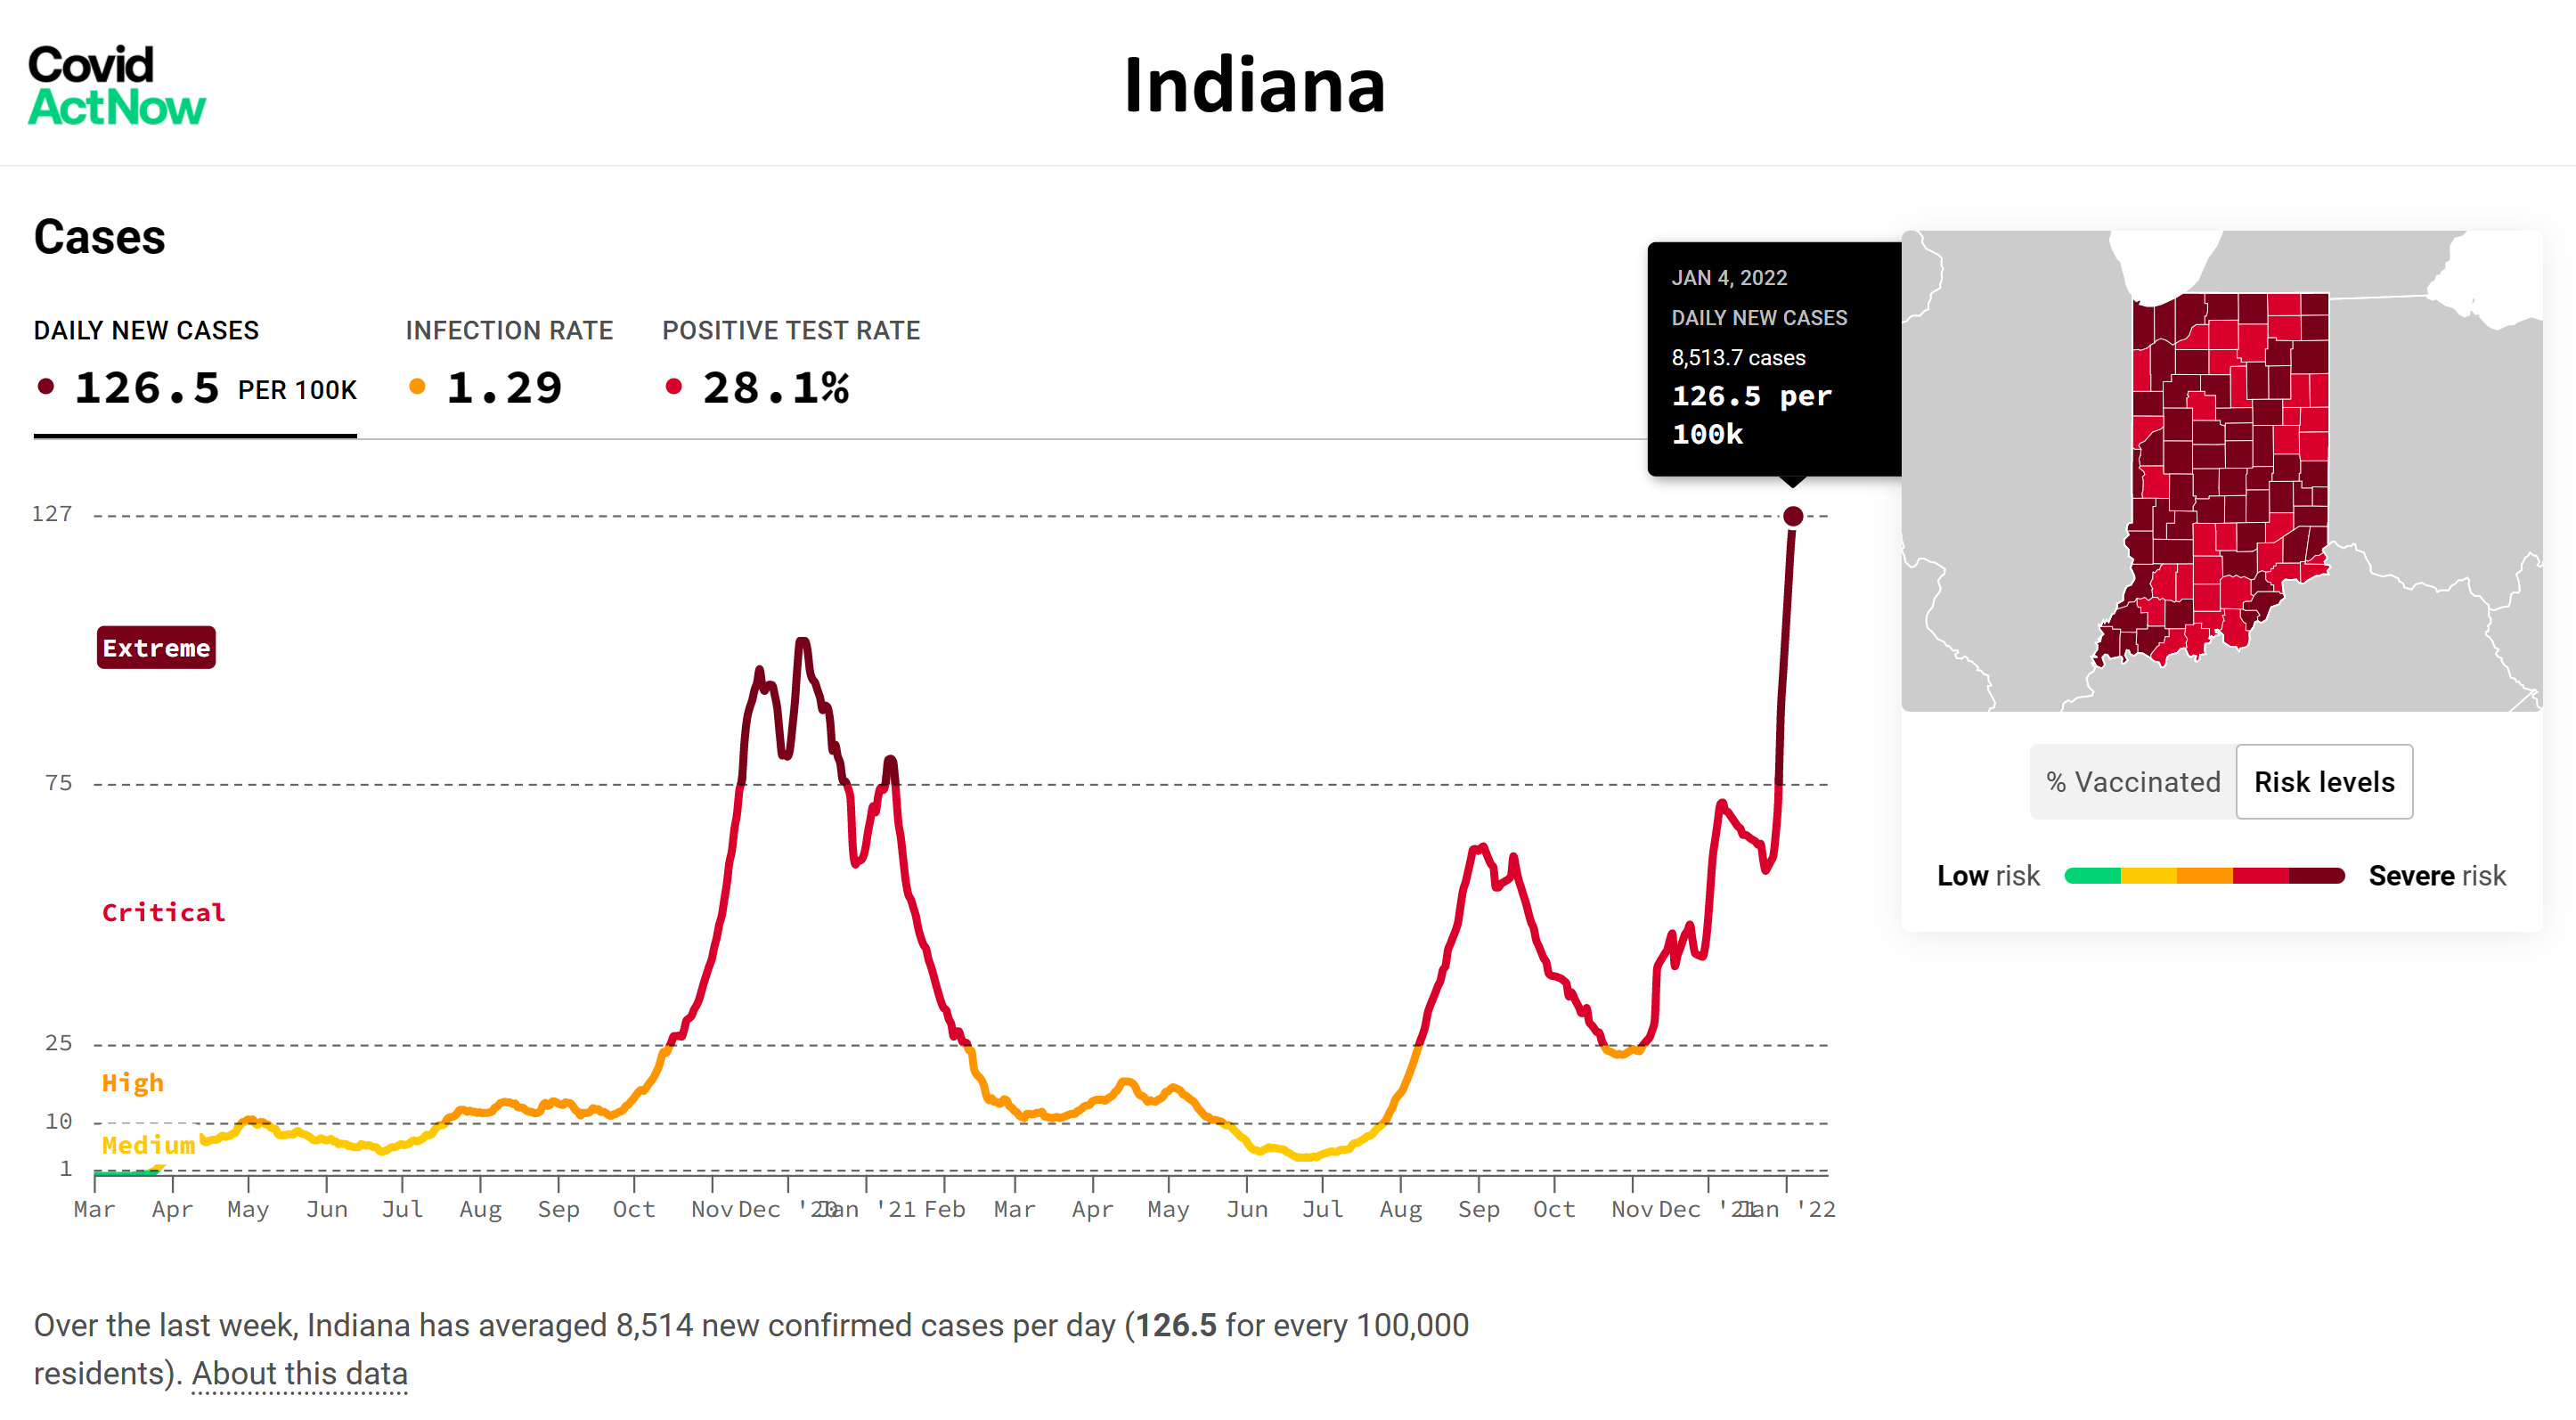
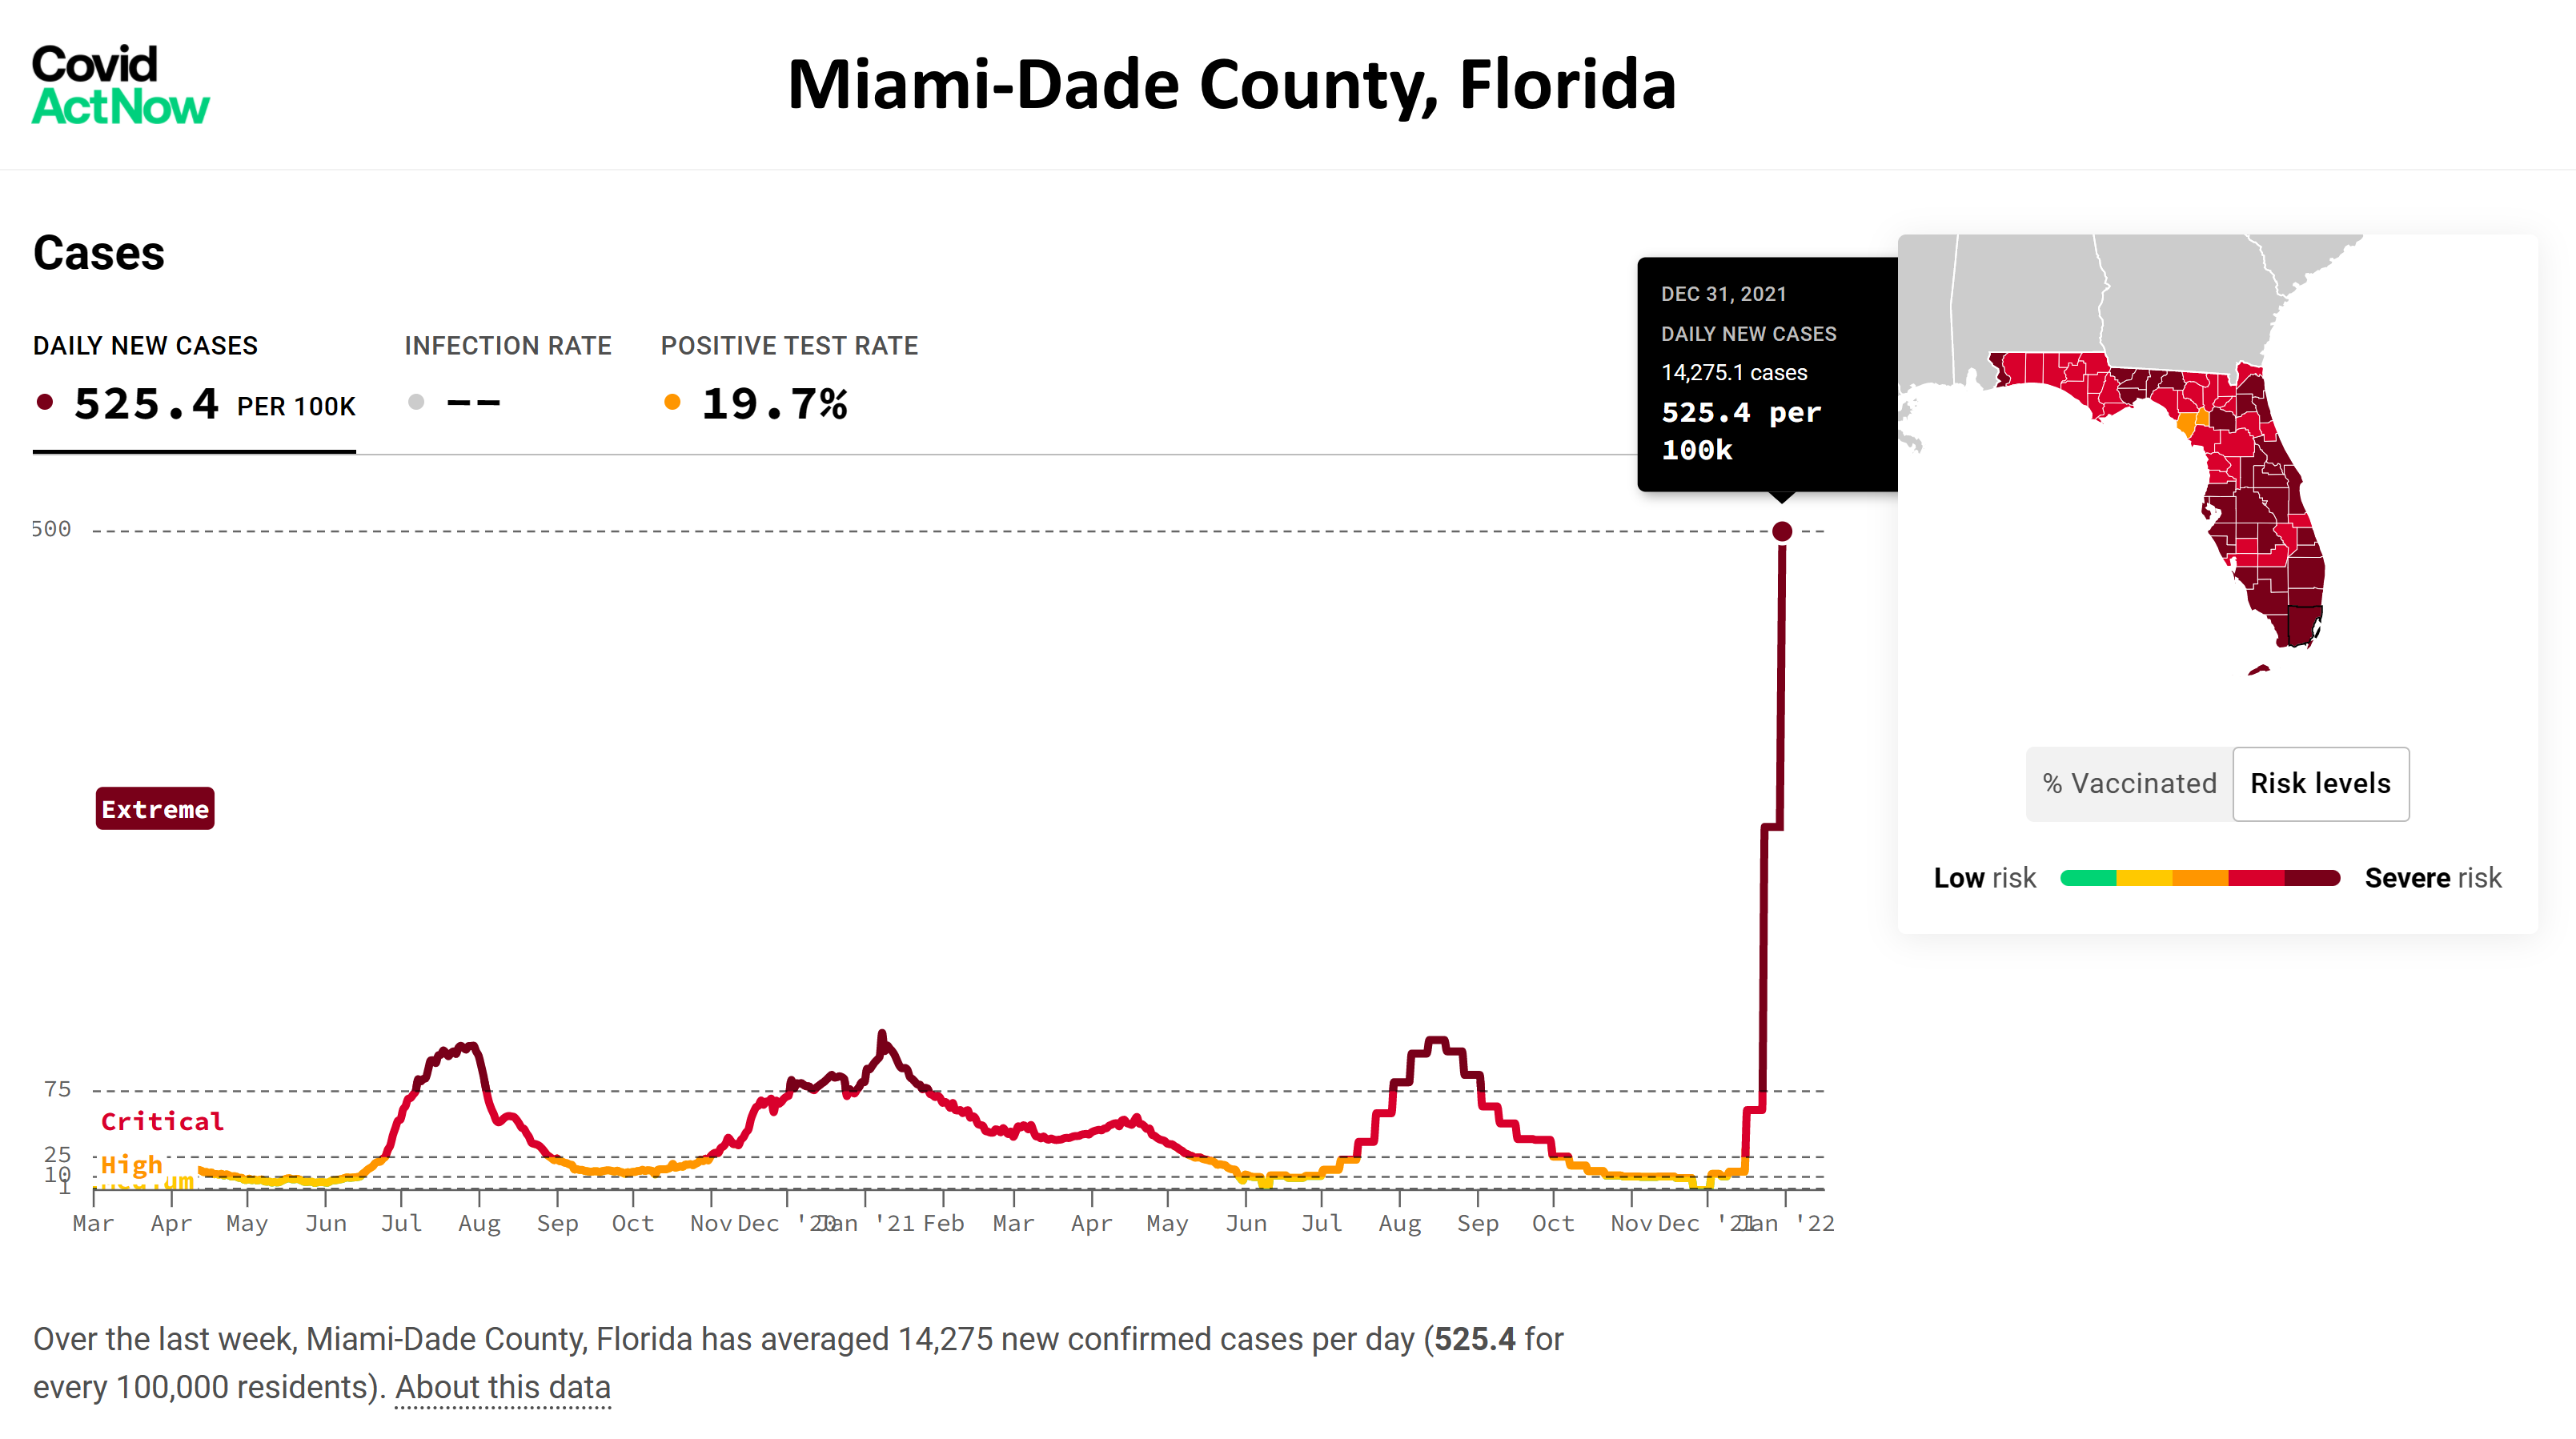
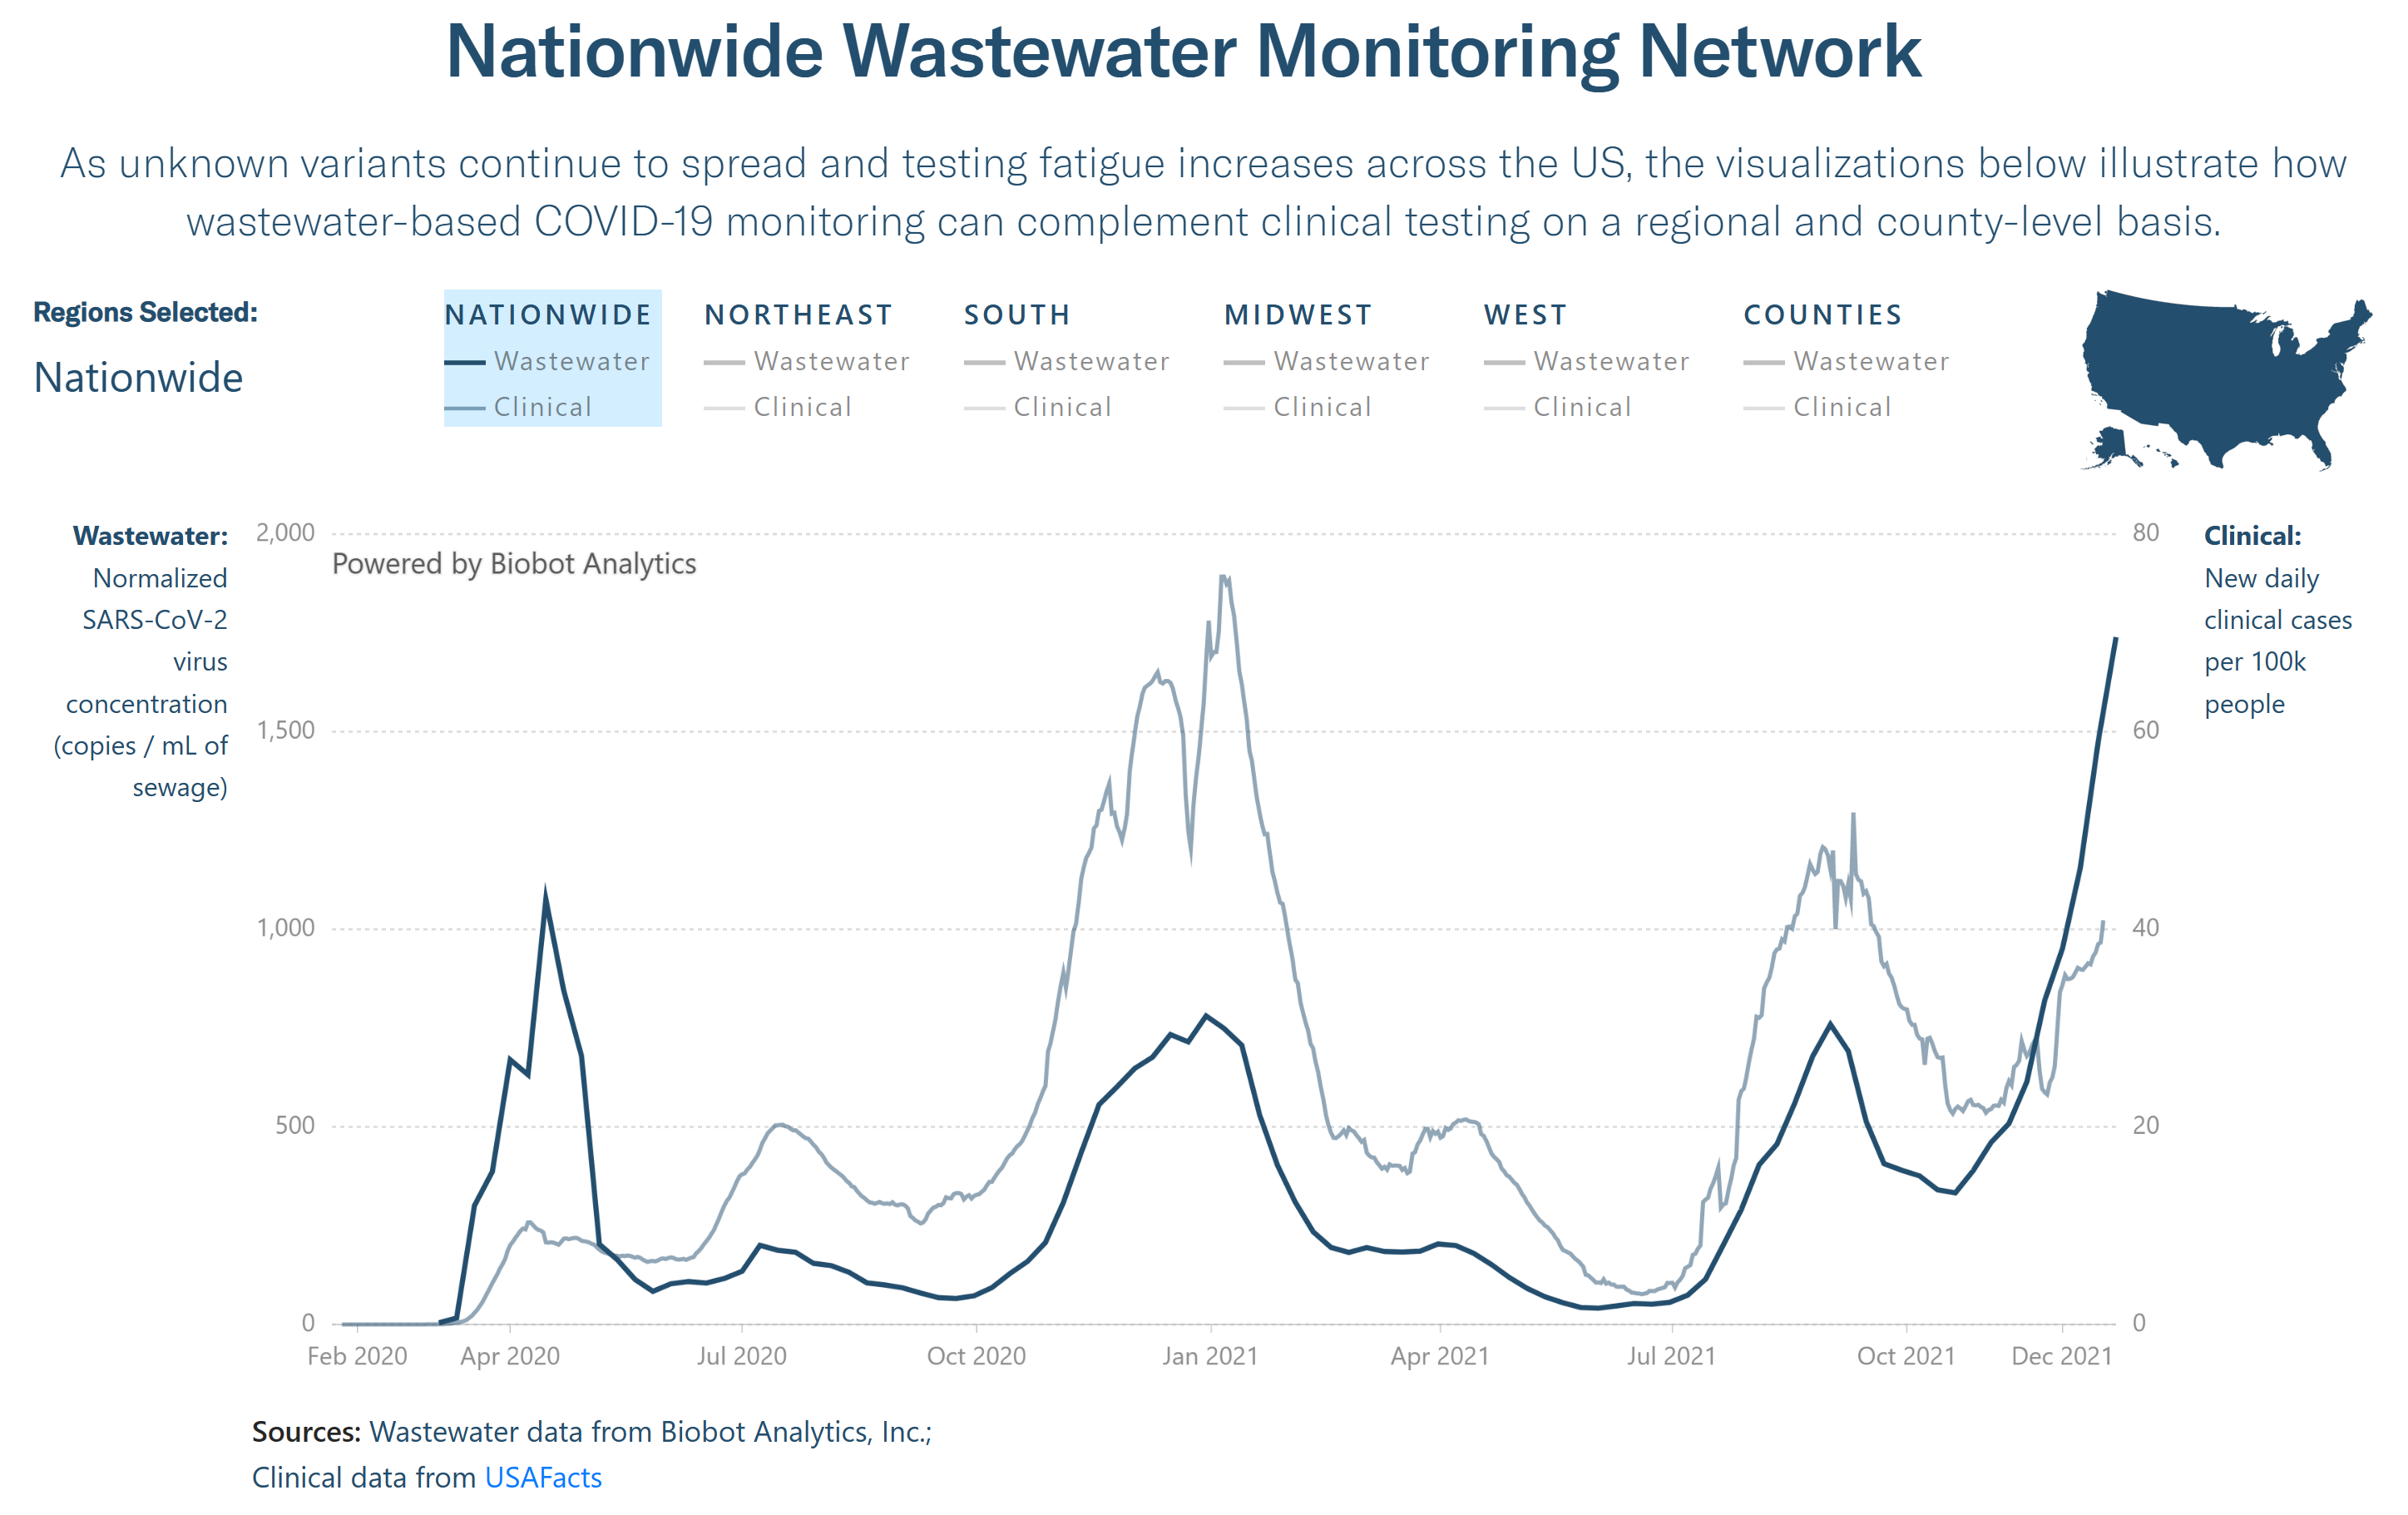
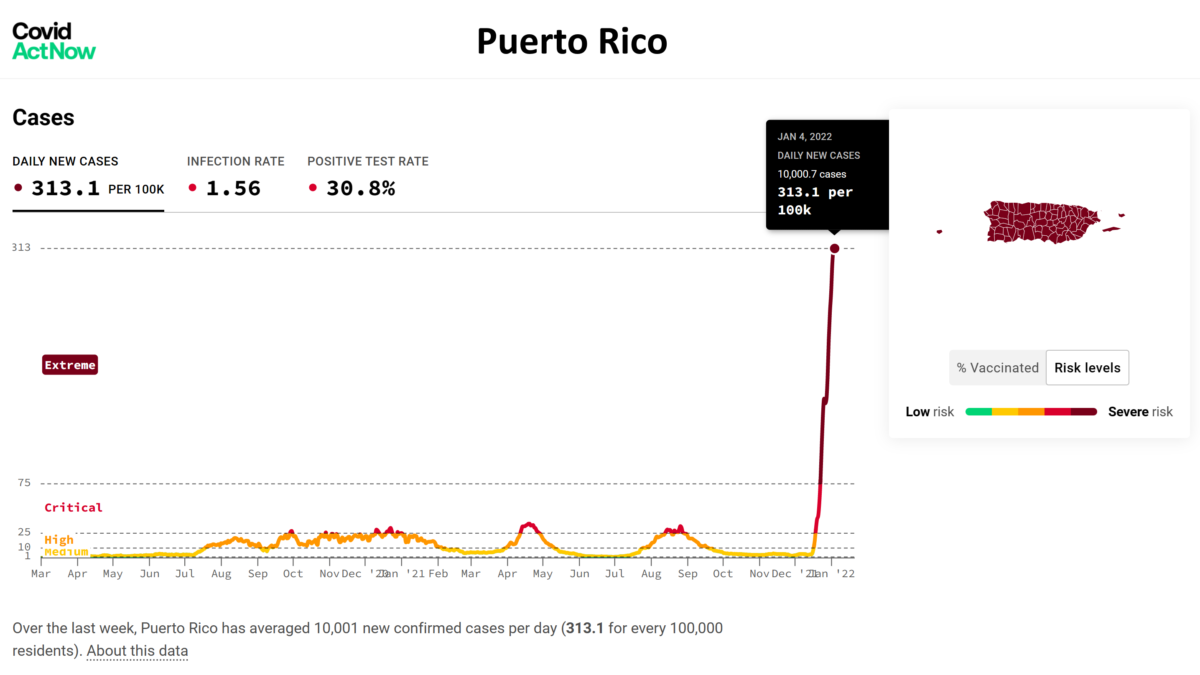
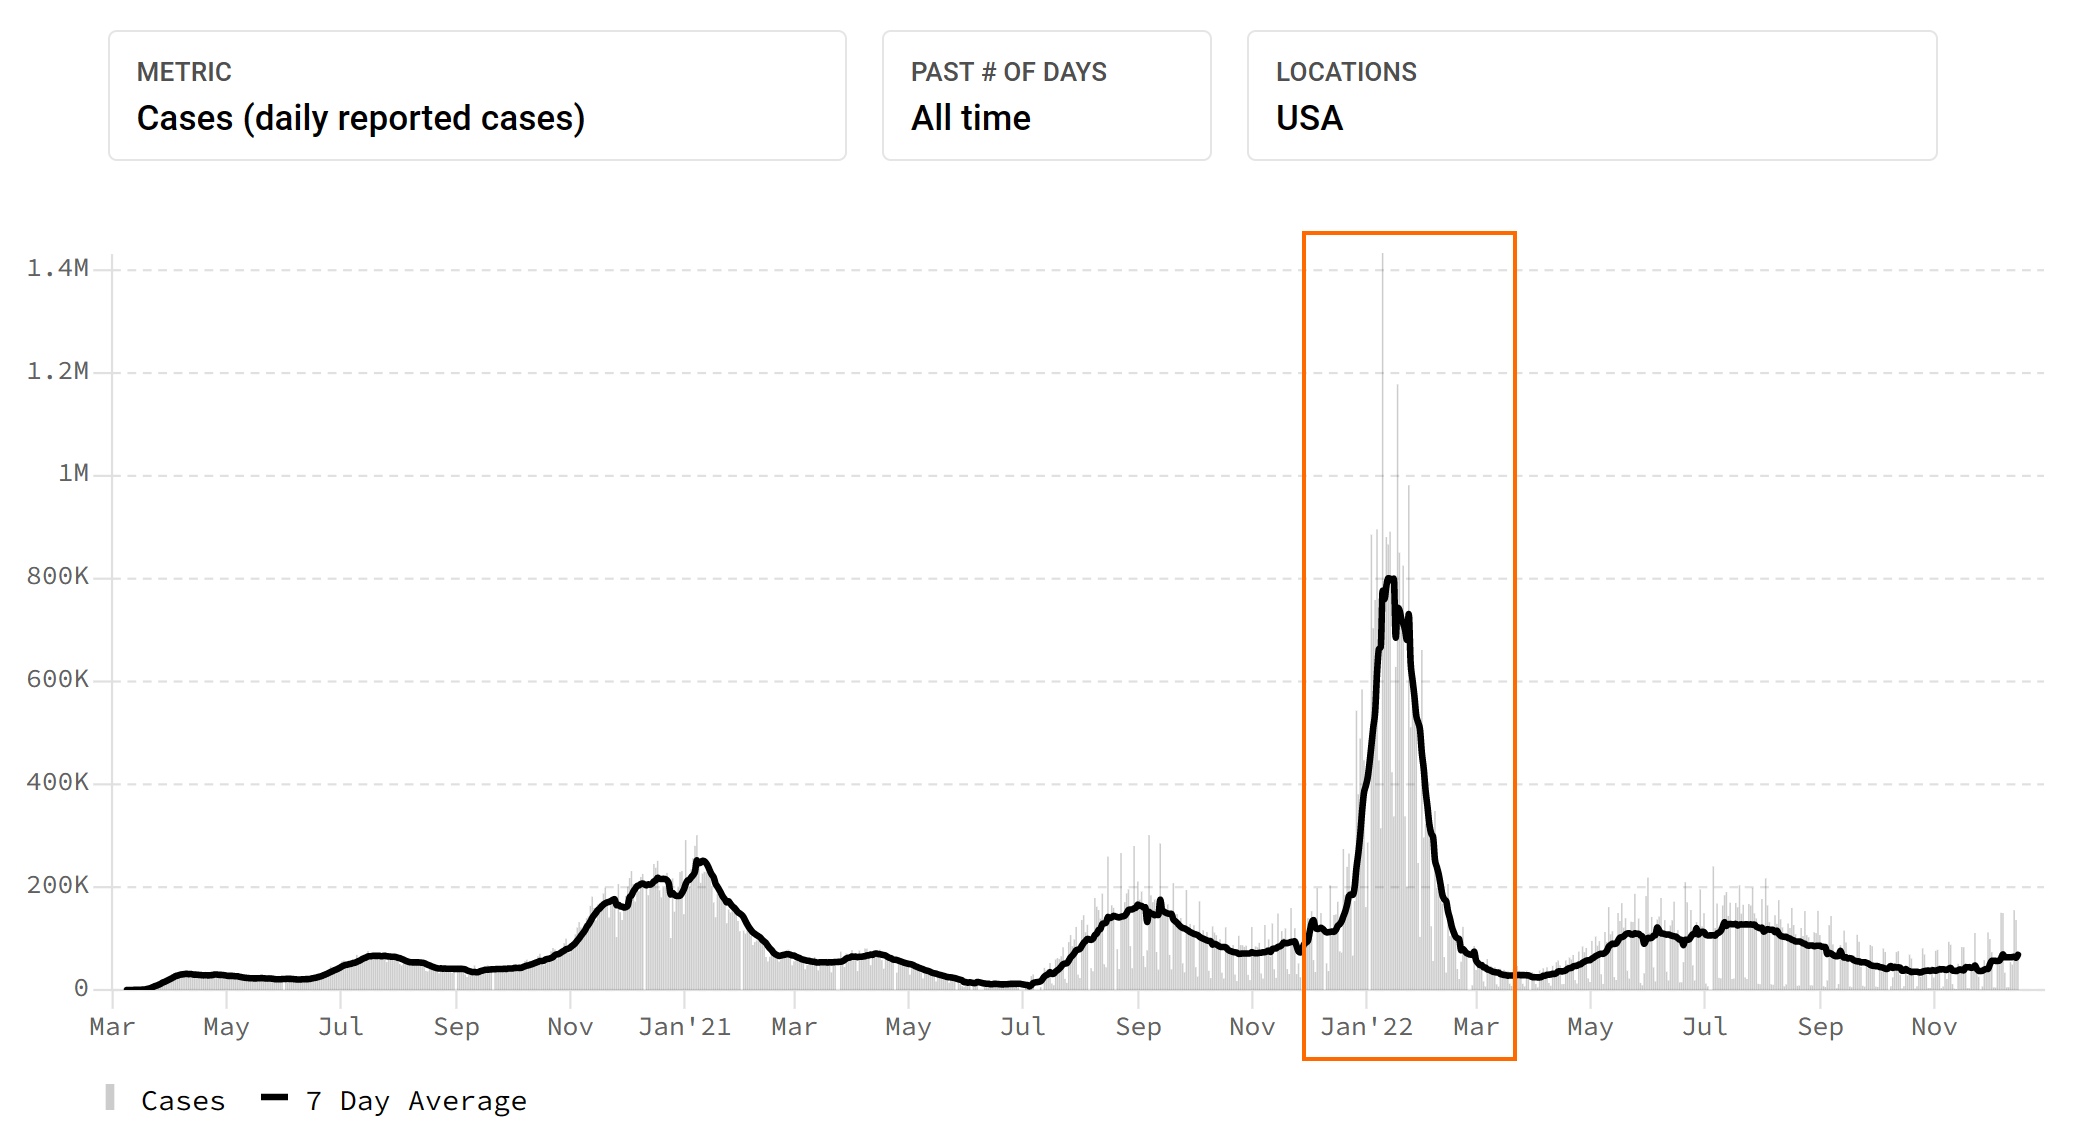
31 December 2022 (Desdemona Despair) – Like the year 2021, 2022 started with Desdemona obsessively tracking statistics on the Covid pandemic. The incredibly contagious Omicron variant was raging throughout the world, dwarfing the scale of the previous waves. Some of Desdemona’s friends fell ill with the disease. Fortunately, none of them died, because they were vaccinated, but some suffered for months with long Covid. A few suffer still.
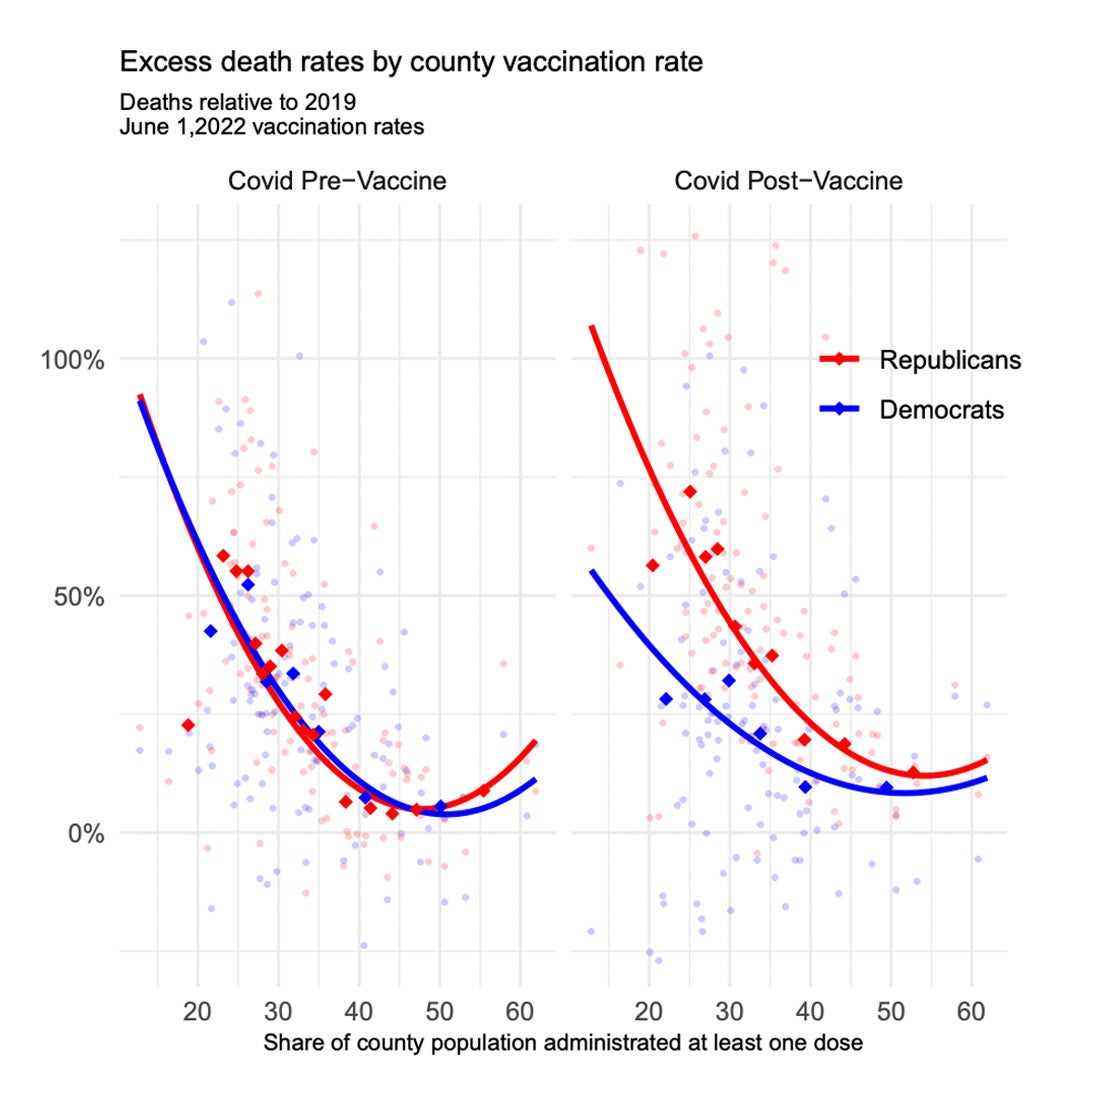
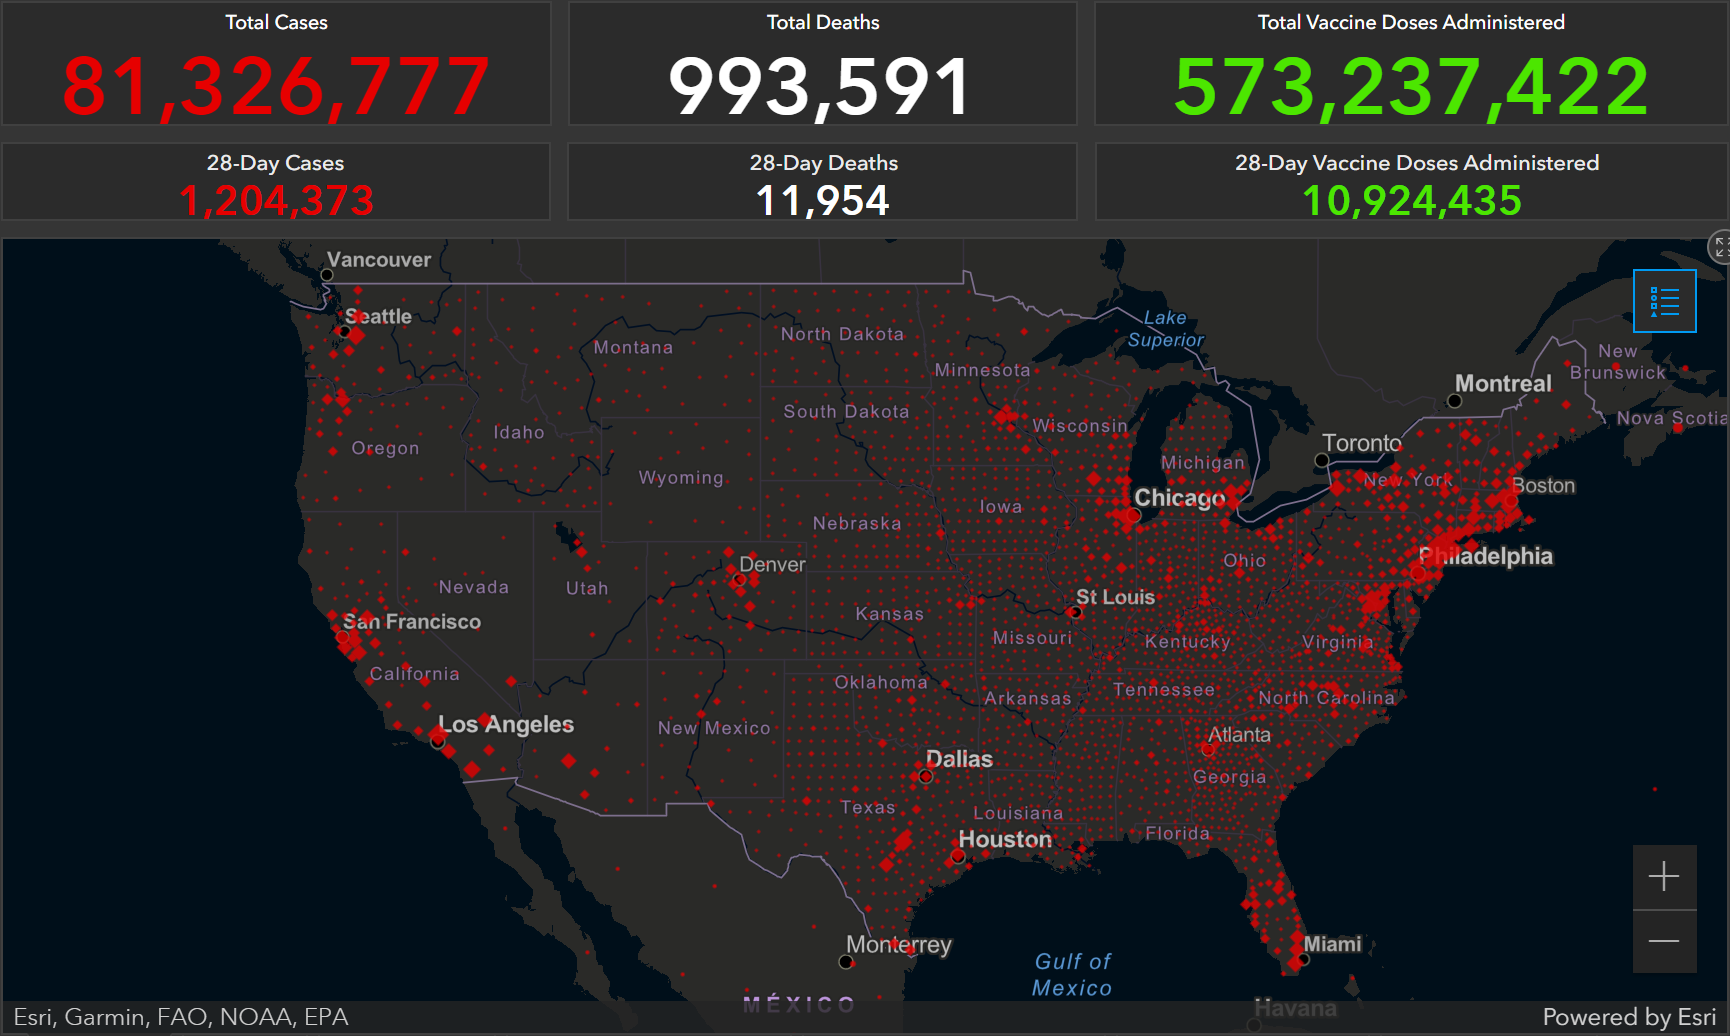
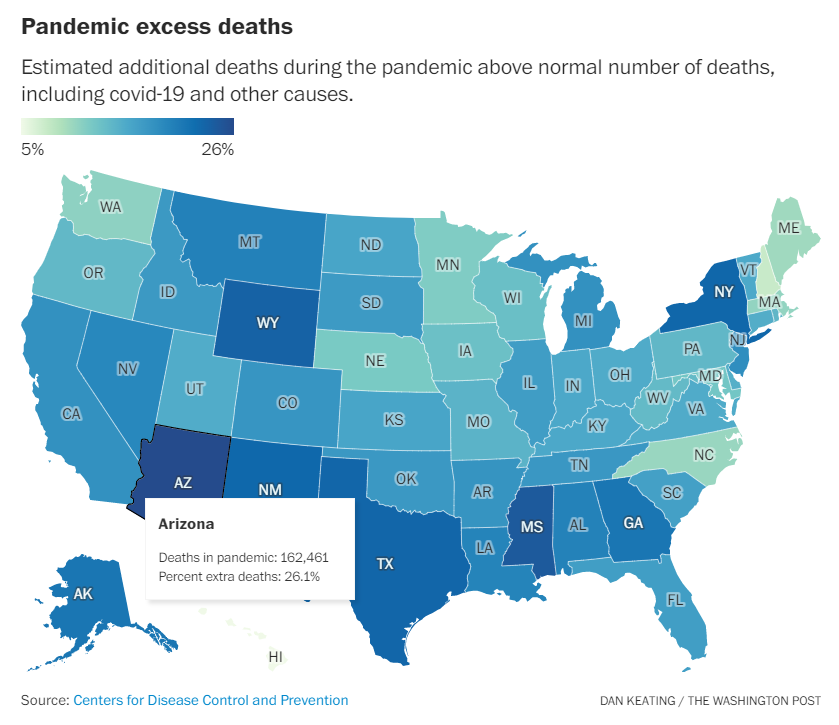
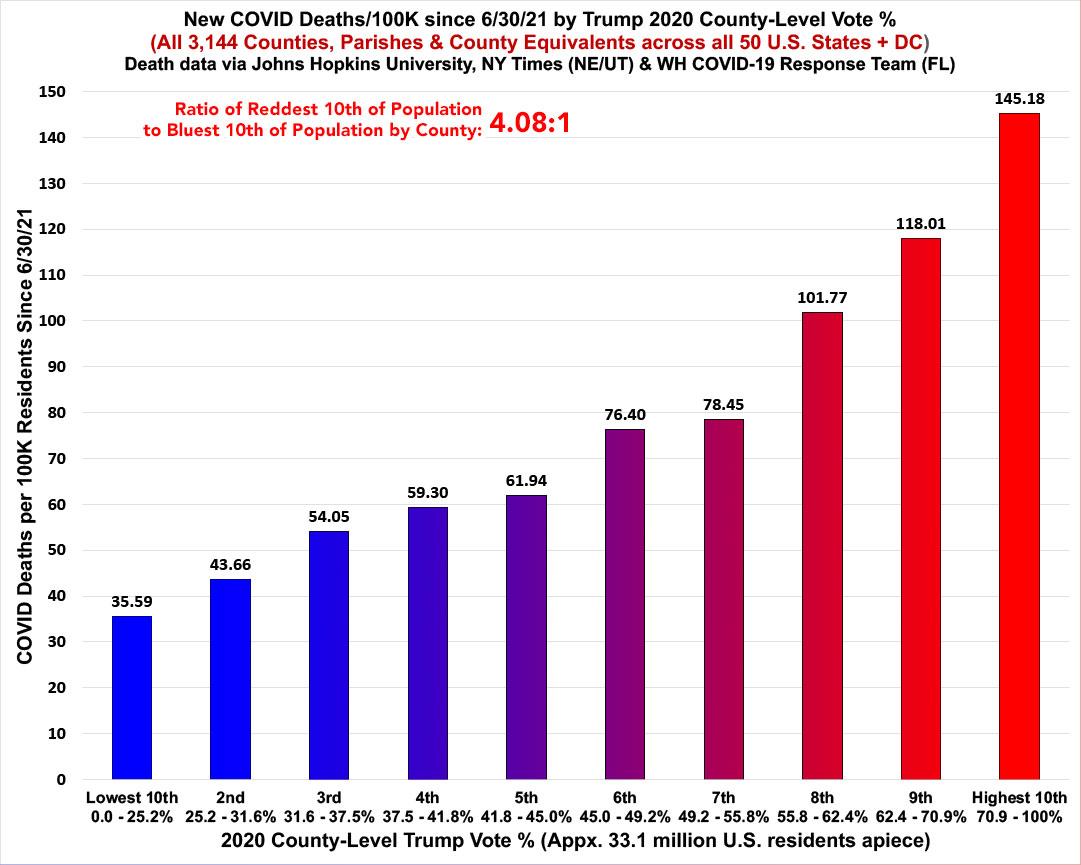
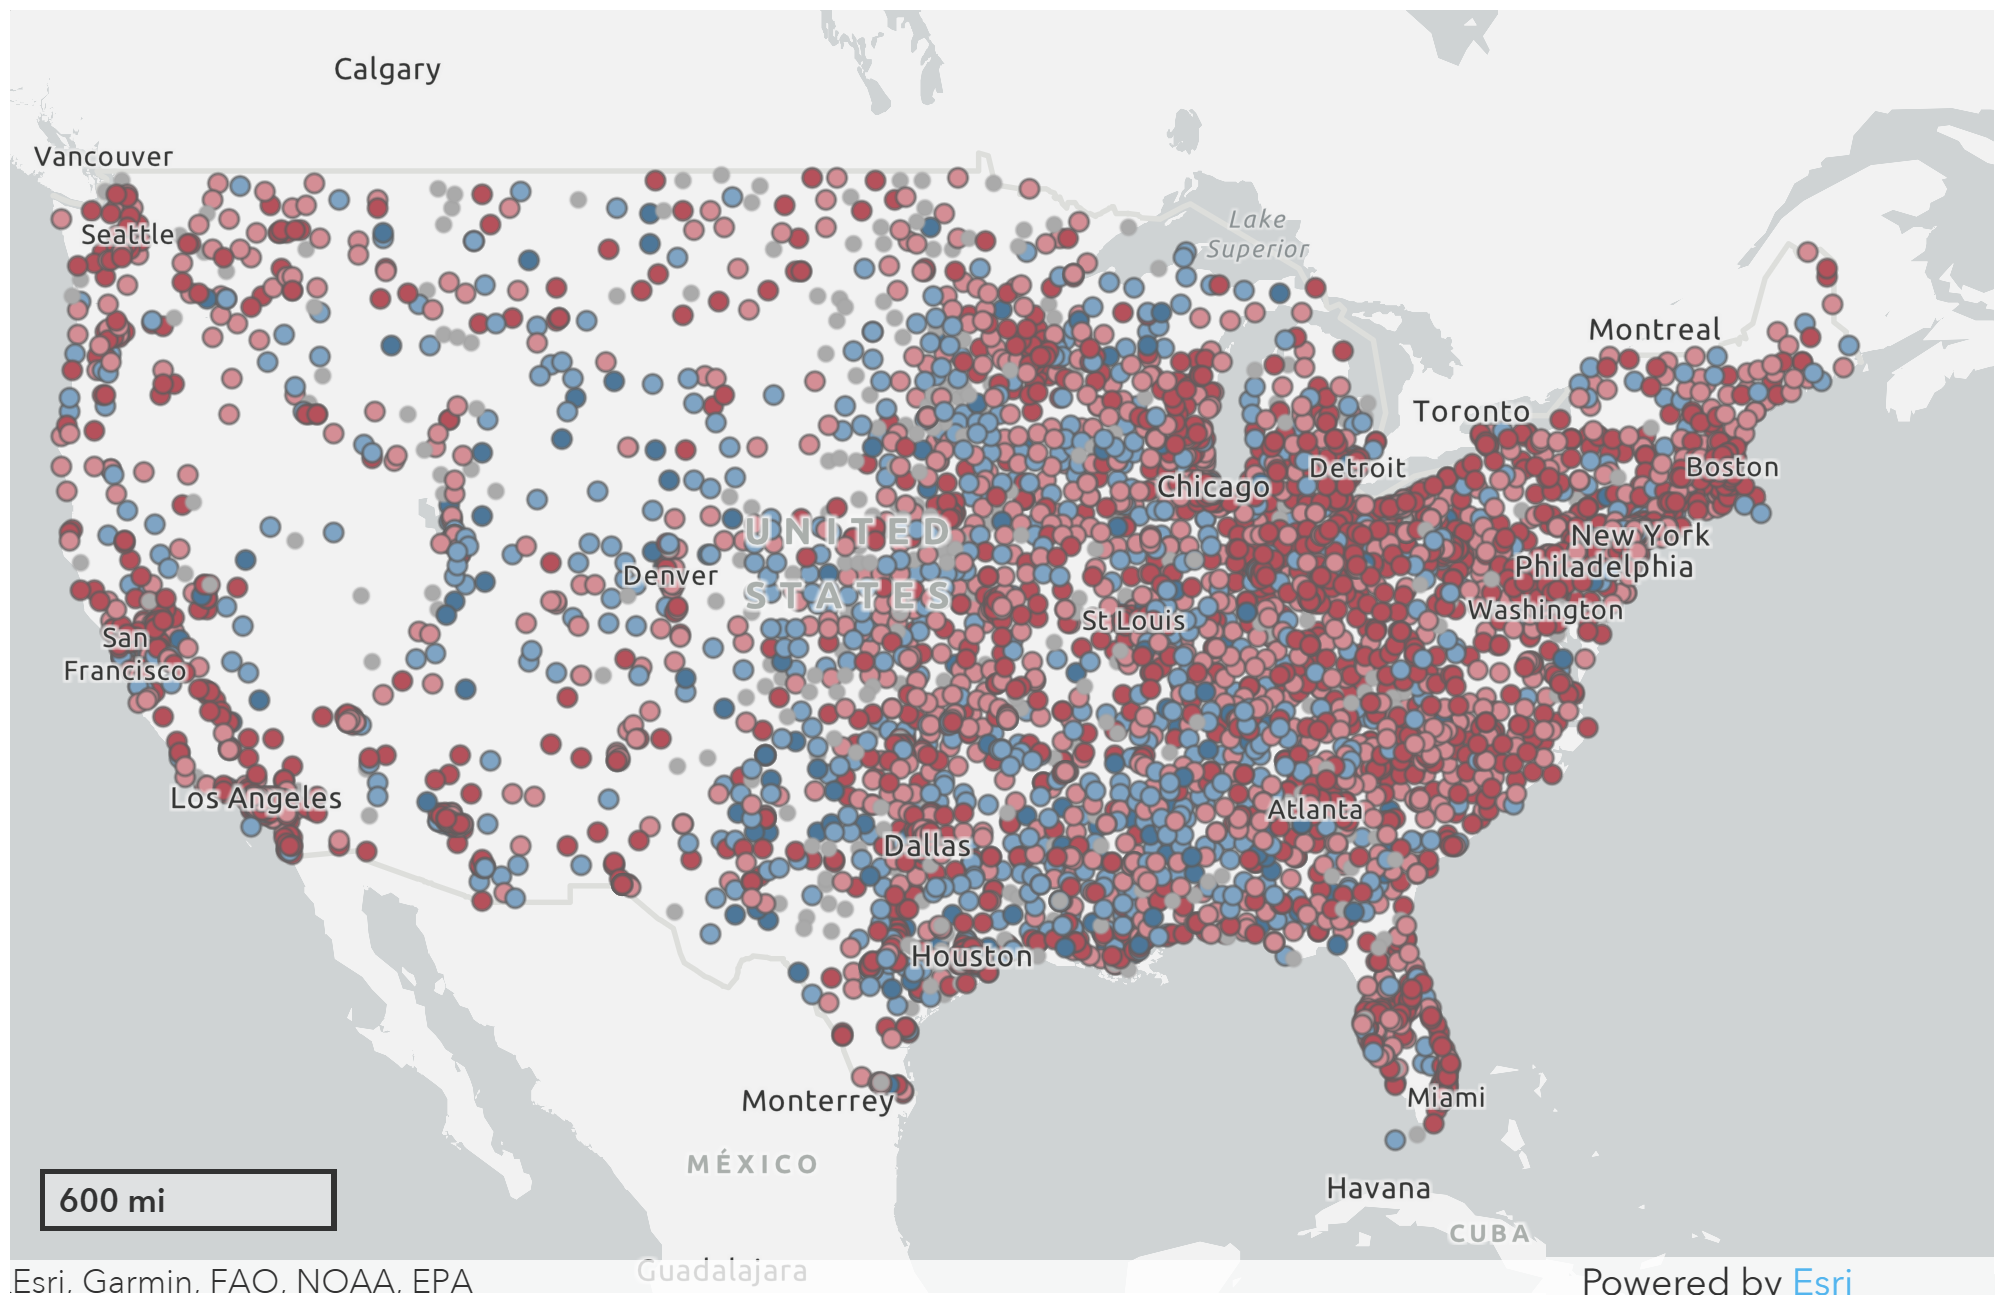
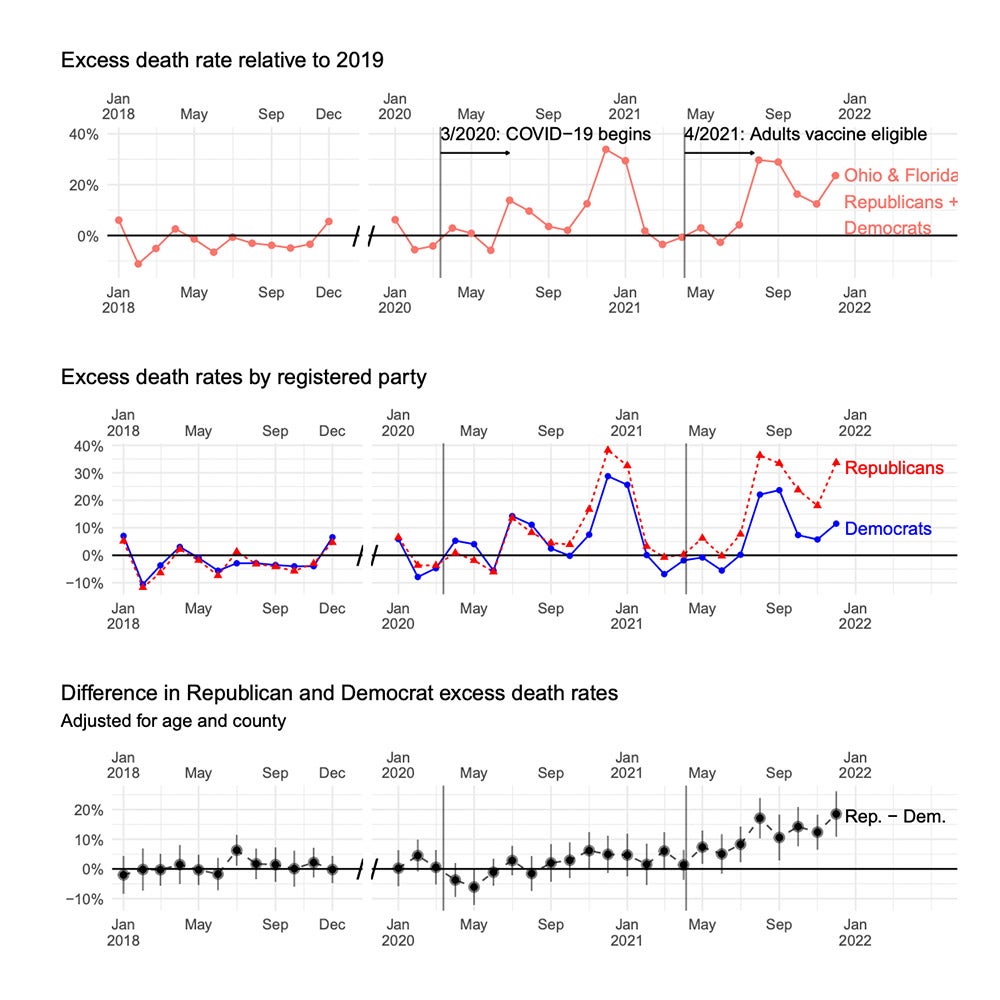
In February 2022, excess deaths during the pandemic in the U.S. exceeded one million, and by May, deaths attributed directly to Covid surpassed the one million mark. As The Washington Post reminded us, we weren’t supposed to get anywhere near 1 million COVID deaths in the U.S. Then we did. The lethal effect of relentless anti-vaccine disinformation from far-right sources became visible in the mortality statistics, with the excess death rate for Republicans 76 percent higher than the excess death rate for Democrats.
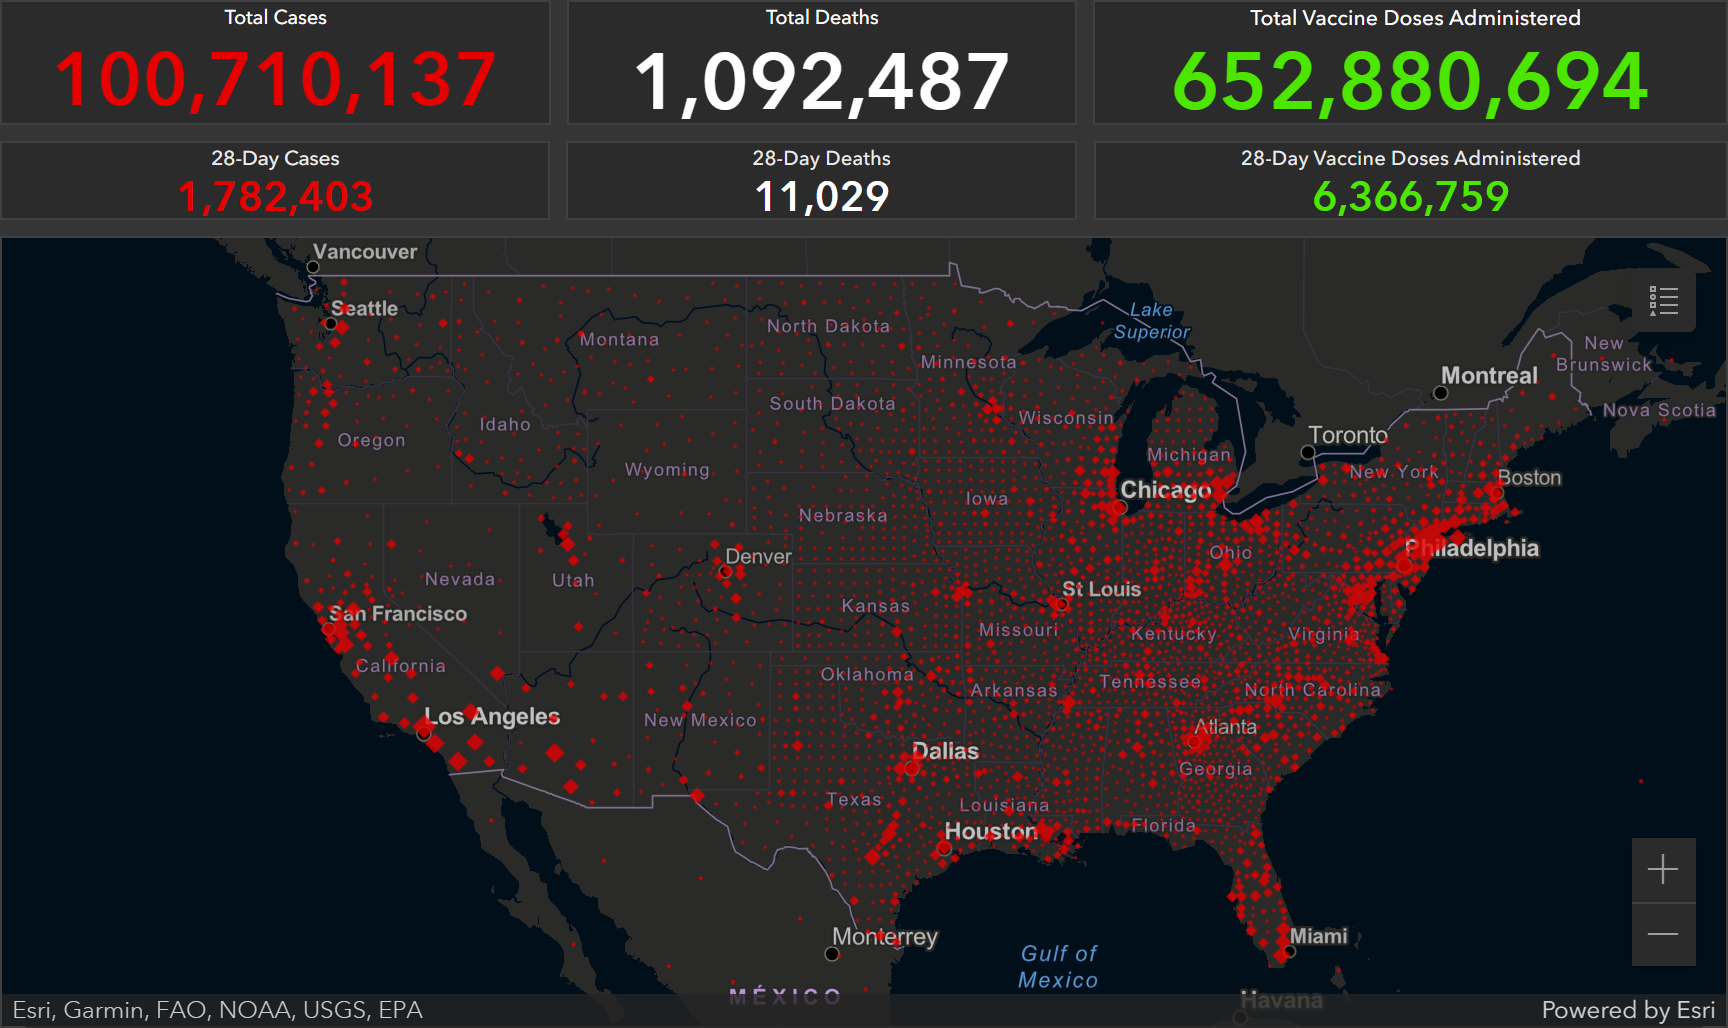
By the end of 2022, the total Covid mortality in the U.S. approached 1.1 million people, with more than 100 million cases – nearly one-third of the U.S. population.
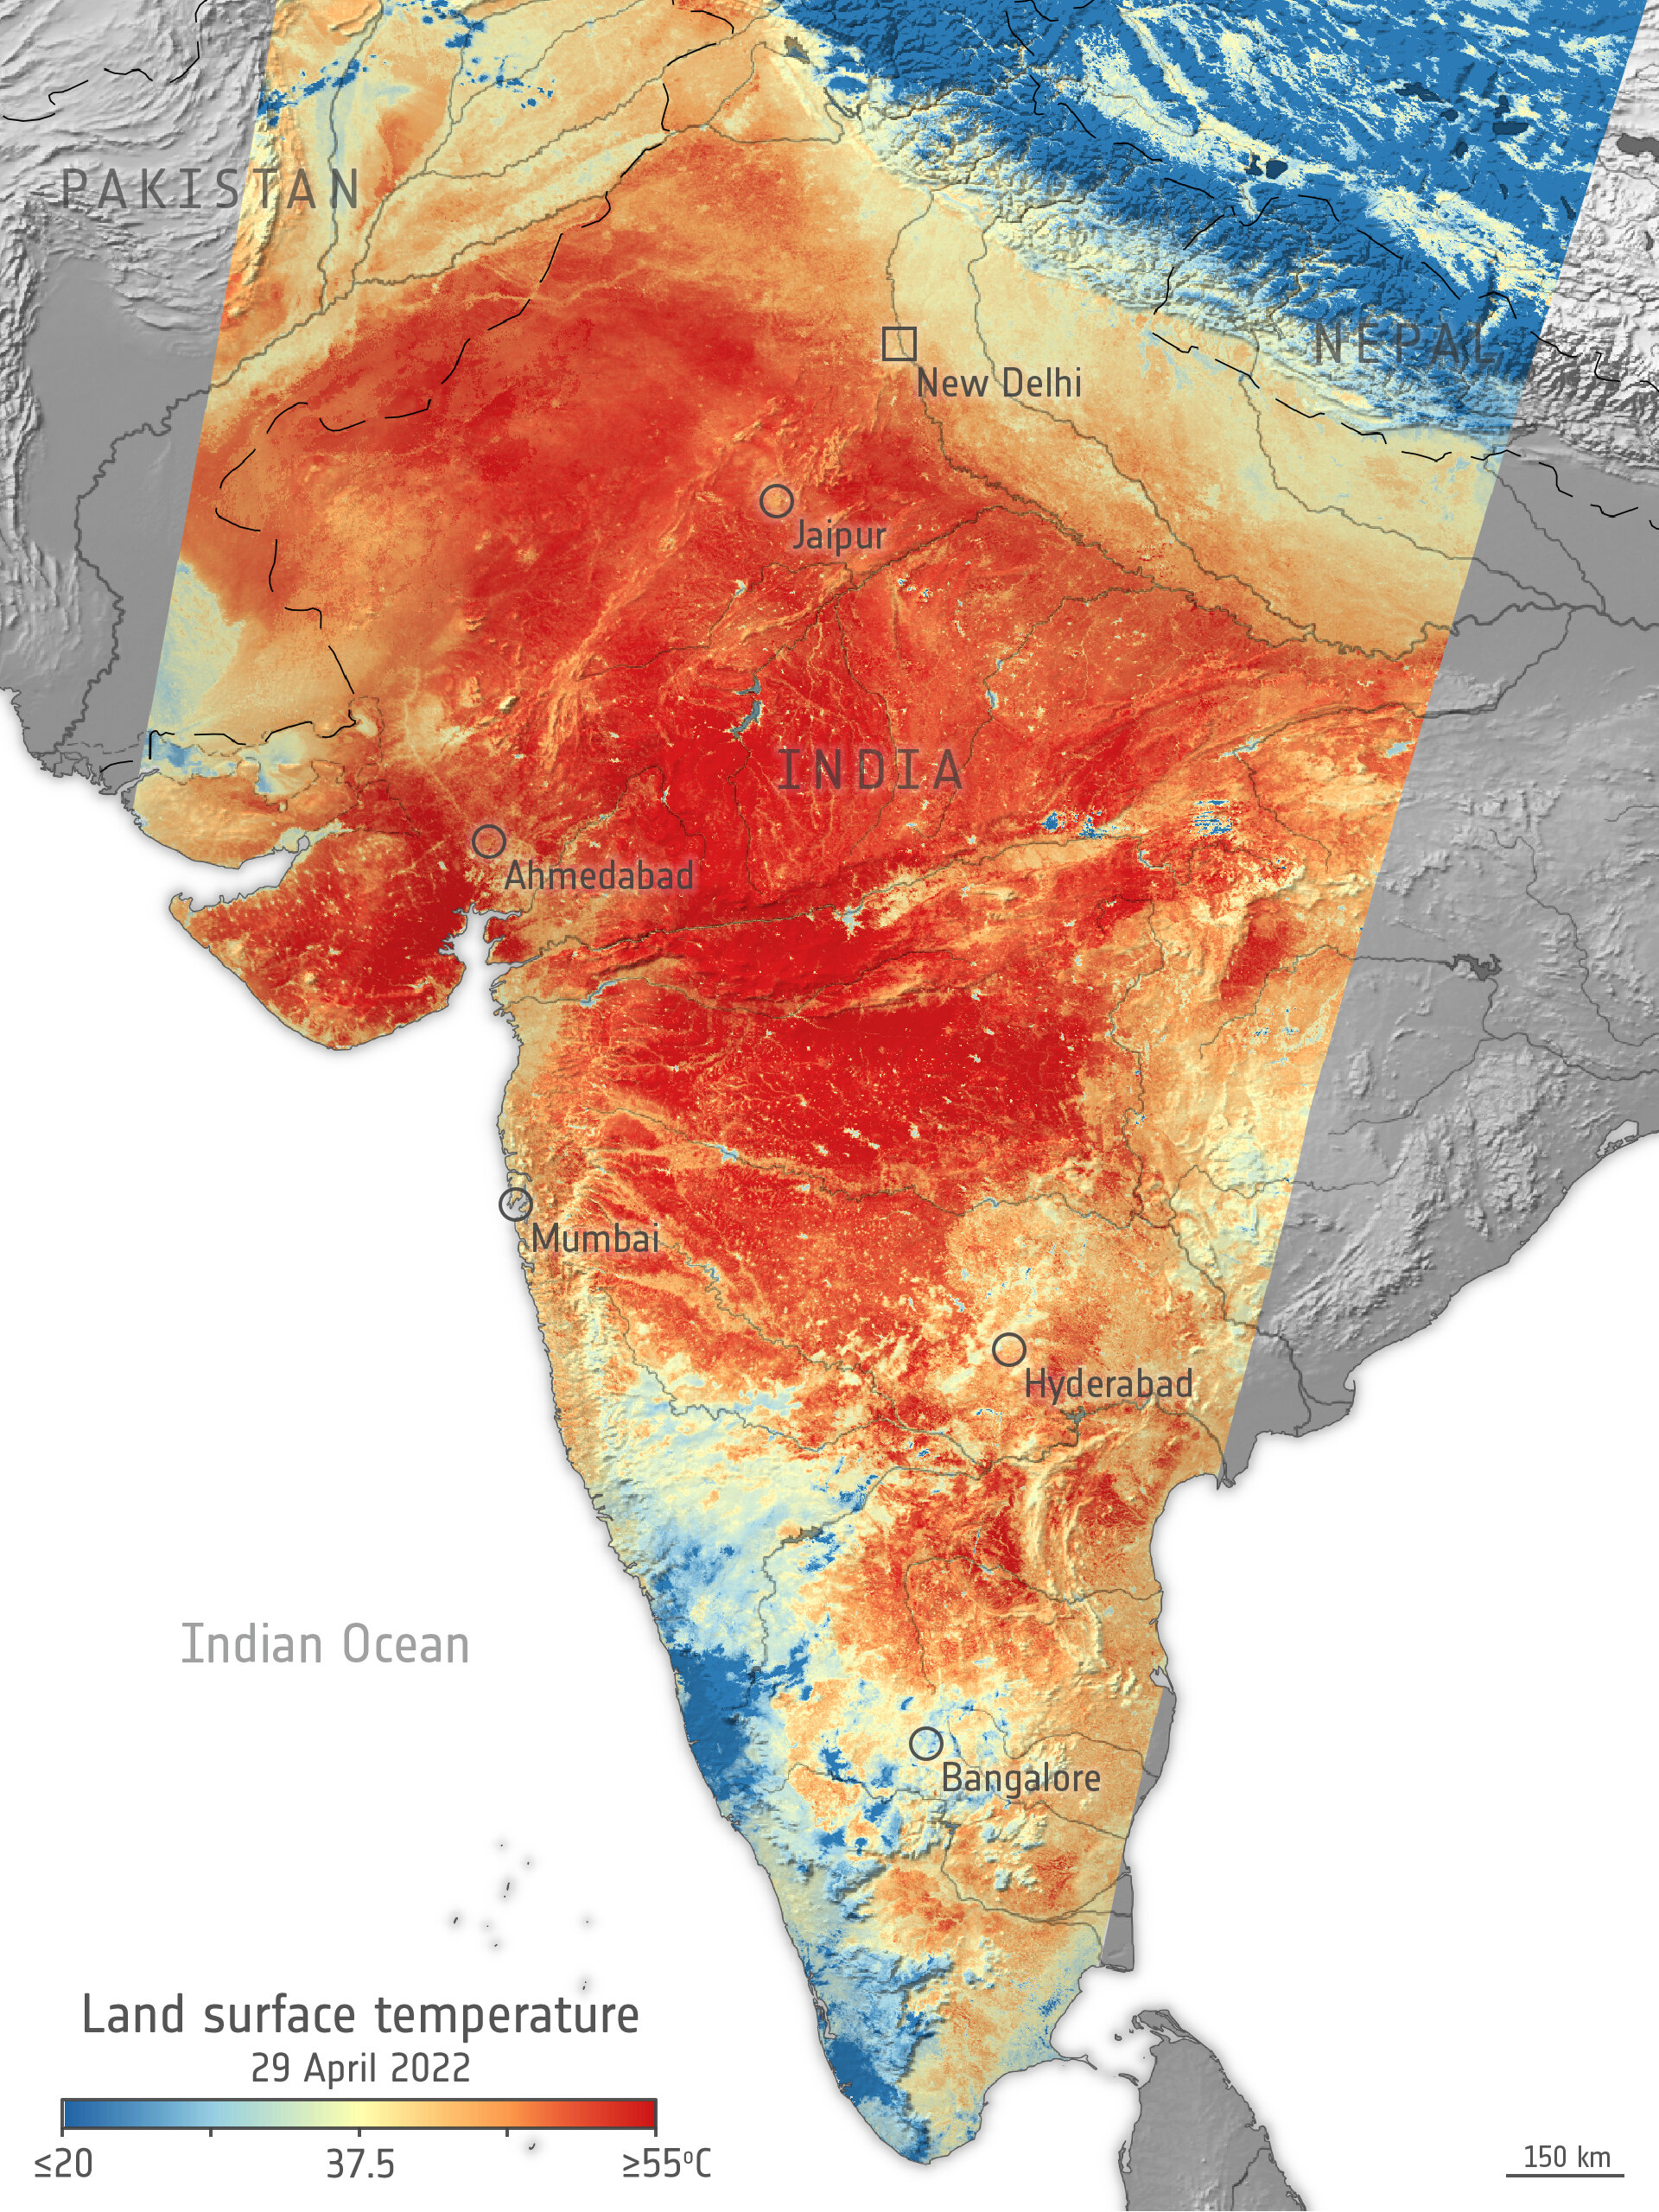
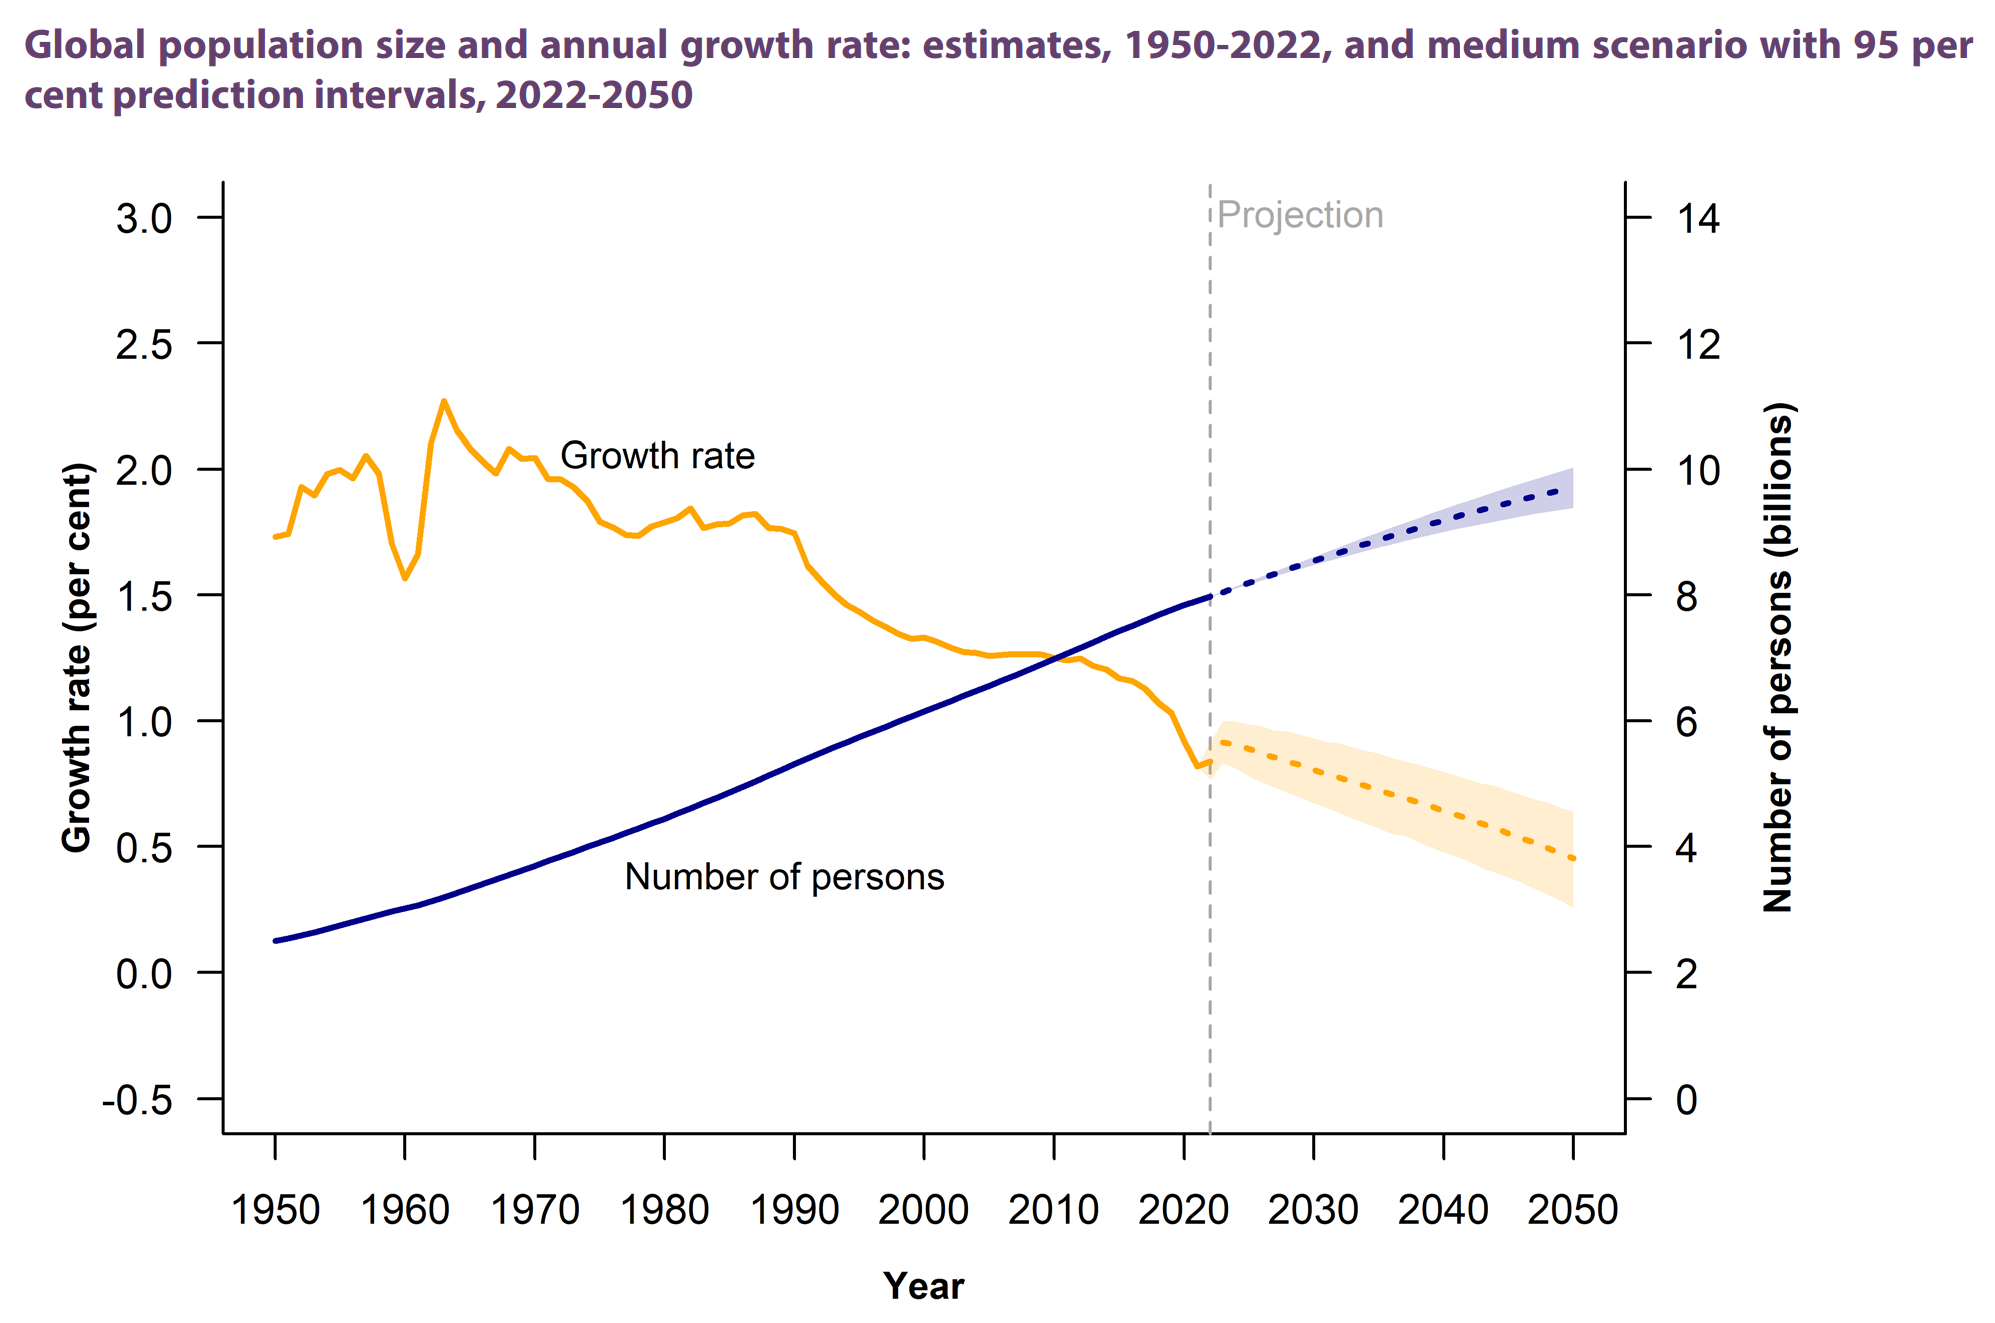
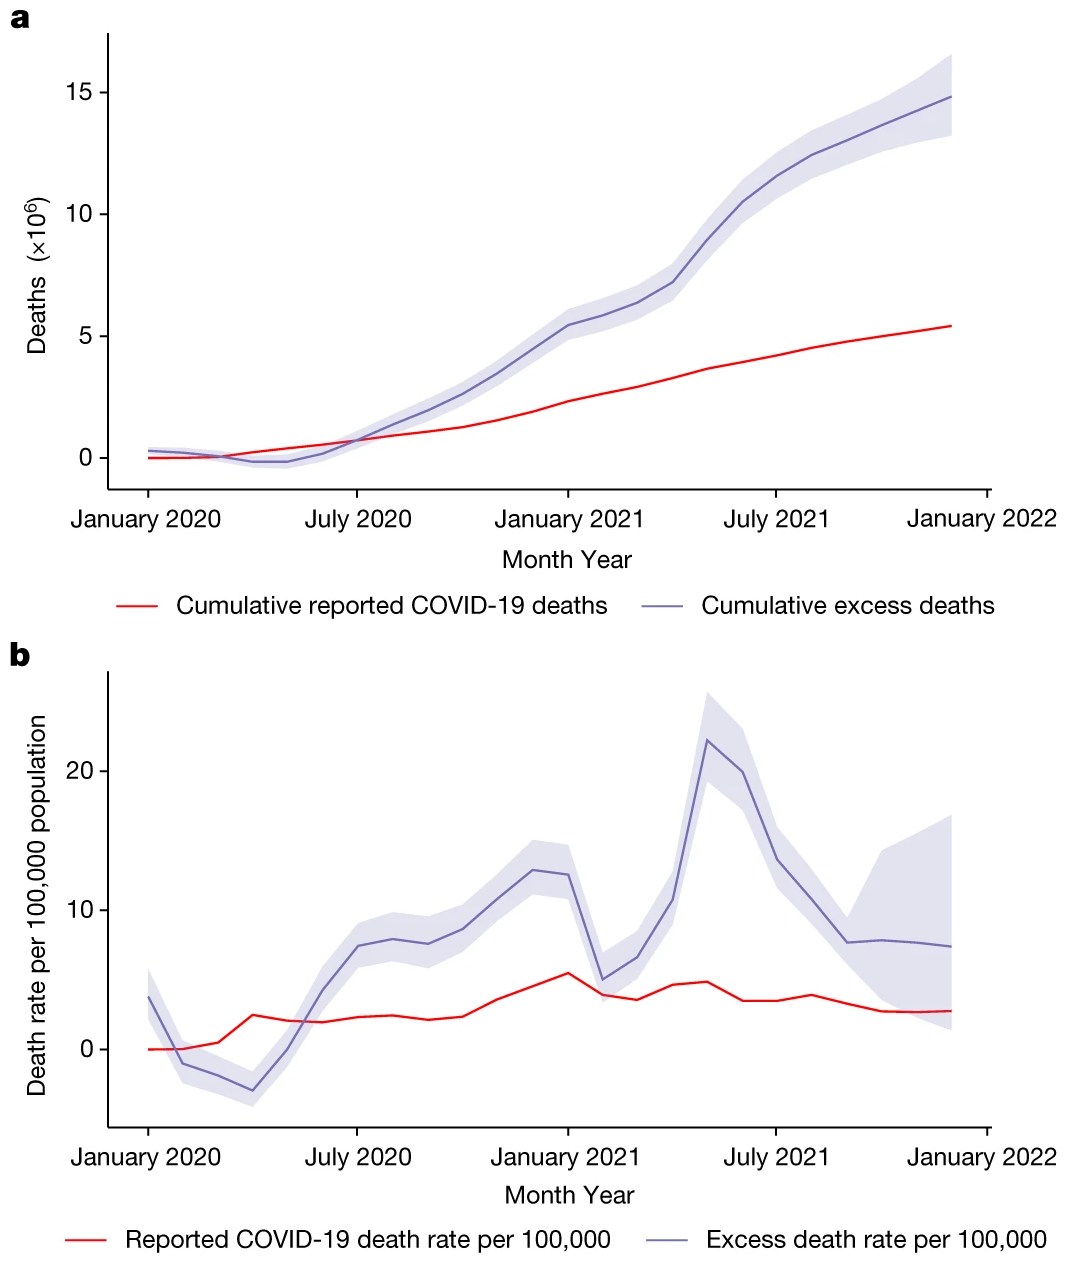
Globally, estimates of Covid deaths from the start of the pandemic through 2022 ranged between 5.4 million and 6.7 million, but in December 2022, The World Health Organization reported that the actual worldwide death toll may be three times higher than official records, at nearly 15 million lives. Mortality in India alone may be as high as 6.5 million dead.
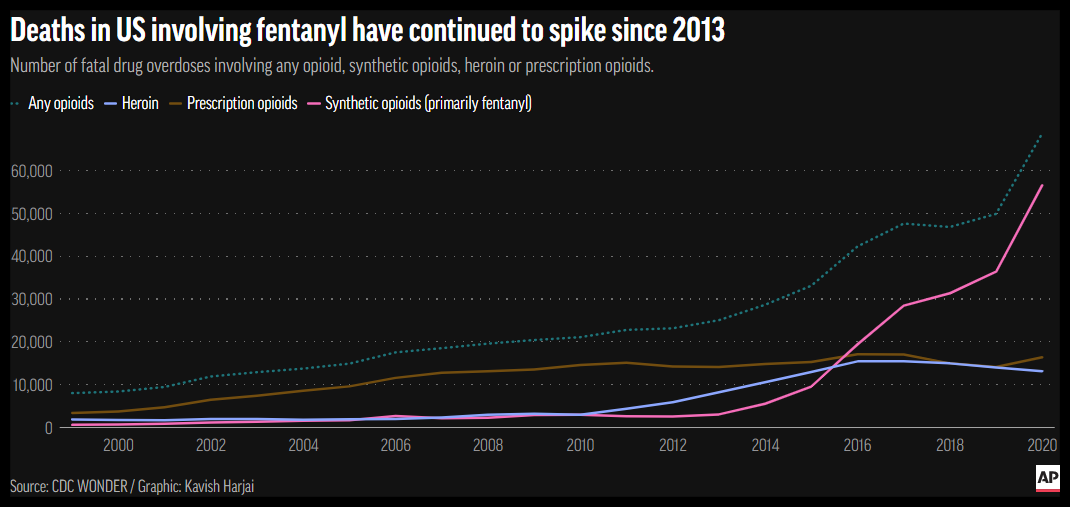
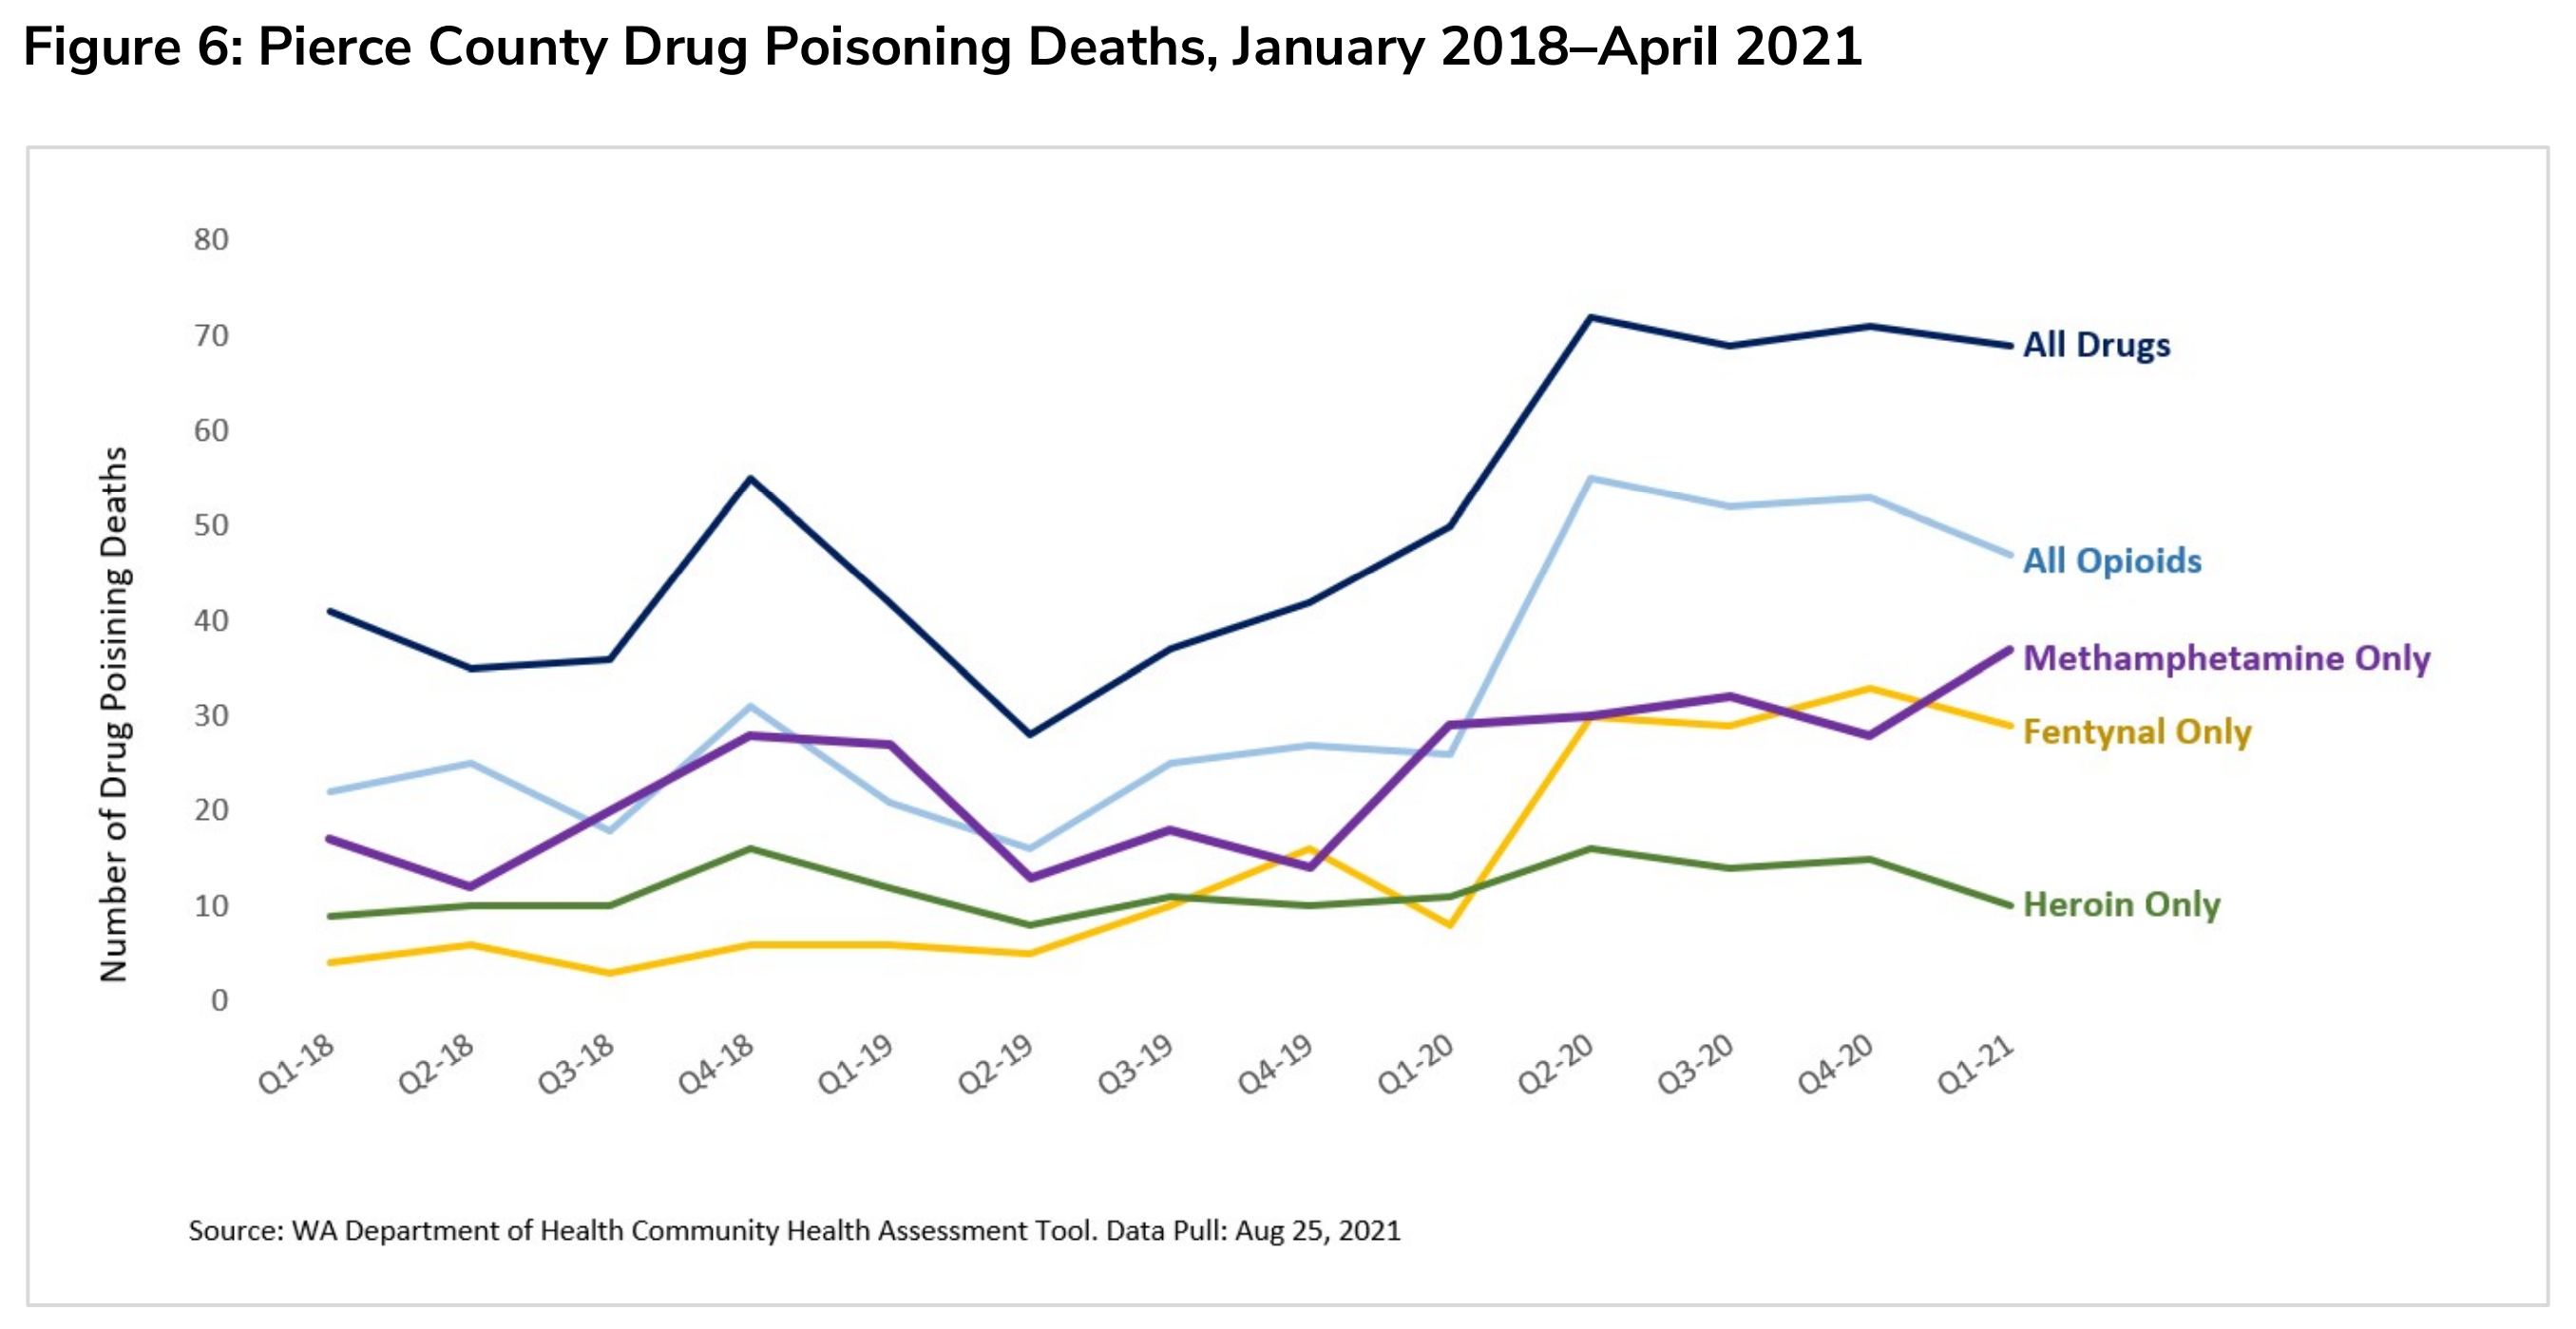
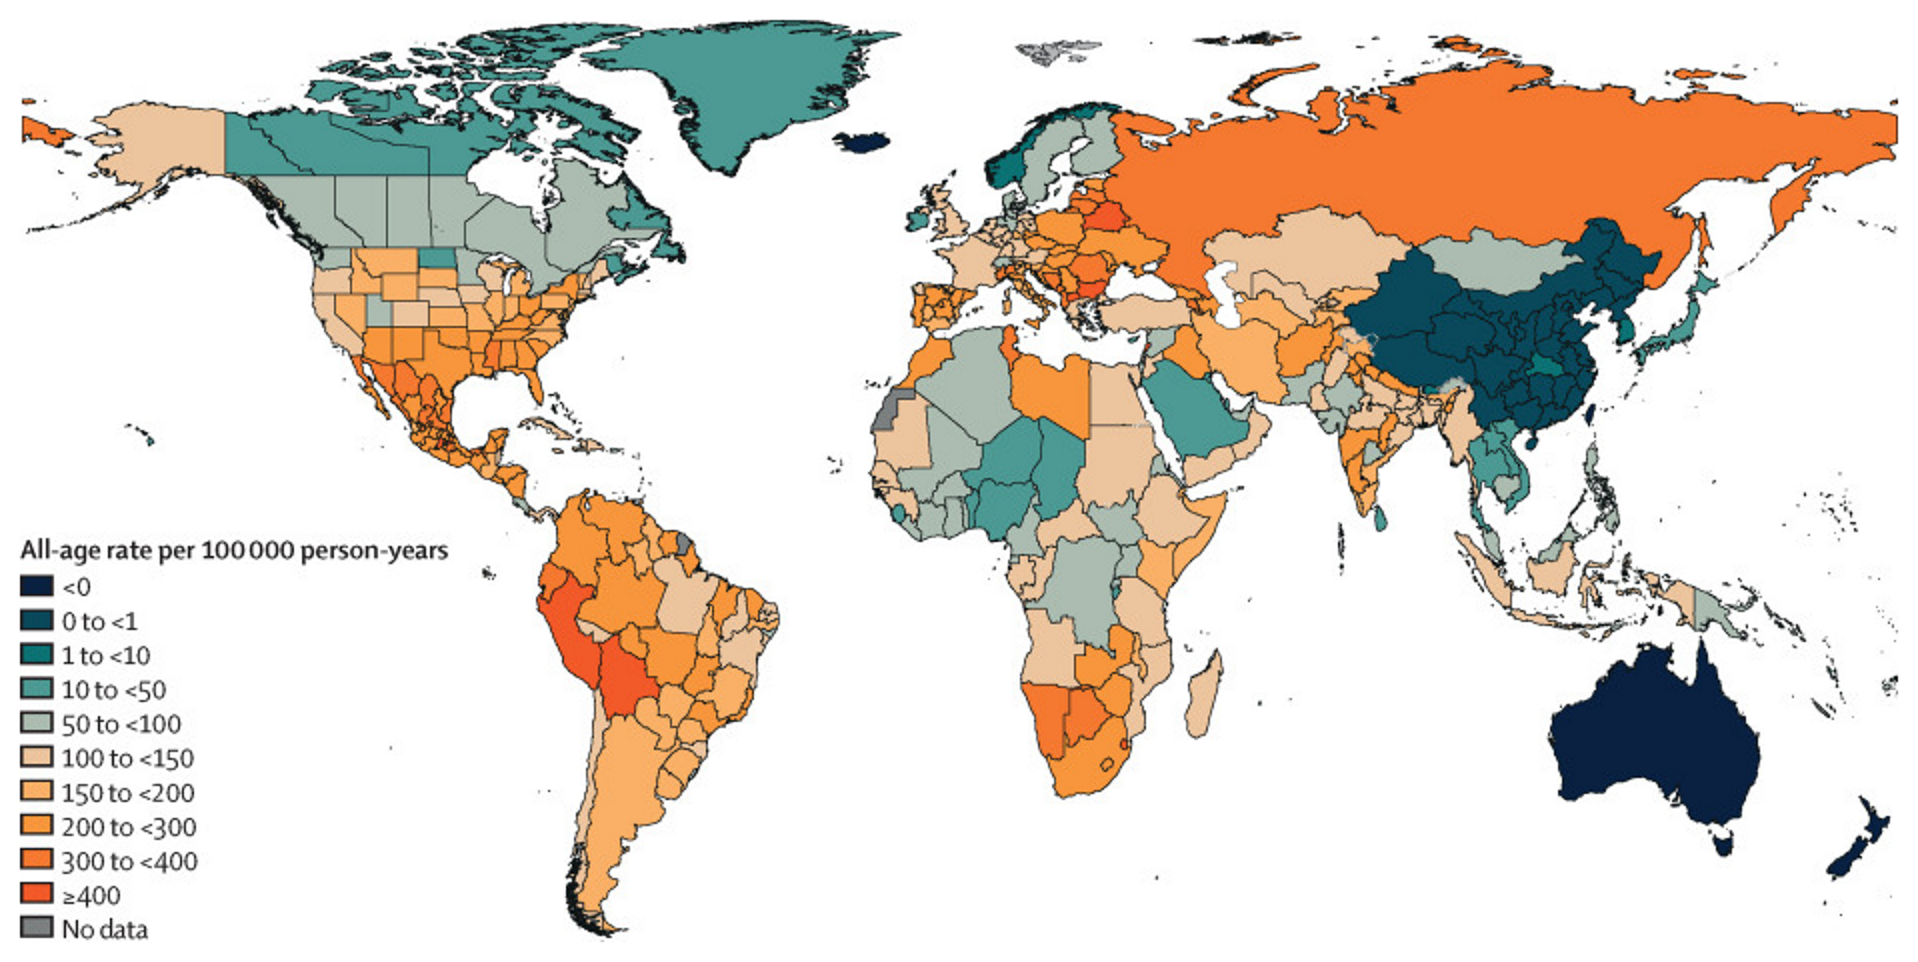
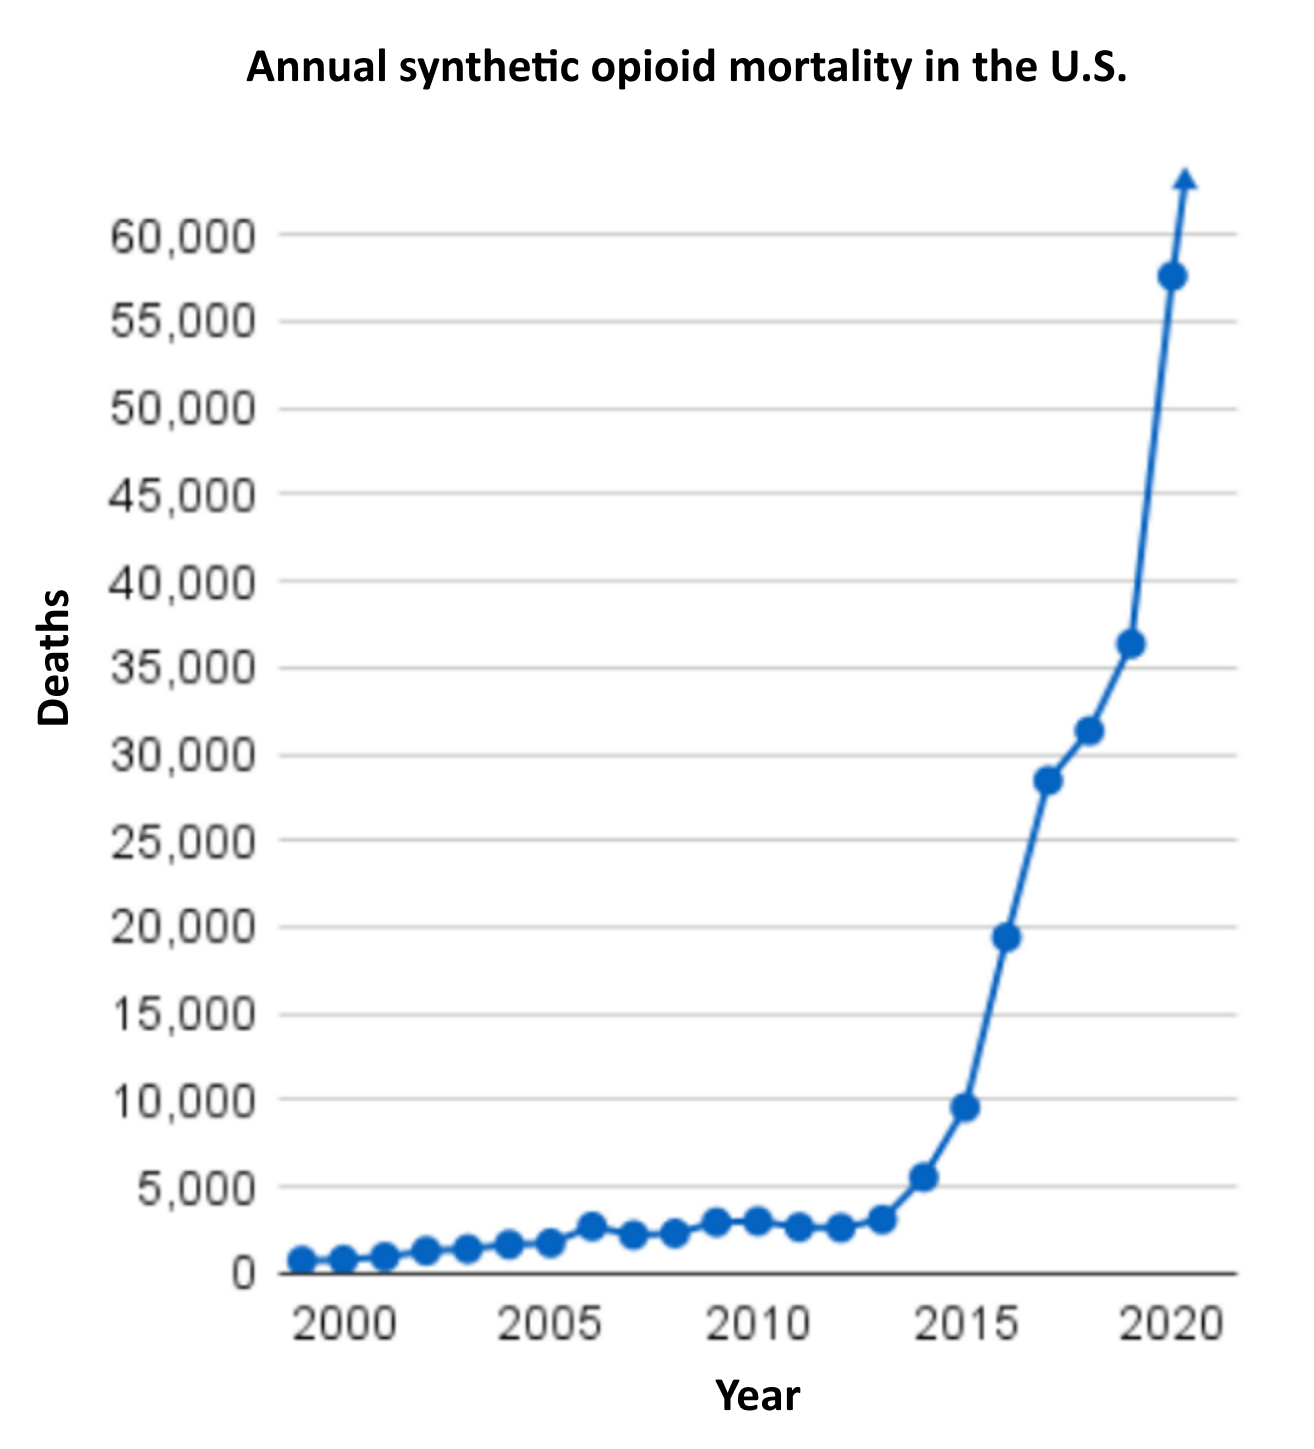
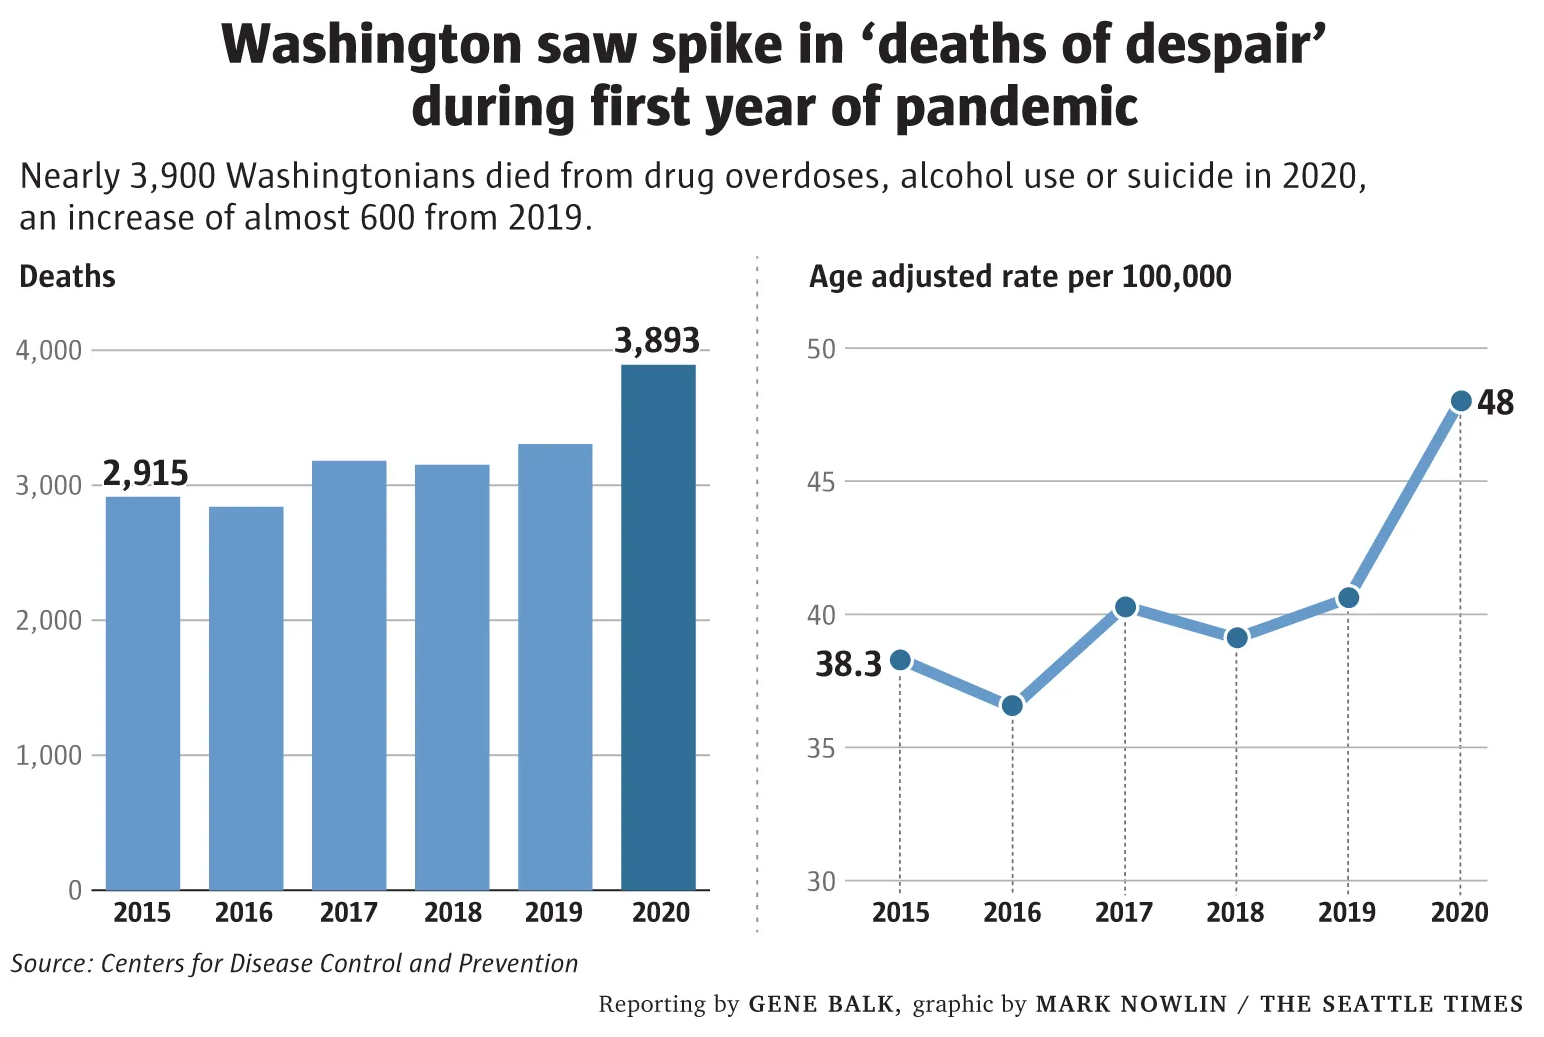
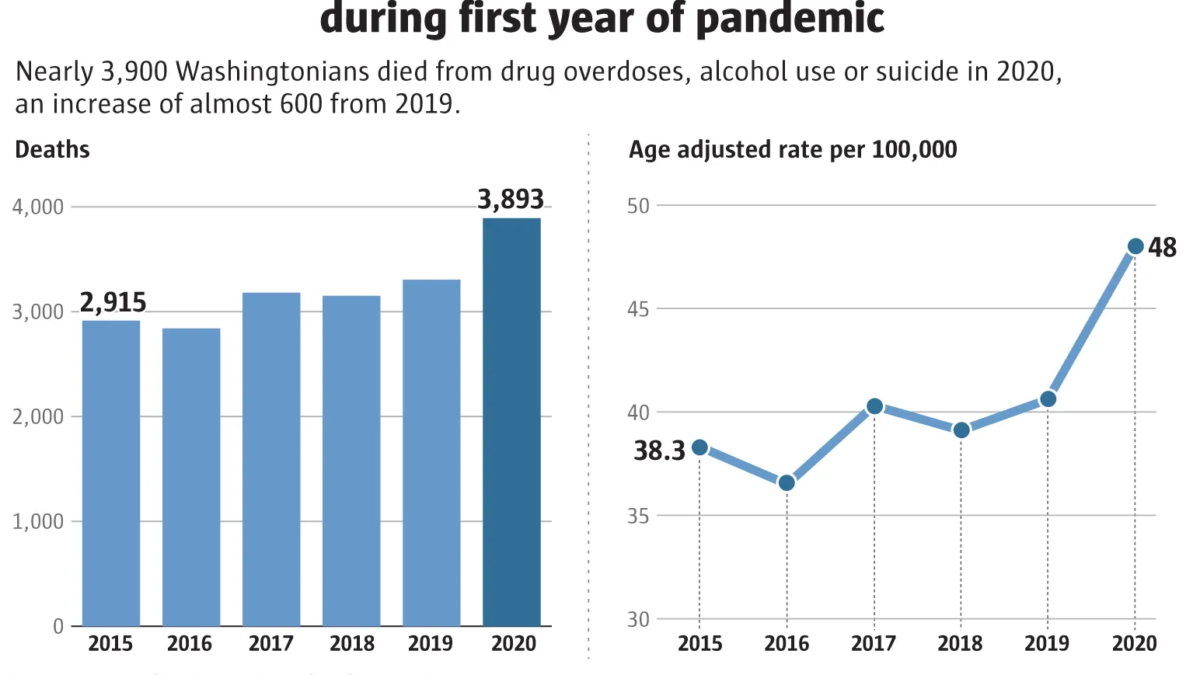
Opioid overdose mortality
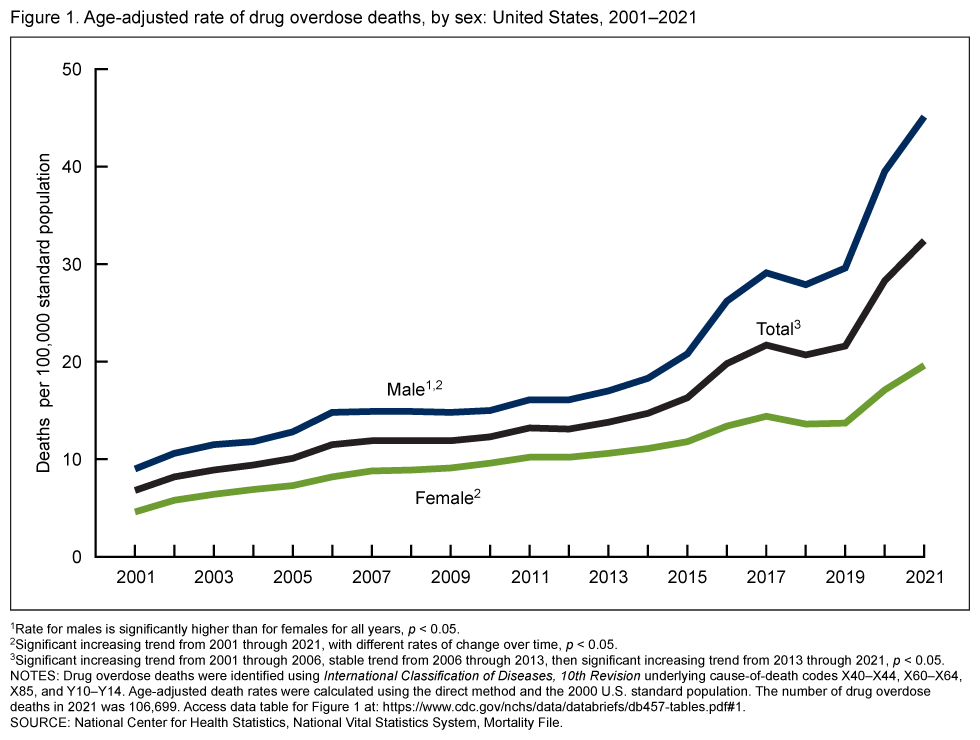
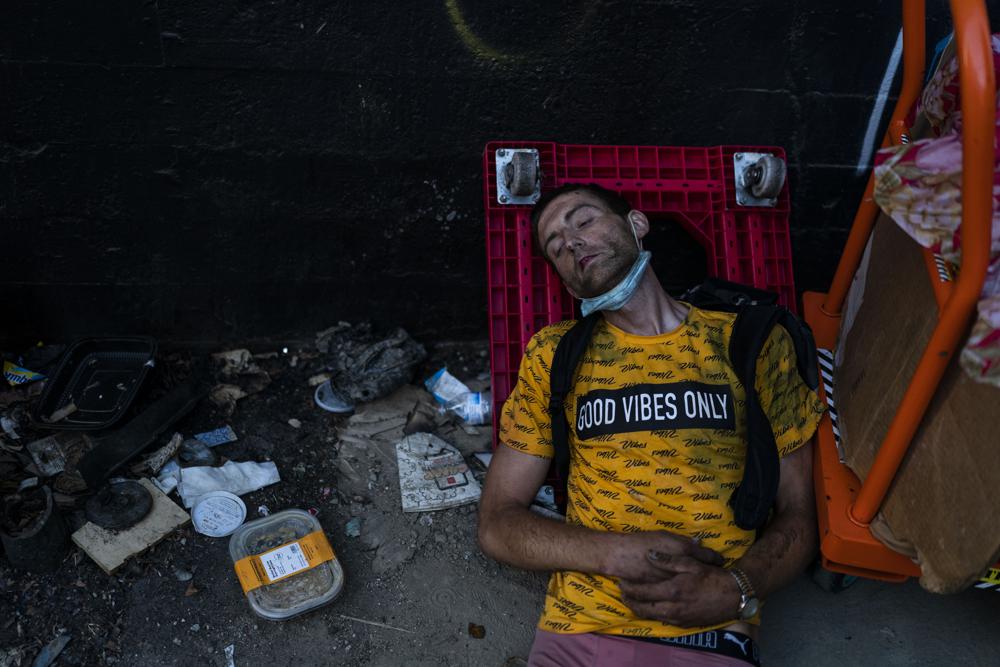
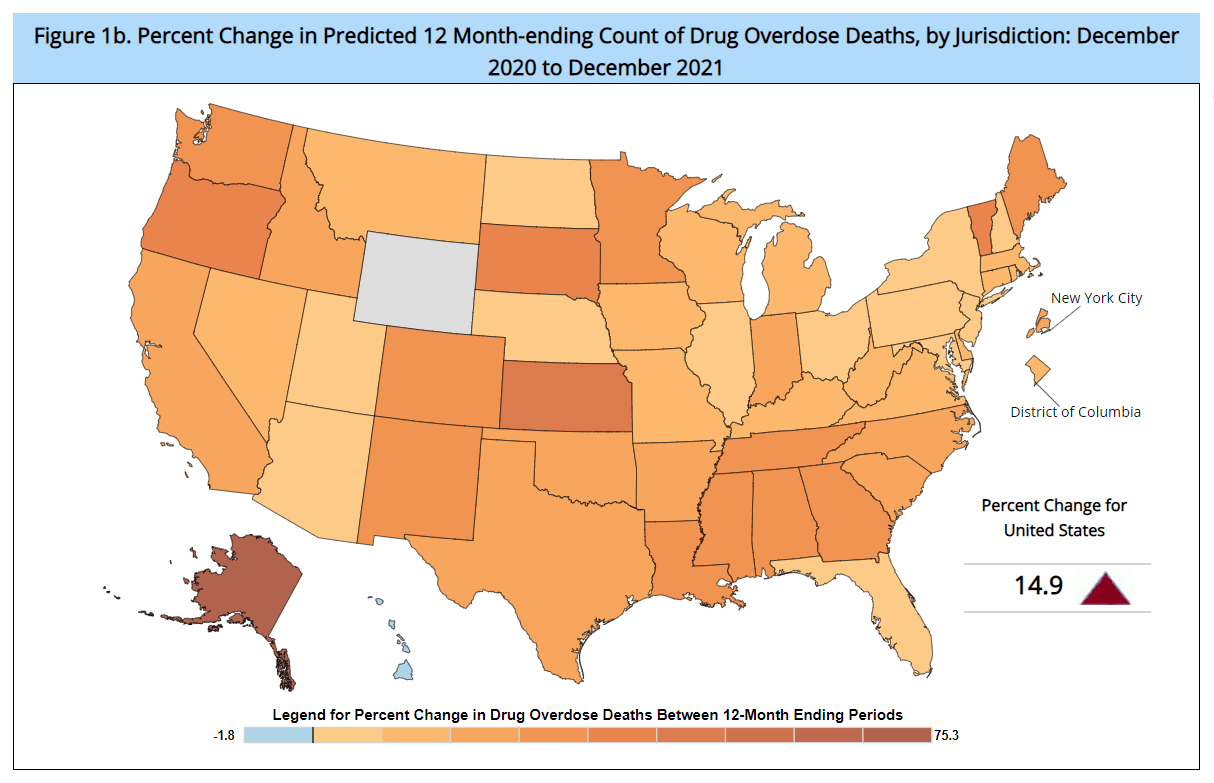
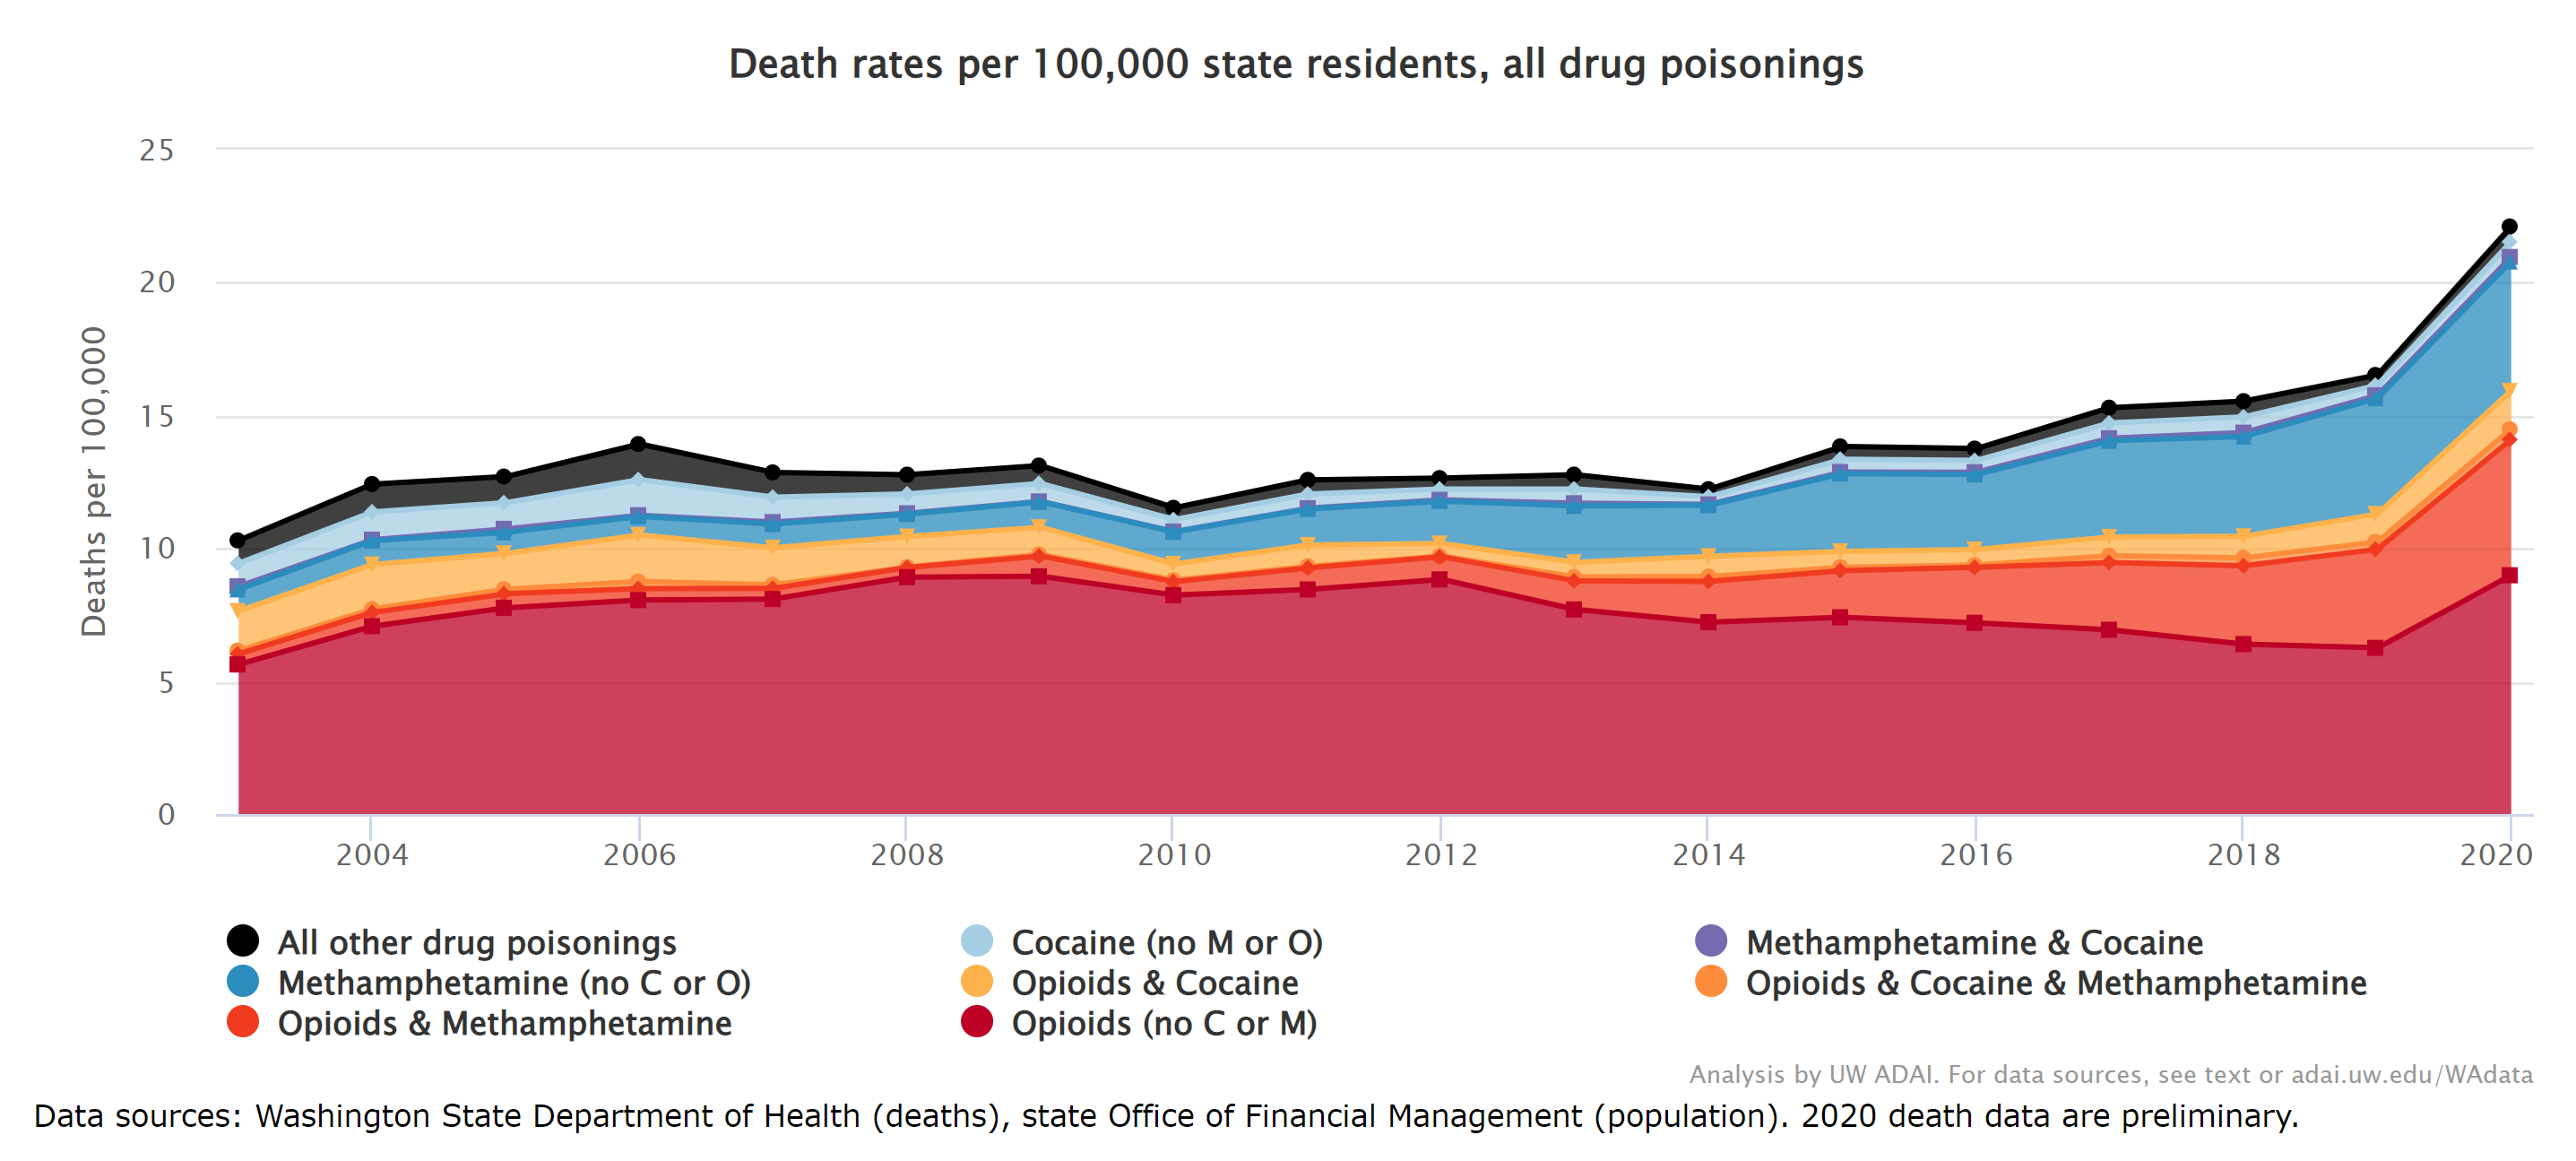
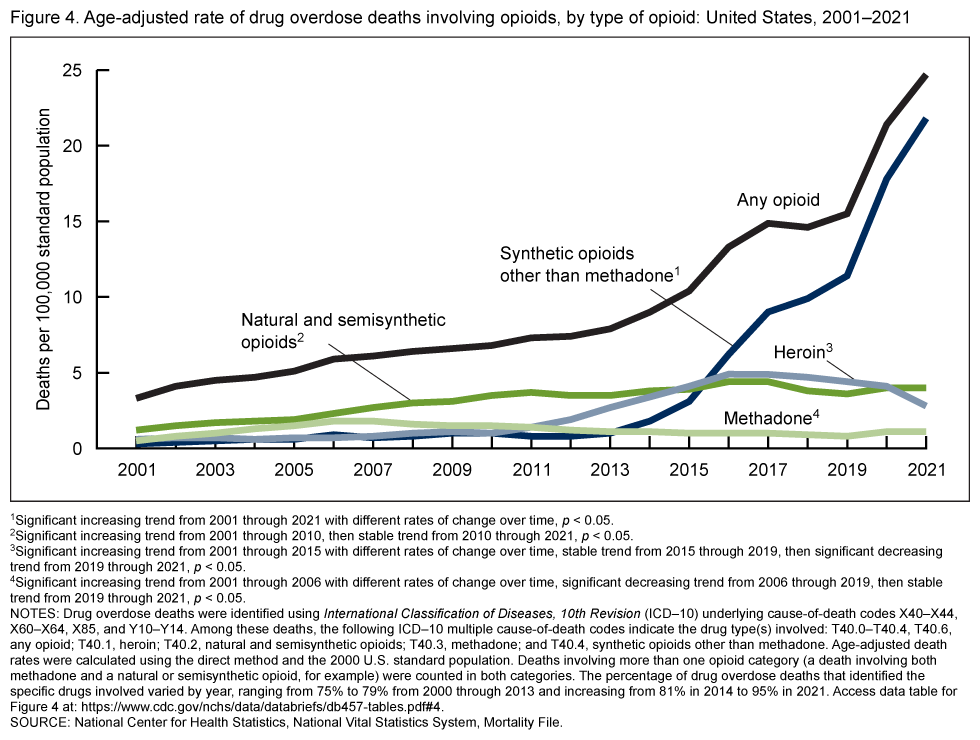
Also in May 2022, it was announced that another lethal epidemic in the United States – deaths of despair from opioid overdoses – exceeded a record 100,000 in 2021.
The lyrics of “Morning in America“, the 2019 track by Durand Jones & the Indications, were more relevant two years after it was released:
A junkie waits in Jacksonville
Prescription for the pain
As what the doctor ordered
Comes screaming through the vein
By the end of 2022, the CDC concluded that the 2021 death toll from drug overdoses had exceeded 106,000 people. There is every reason to expect that 2022 numbers will break this sad record, and Desdemona almost certainly will feature data showing record opioid mortality in next year’s Doomiest Graphs collection.
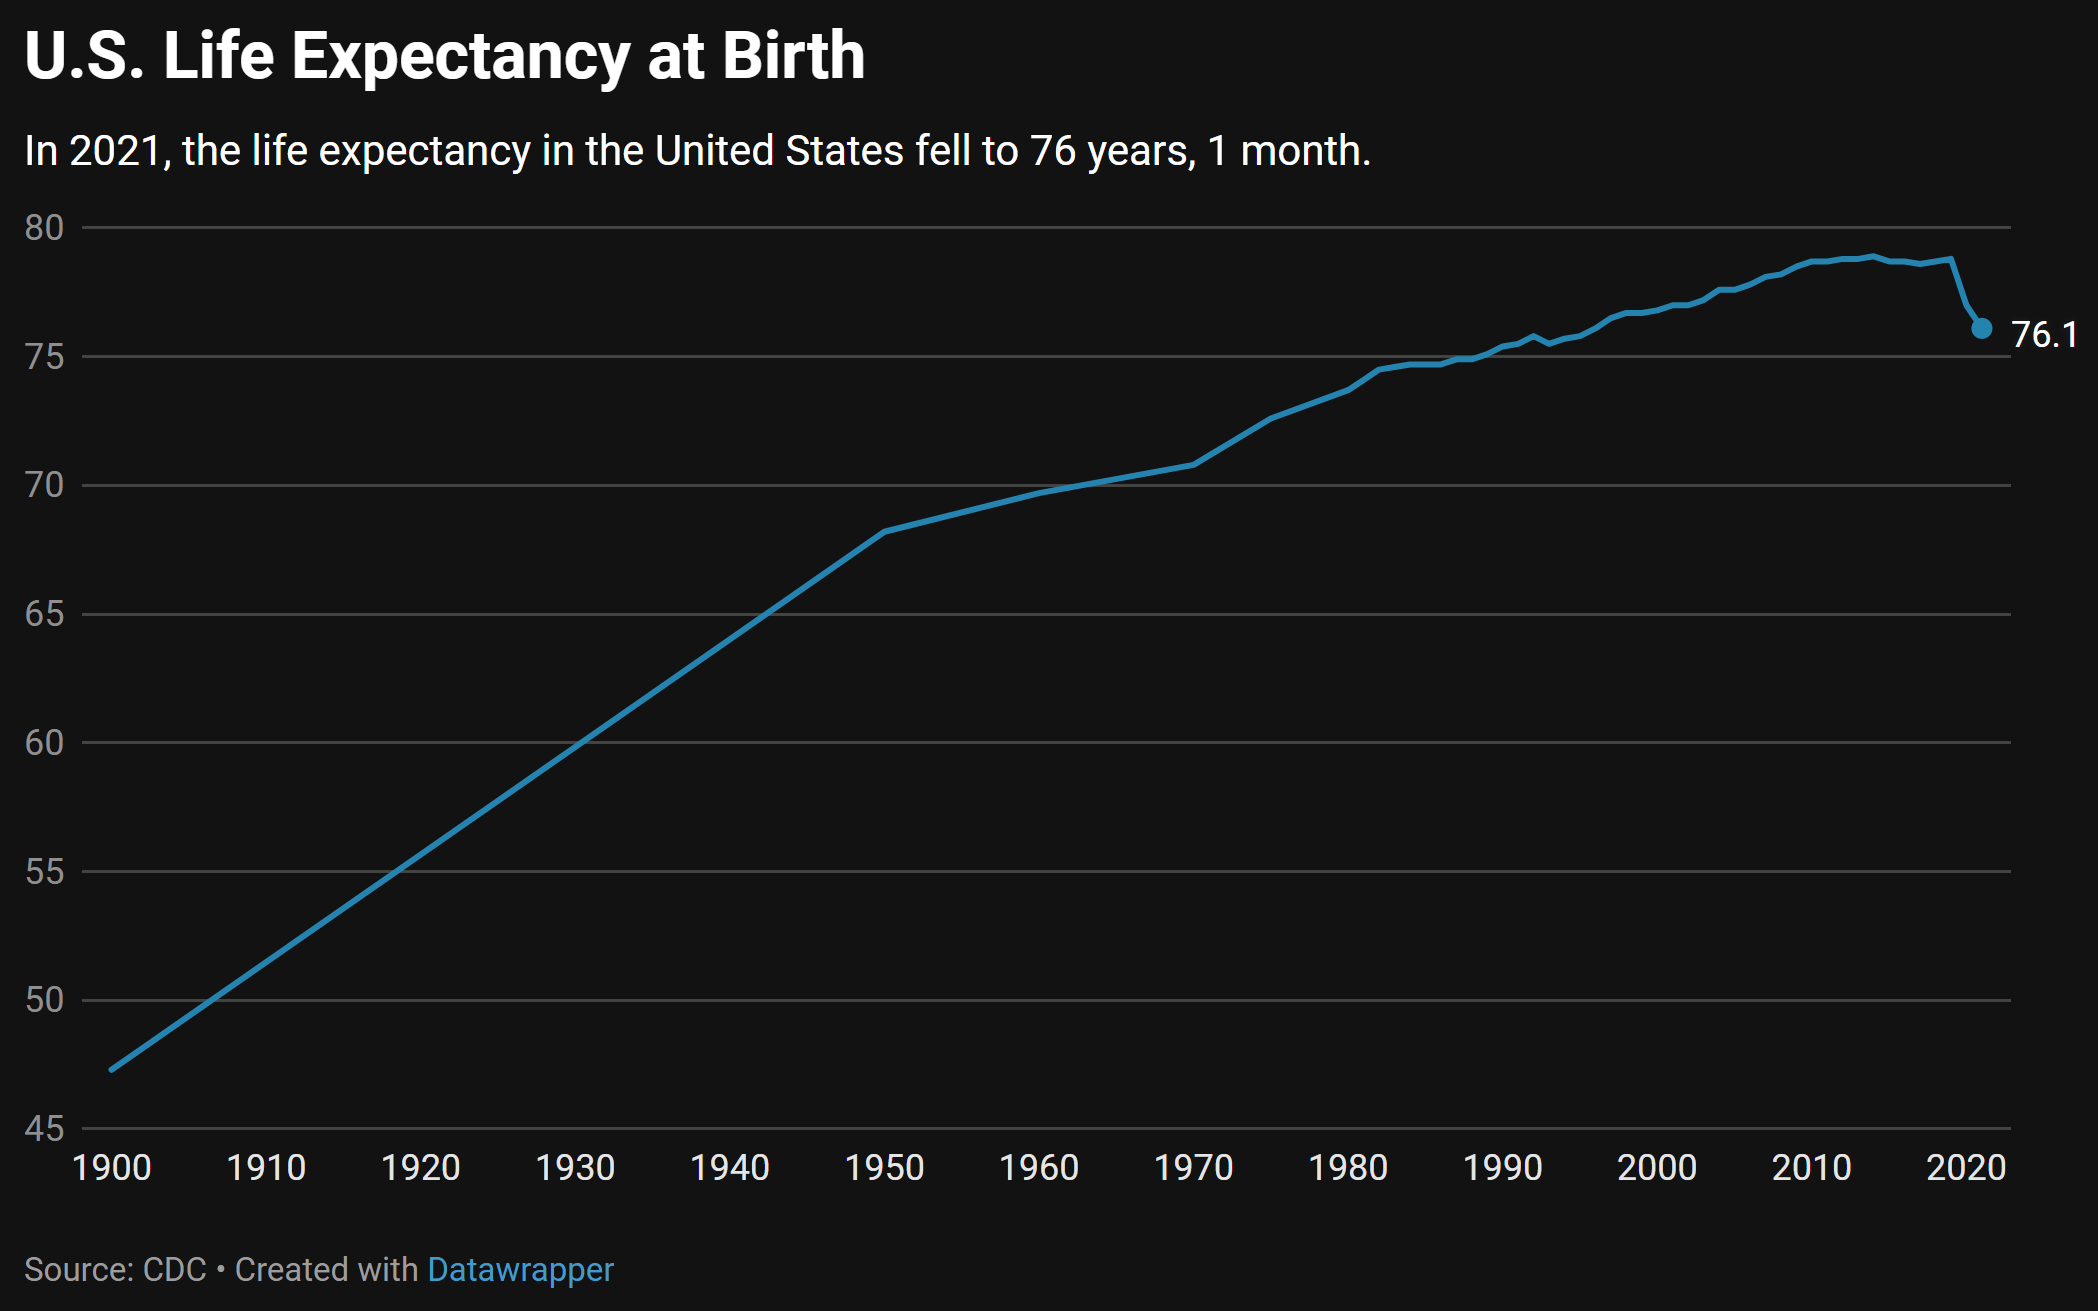
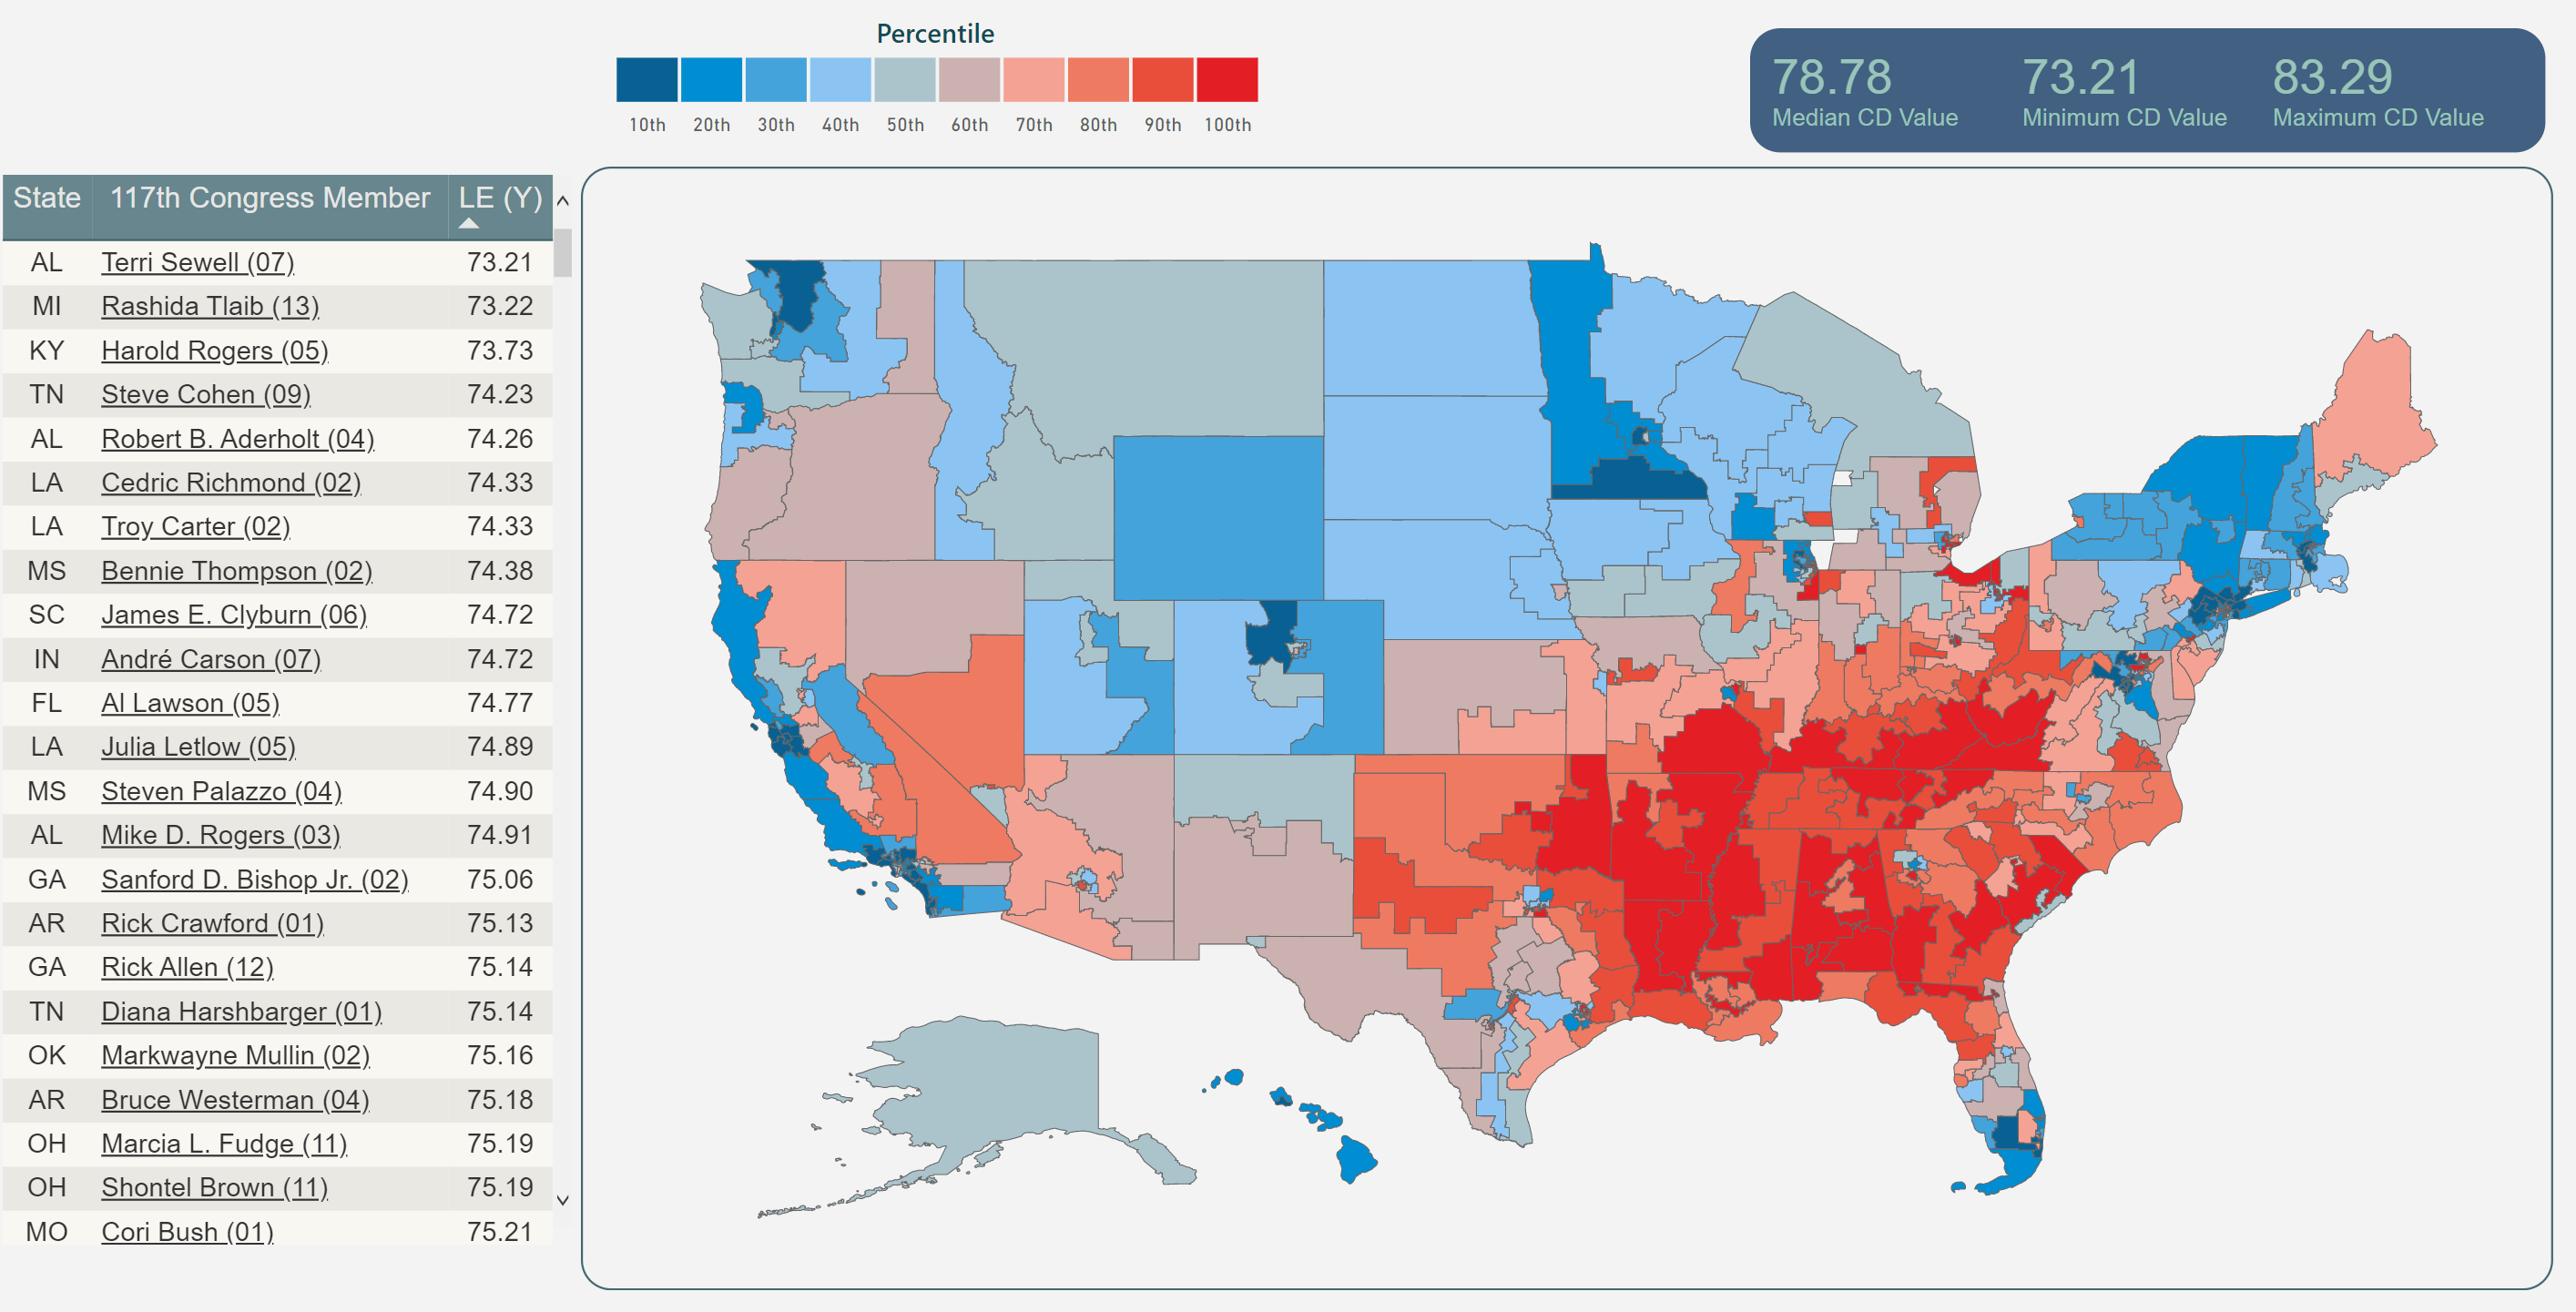
Life expectancy
To nobody’s surprise, U.S. life expectancy dropped for the second consecutive year in 2021. In the first two years of the Covid pandemic, the estimated American lifespan shortened by nearly three years. The last comparable decrease happened in the early 1940s, during the height of World War II.
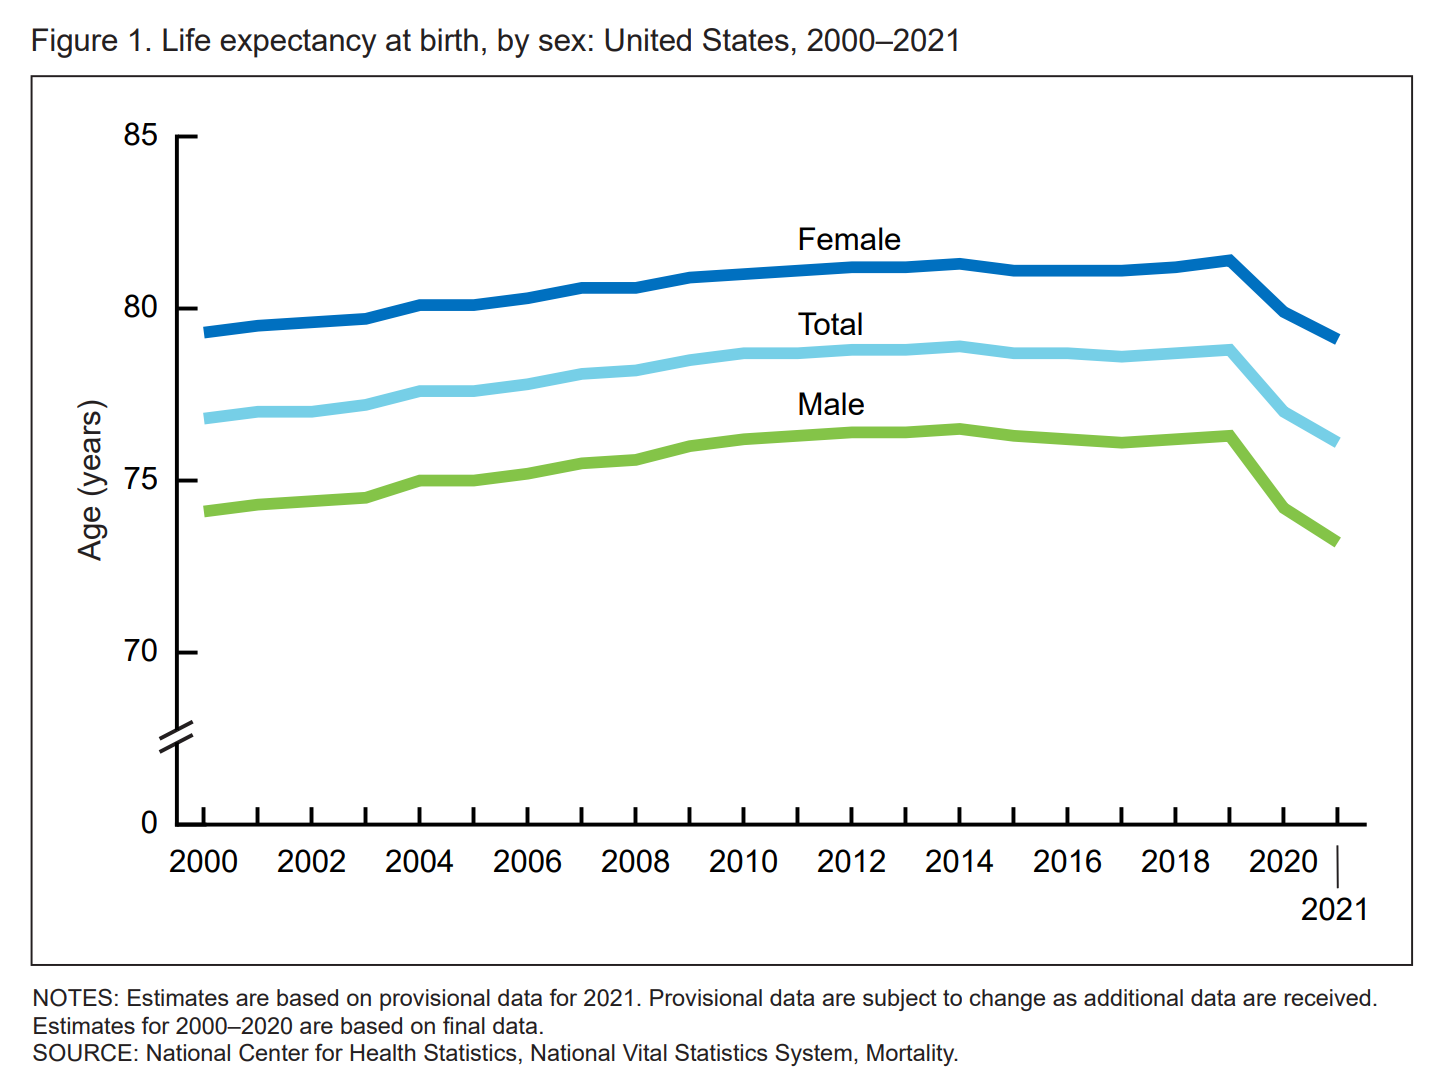
CDC officials blamed COVID-19 for about half of the decline in 2021, when new coronavirus variants caused waves of hospitalizations and deaths. Other contributors to the decline were the usual American problems: drug overdoses, heart disease, suicide, and chronic liver disease. In other words, despair.
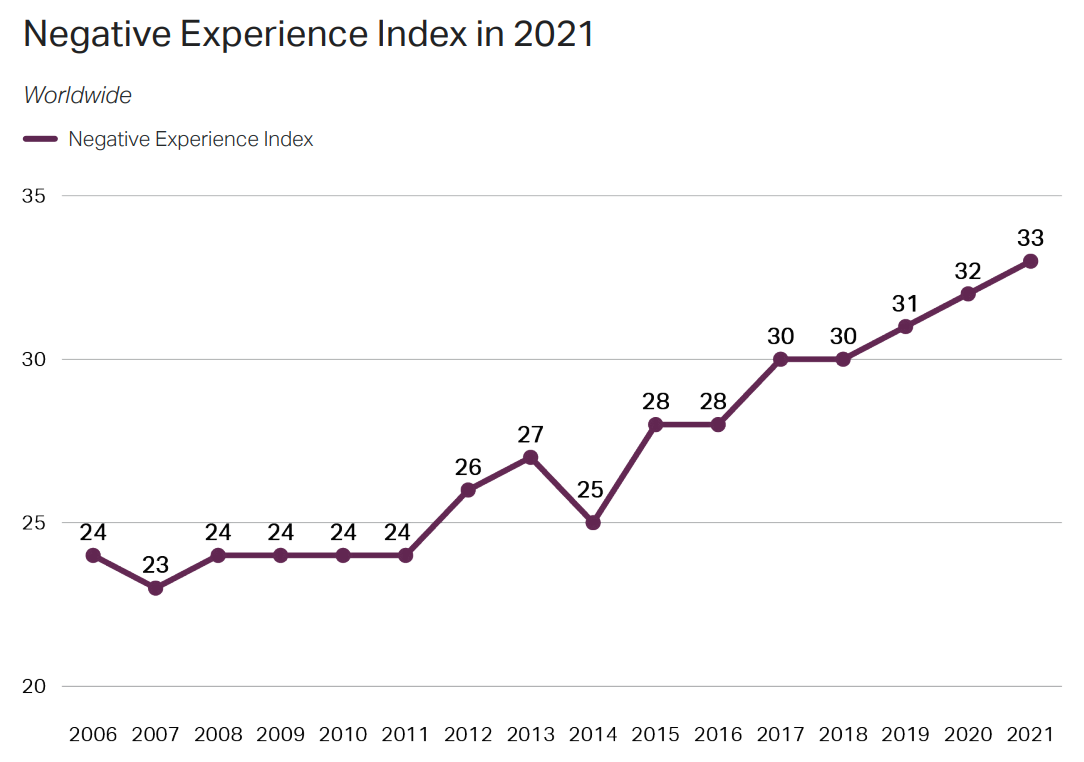
Global human development decline
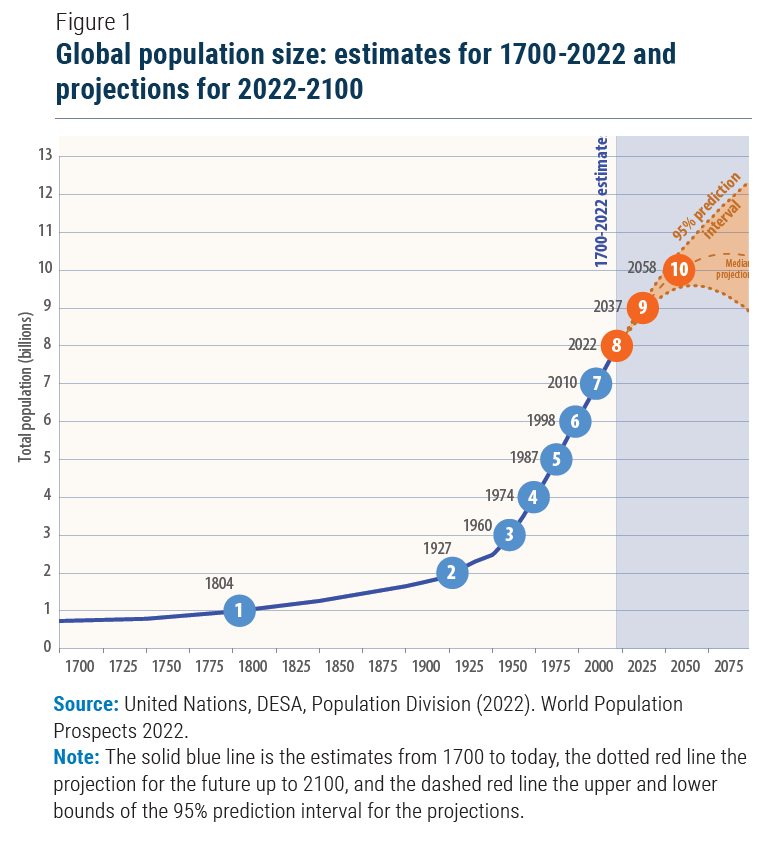
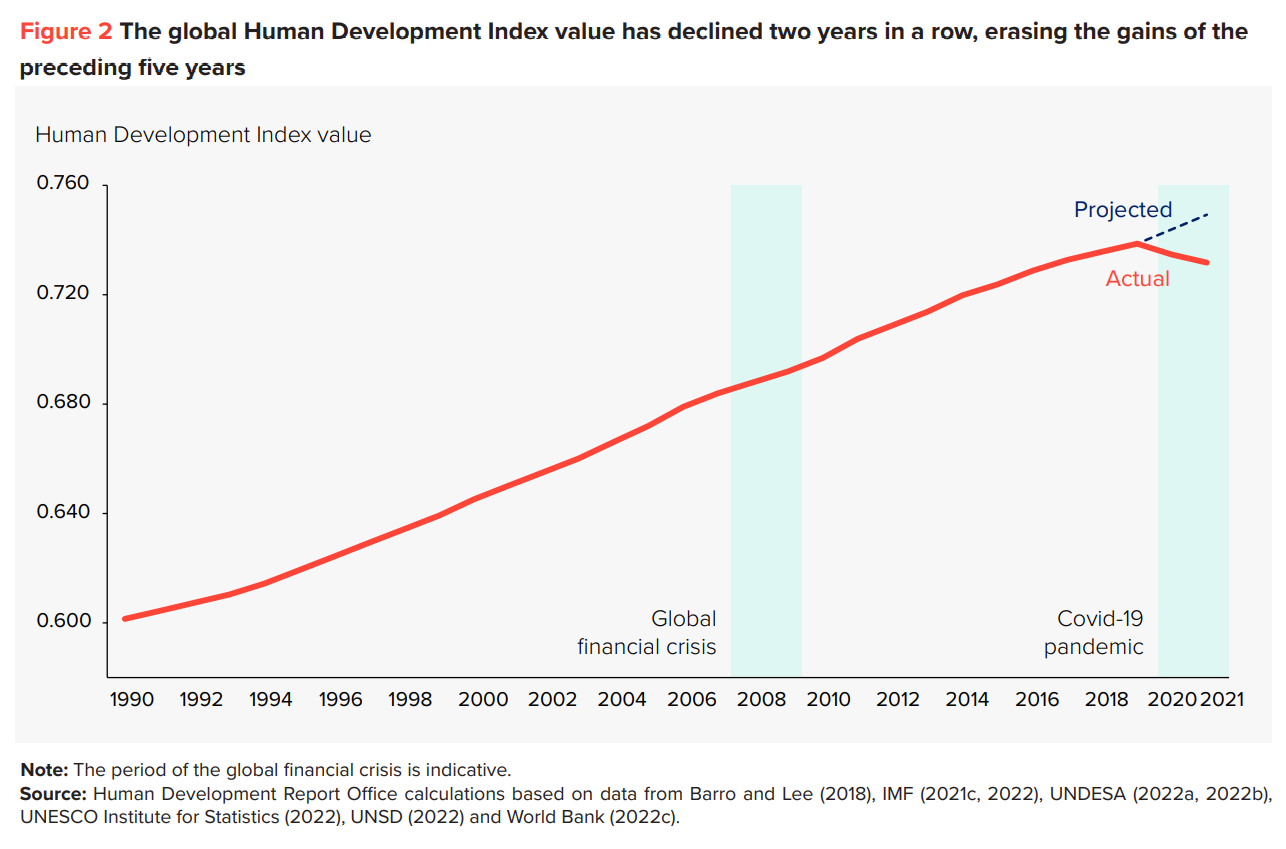
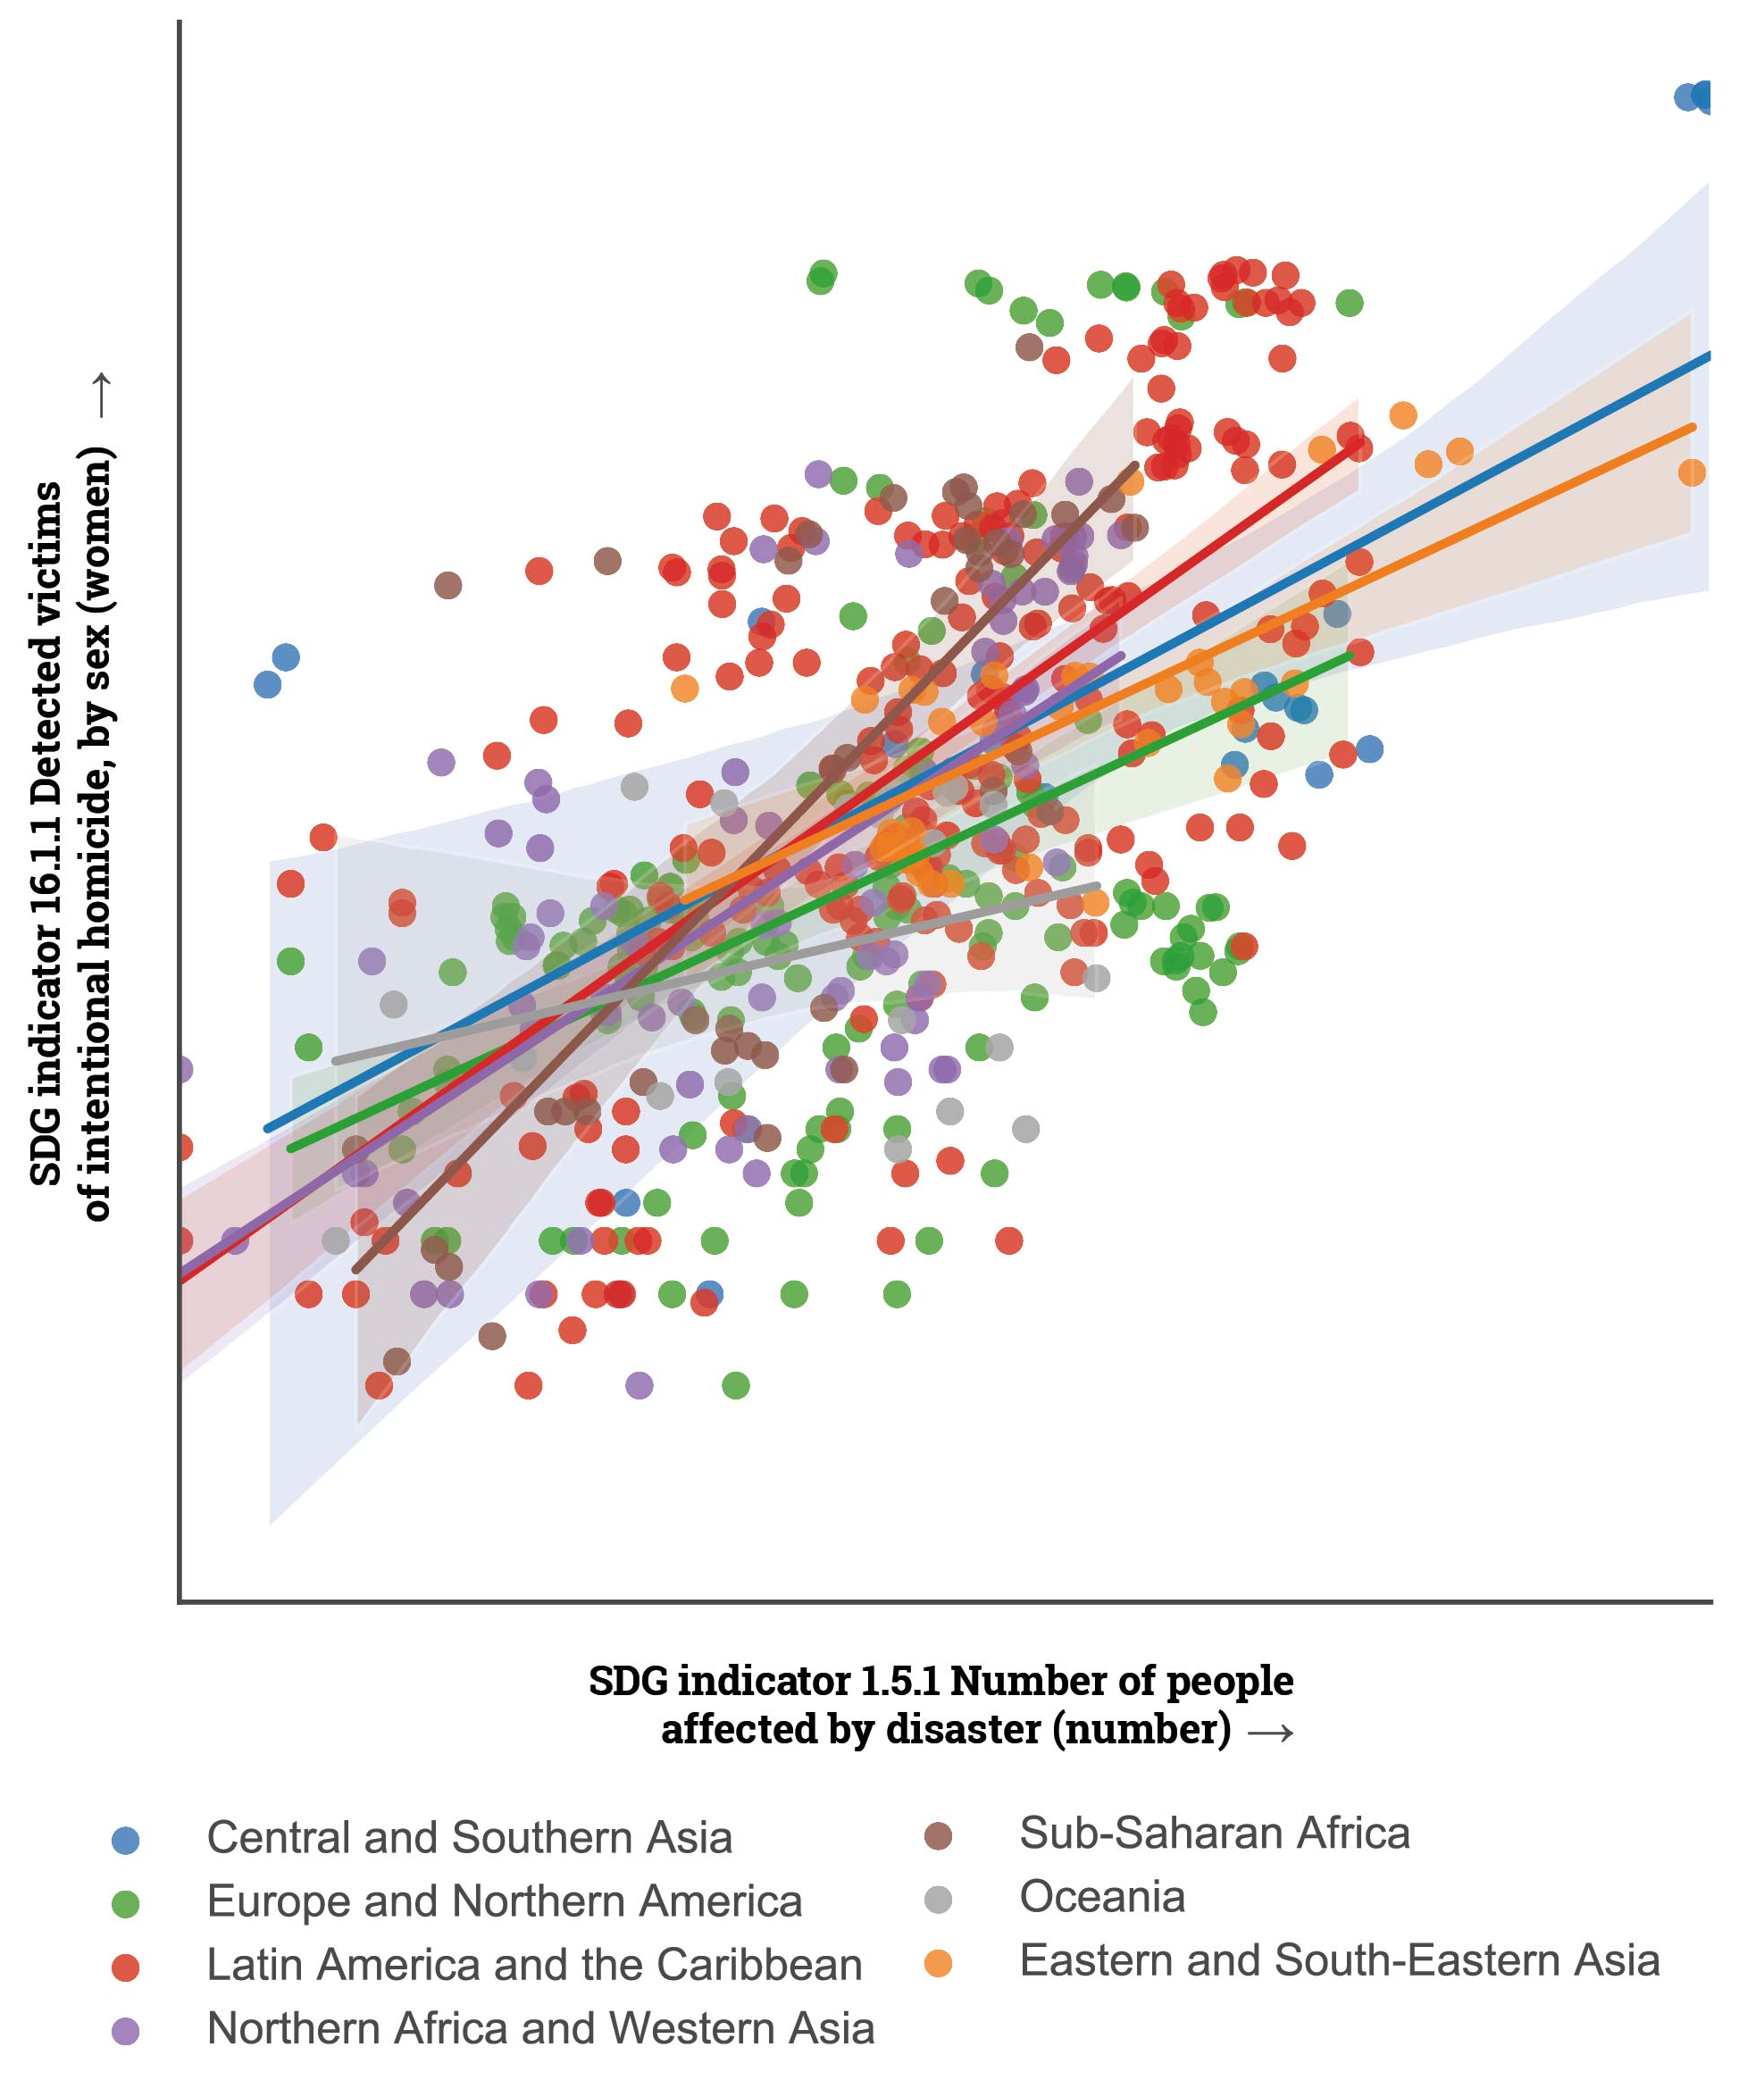
It wasn’t only the U.S. that saw breakpoints in curves that once were thought to be ever-brightening. Globally, the Human Development Index (HDI), which measures a nation’s health, education, and standard of living, declined for two years in a row, erasing the gains of the preceding five years. For the first time in the 32 years that the UN Development Program has been calculating it, the HDI declined globally for two years in a row, falling back to its 2016 levels, reversing much progress toward the UN Sustainable Development Goals.
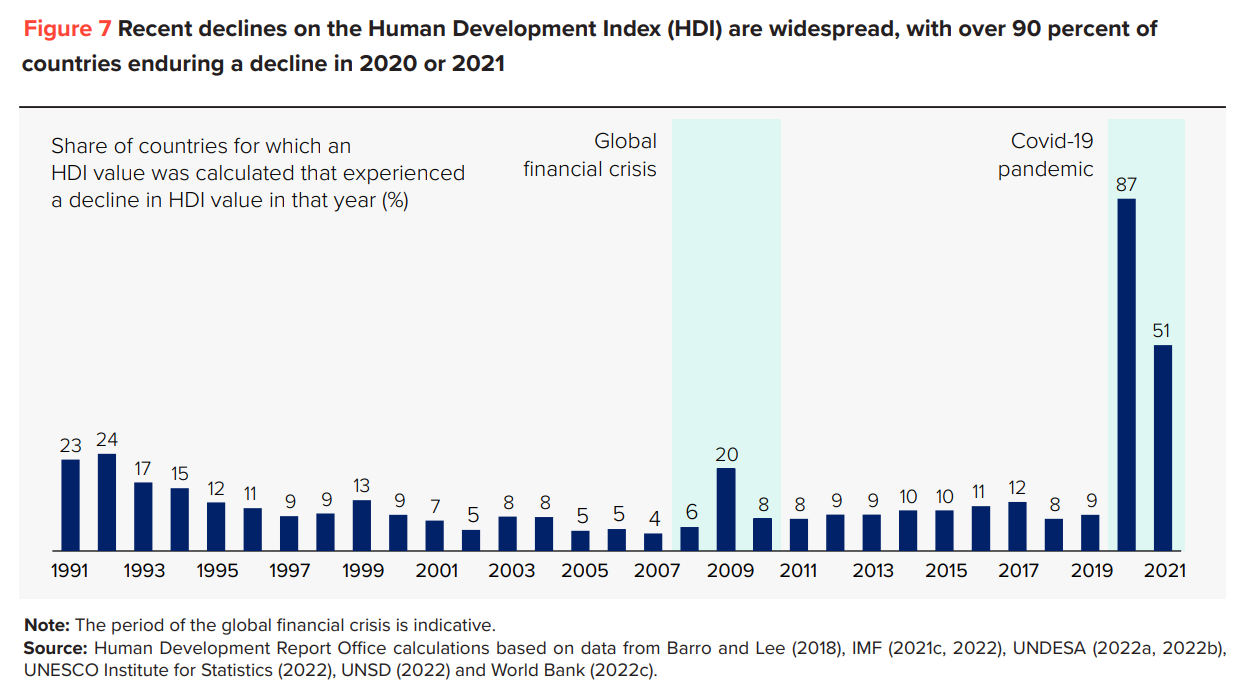
The reversal was global, with more than 90 percent of countries registering a decline in their HDI score in either 2020 or 2021 and more than 40 percent declining in both years, signaling that the crisis continued to deepen for many in 2022.
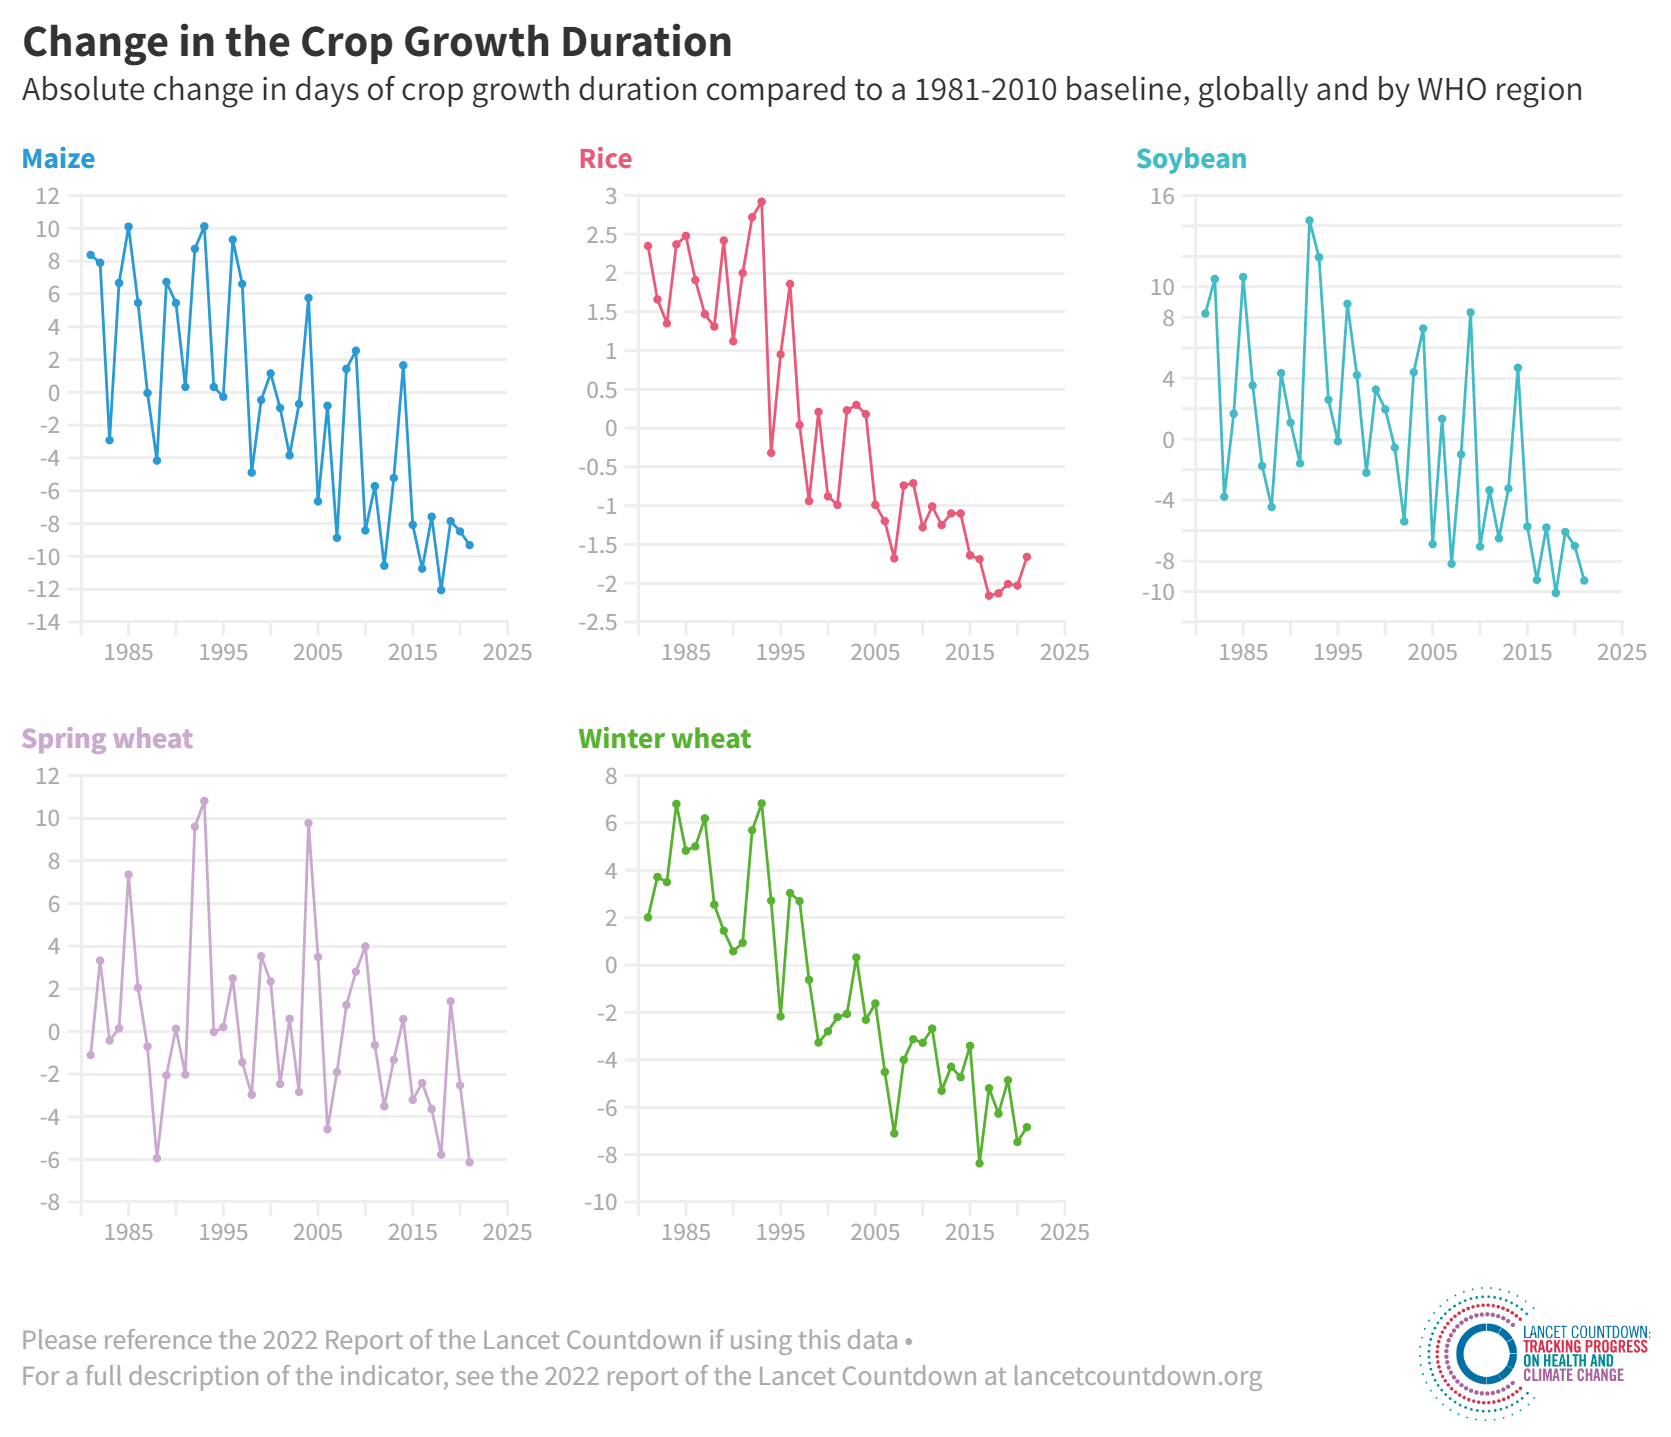
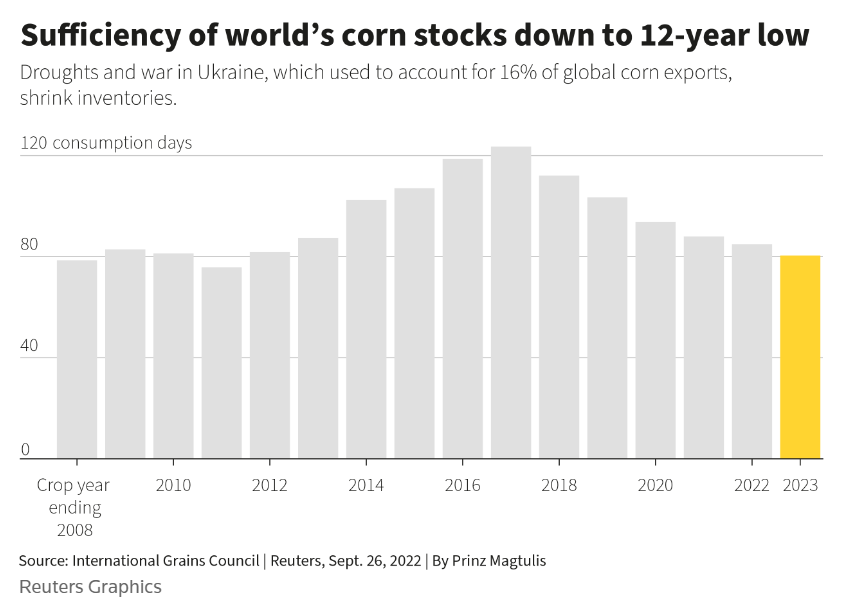
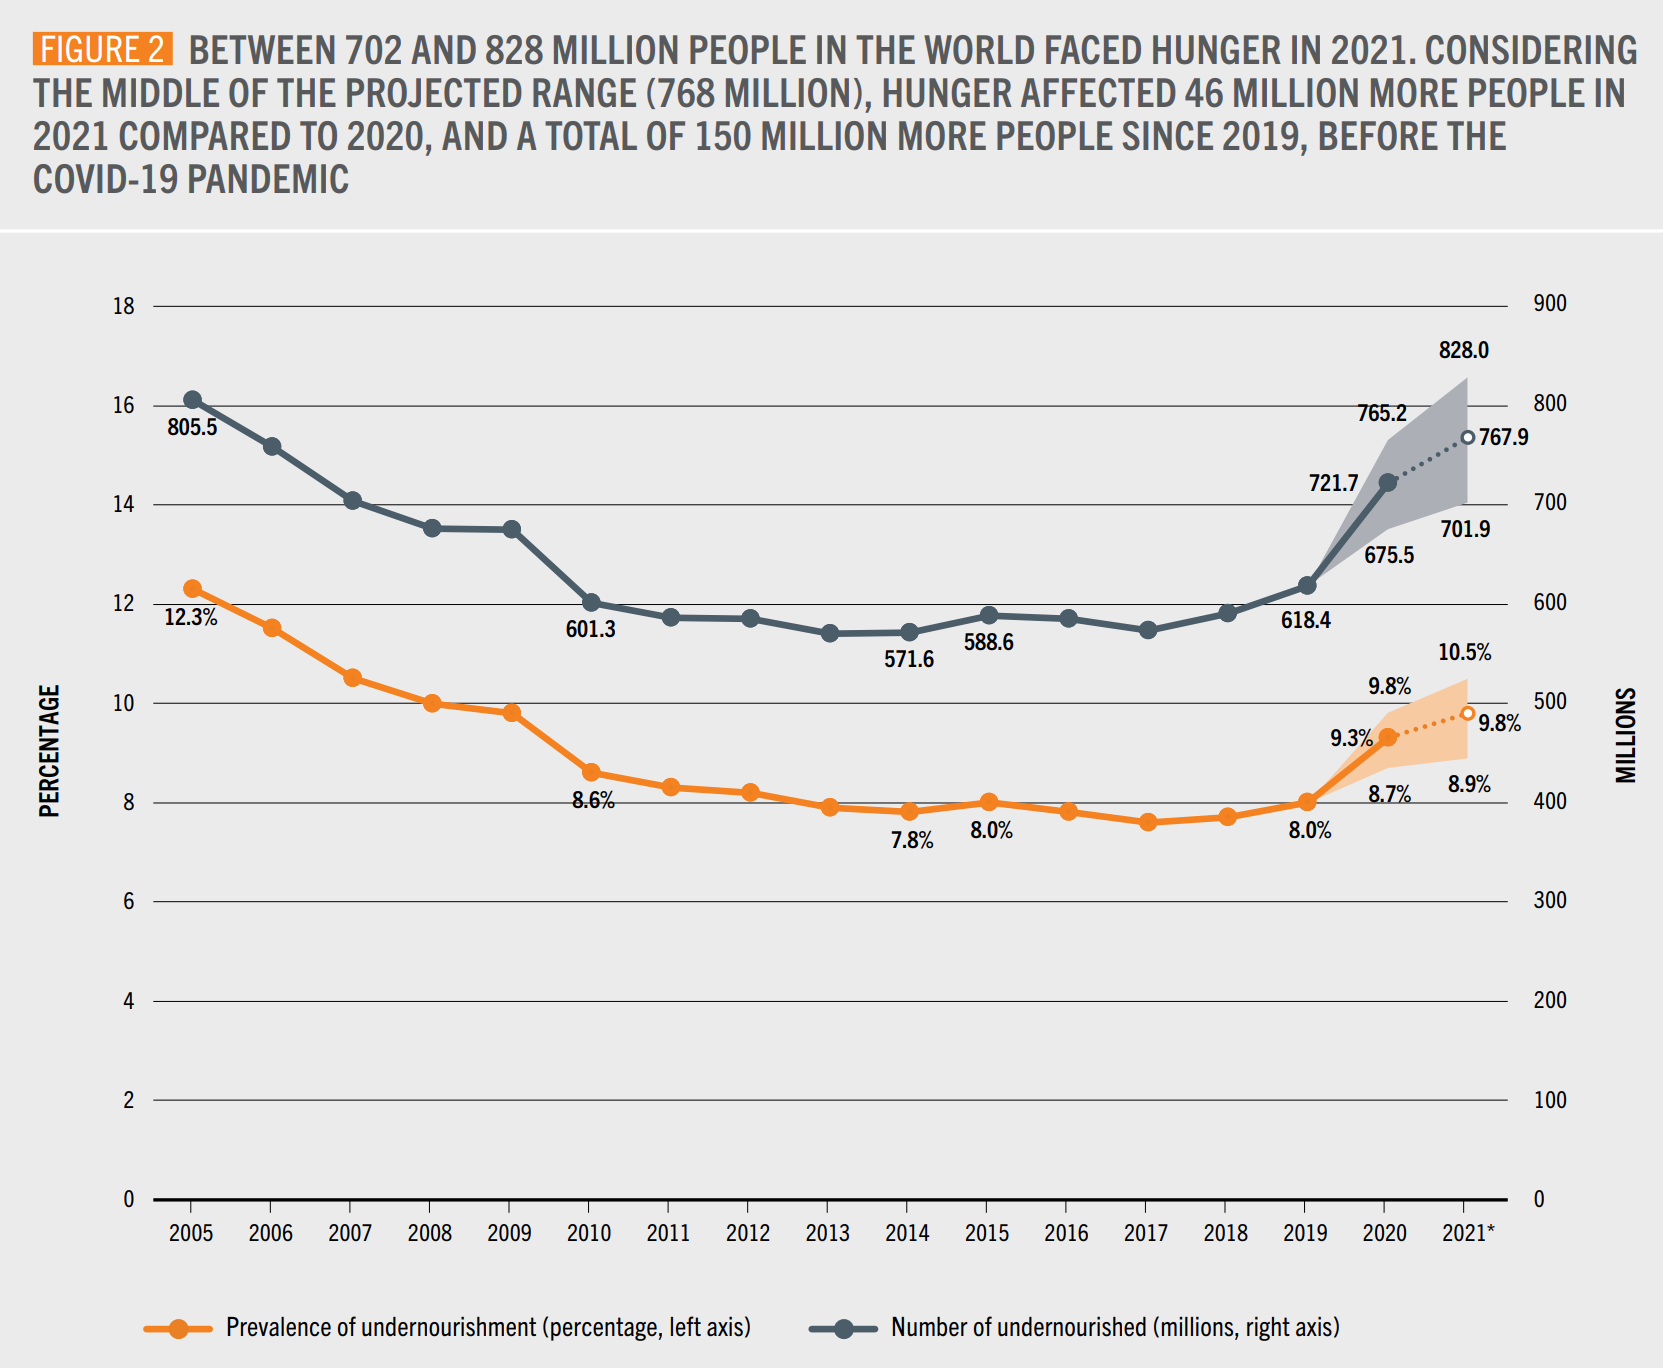
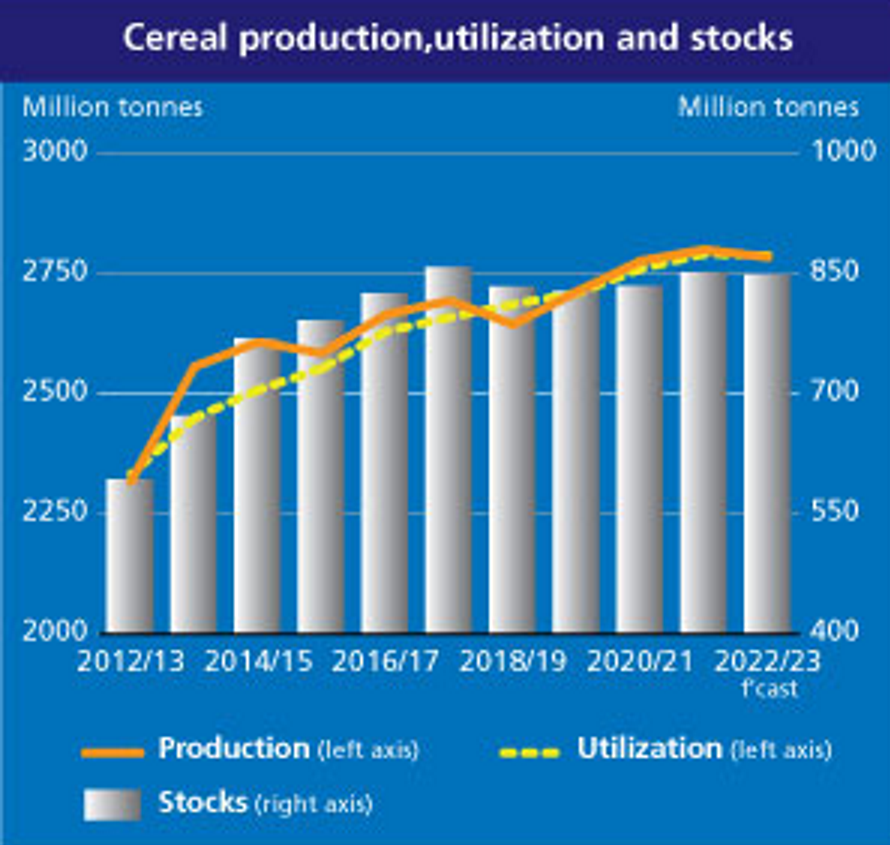
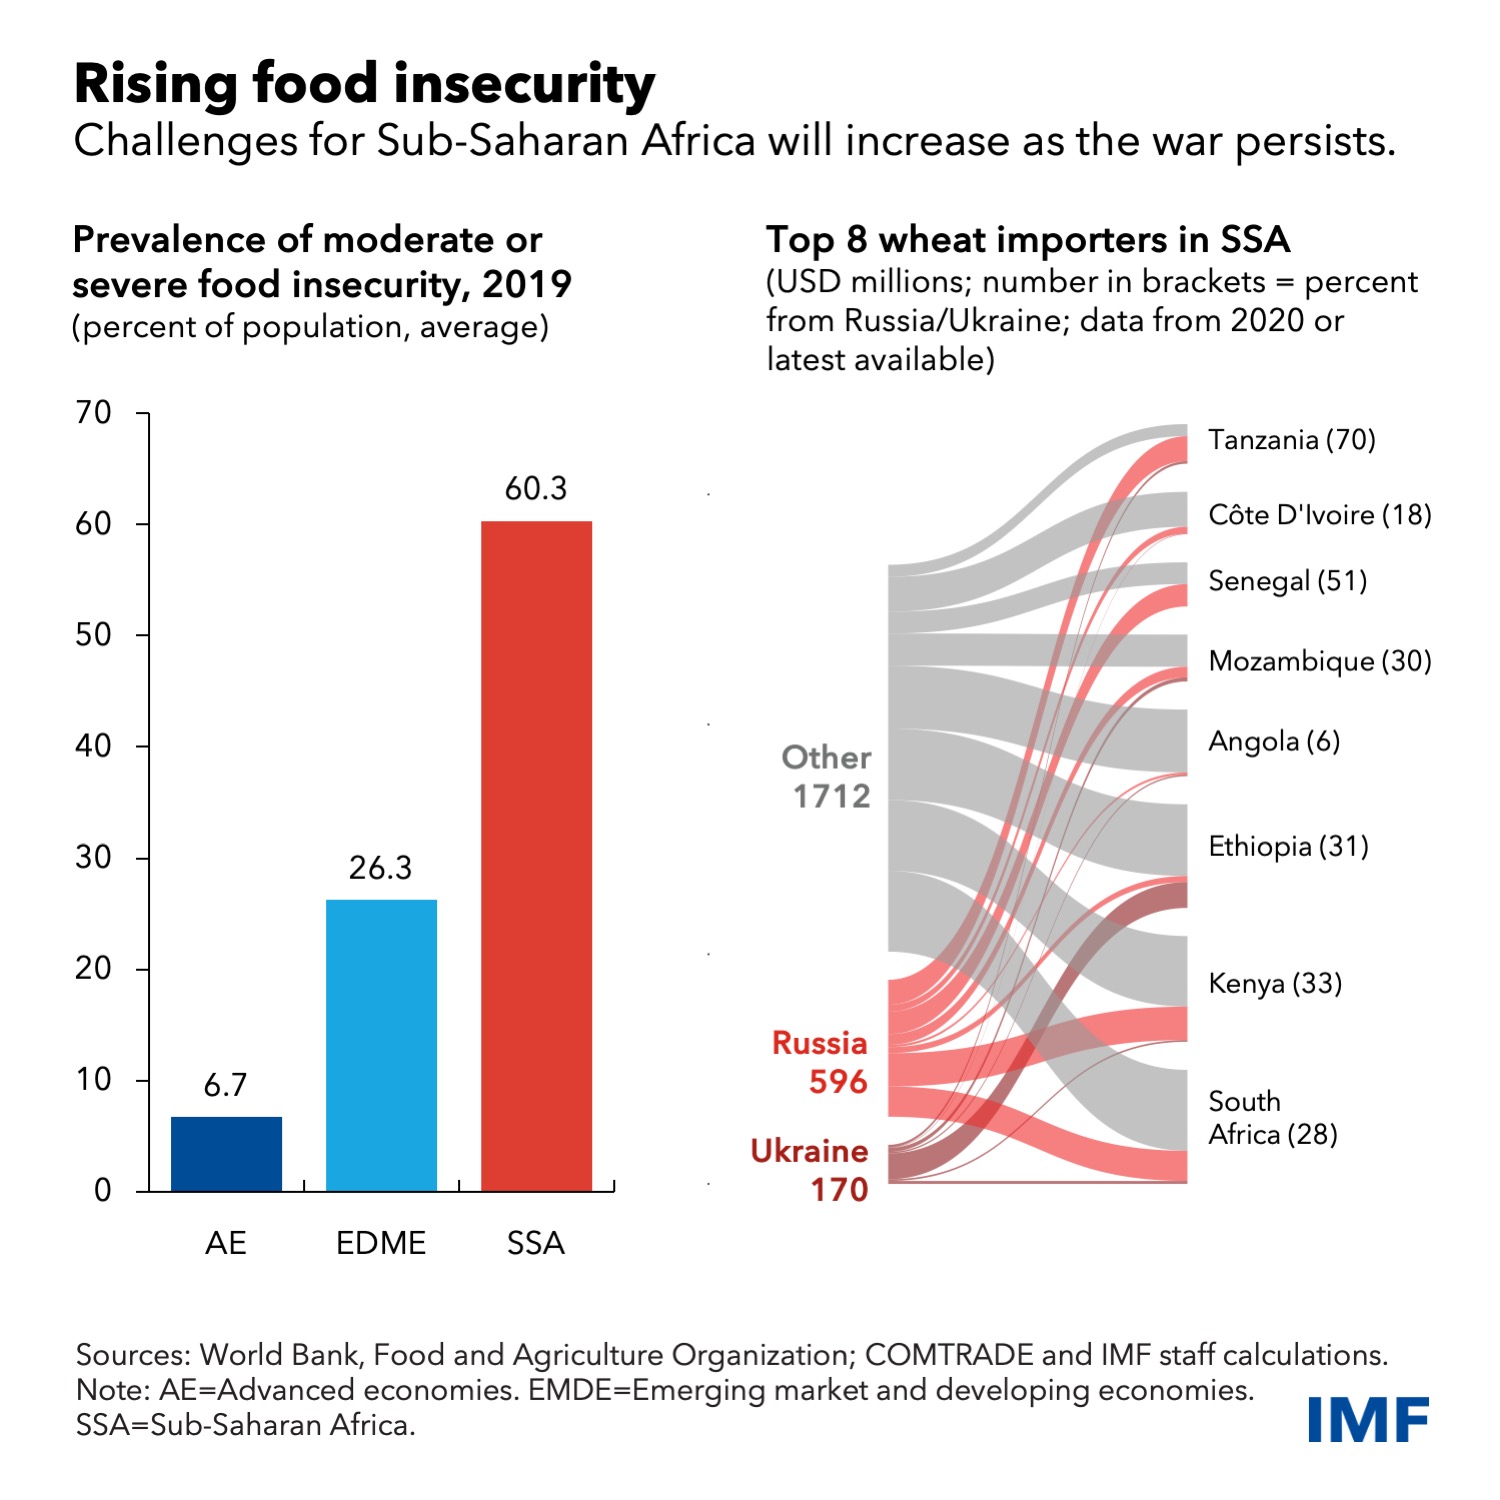
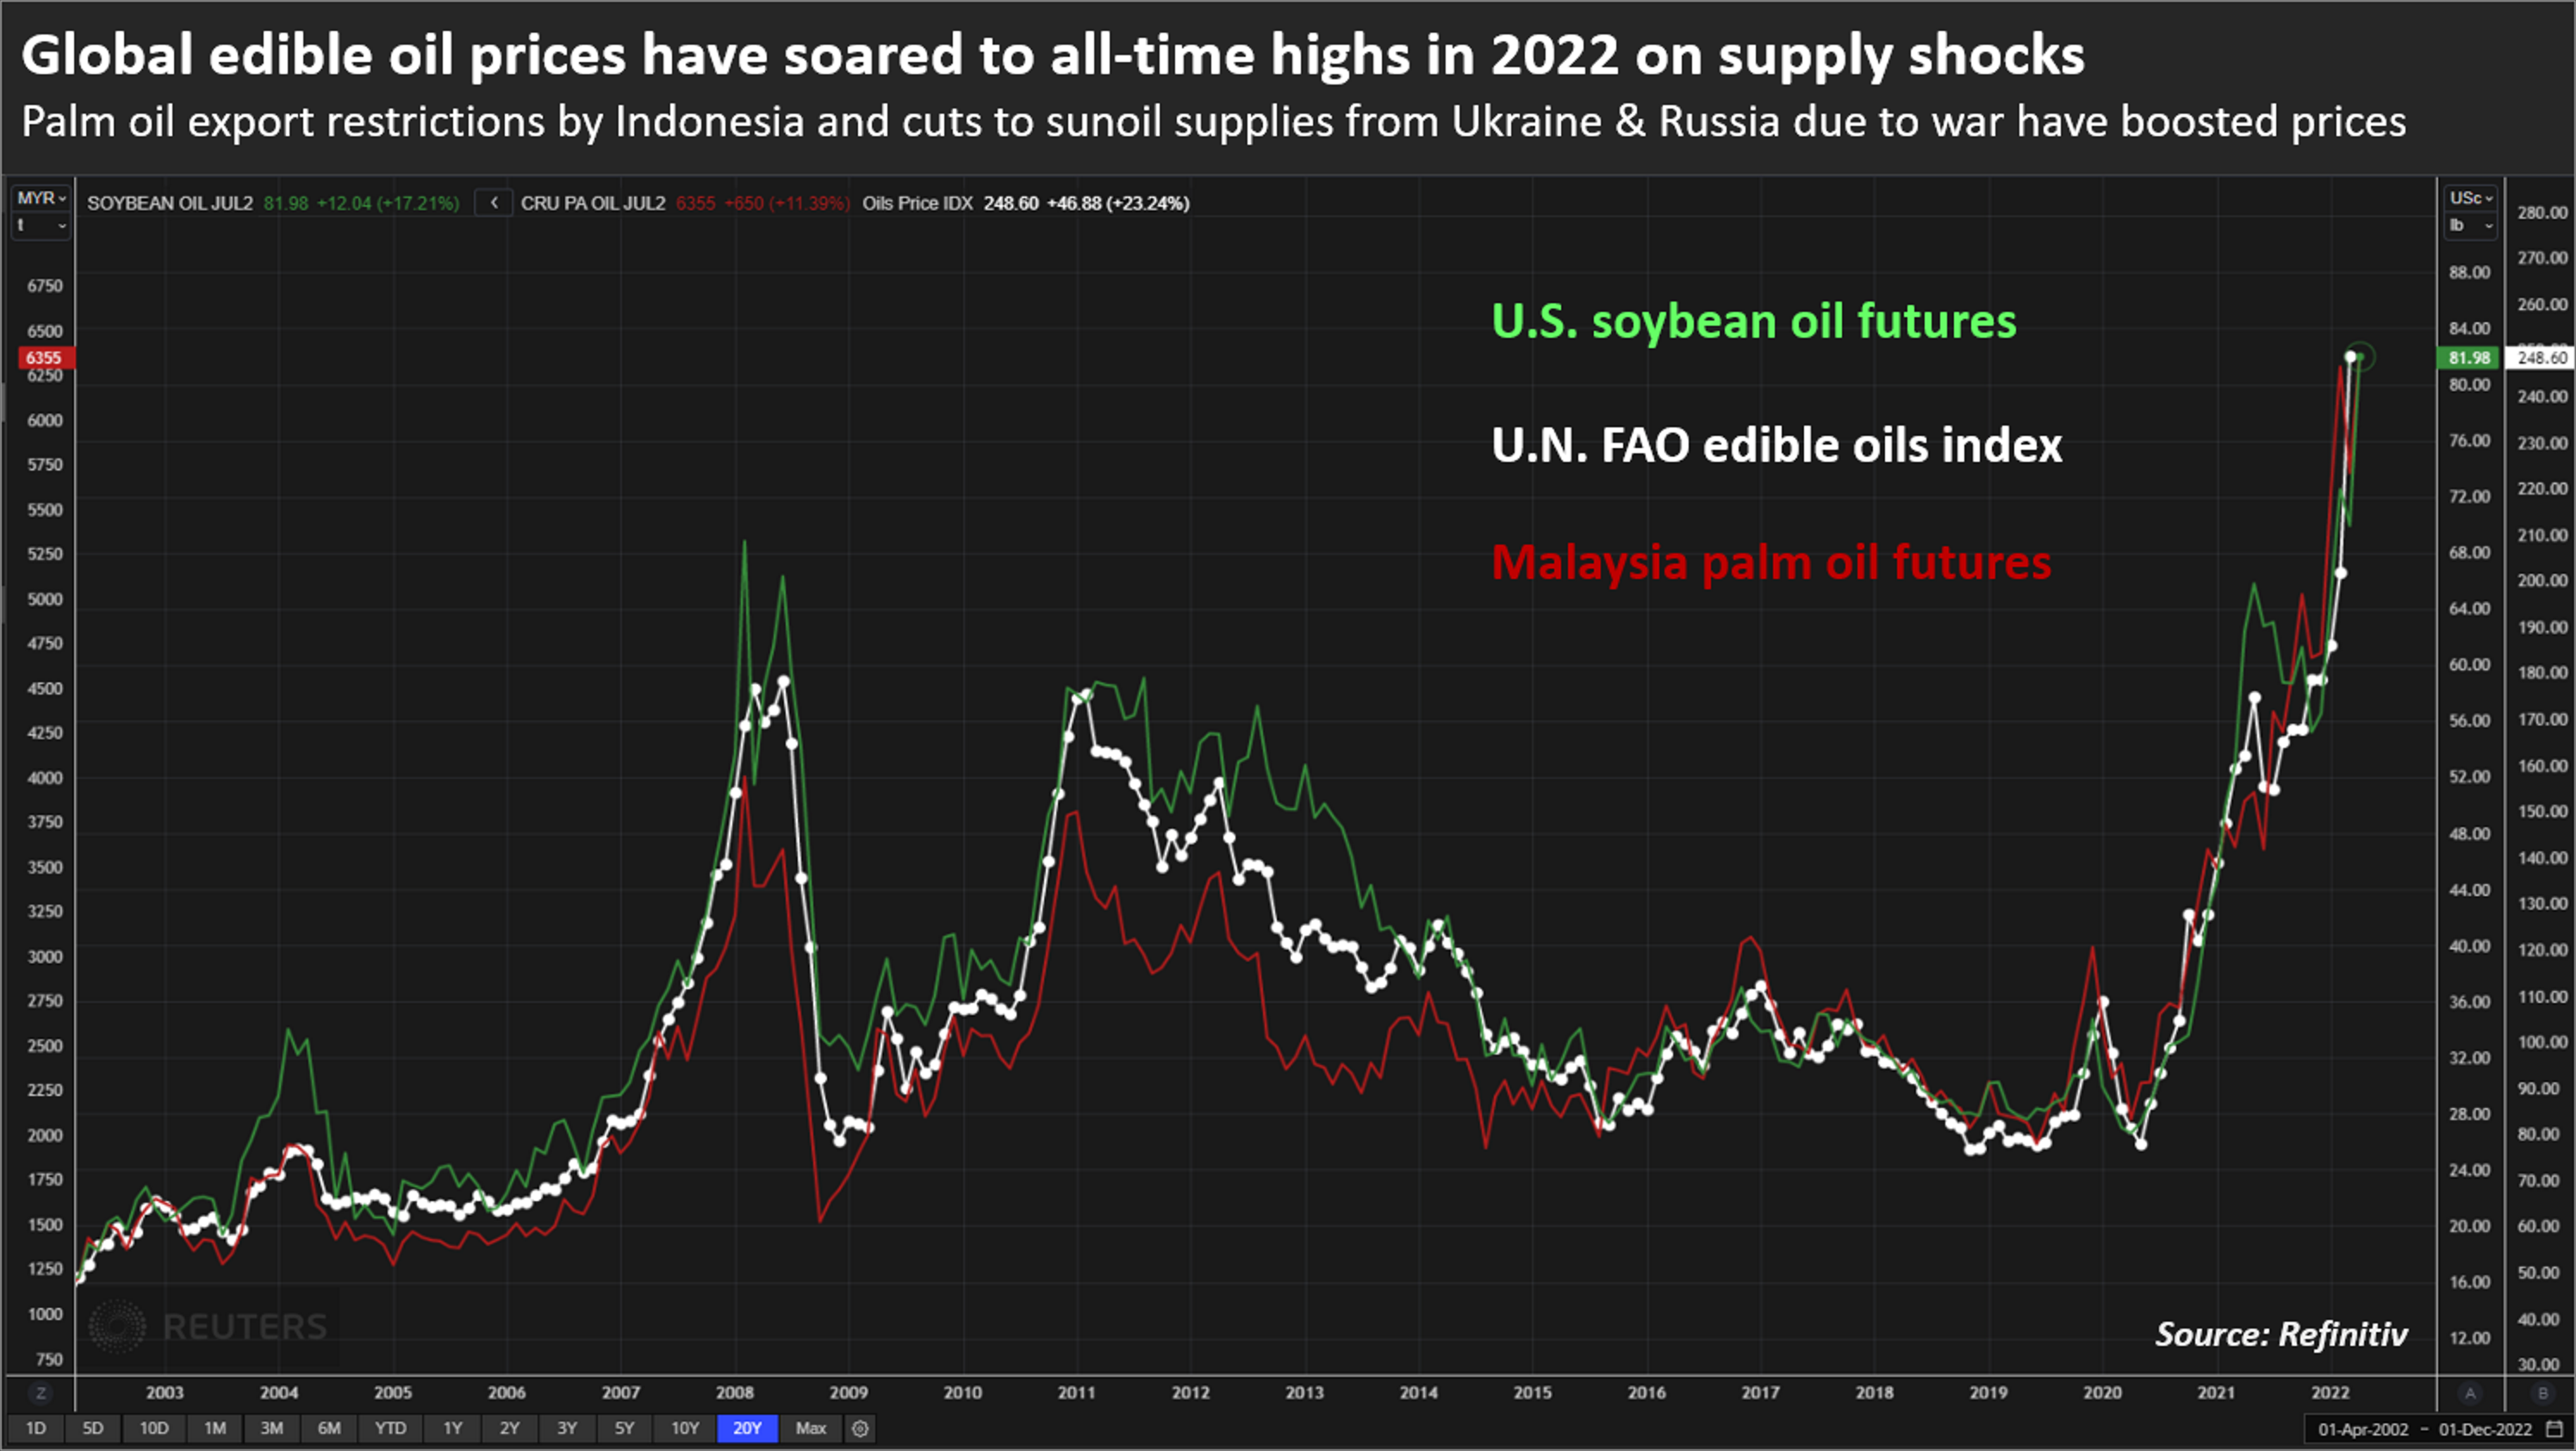
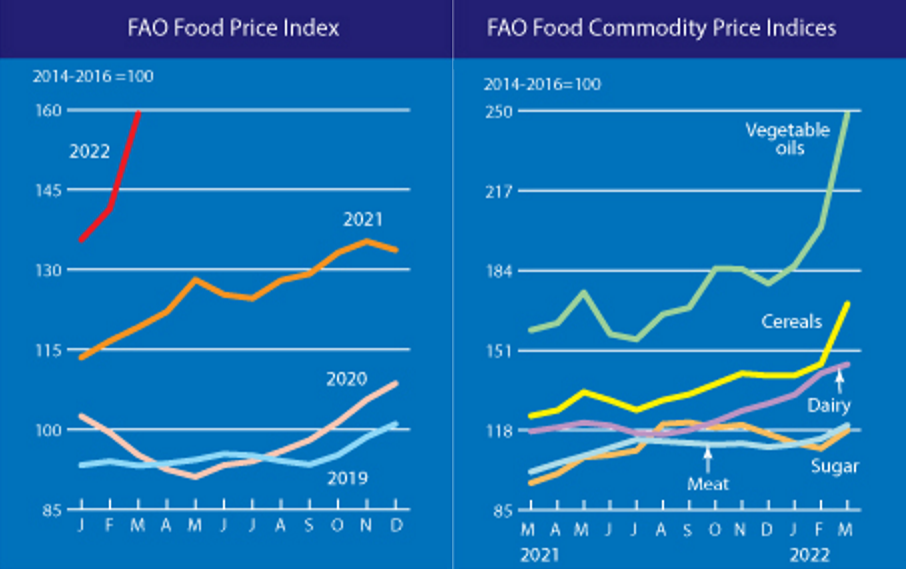
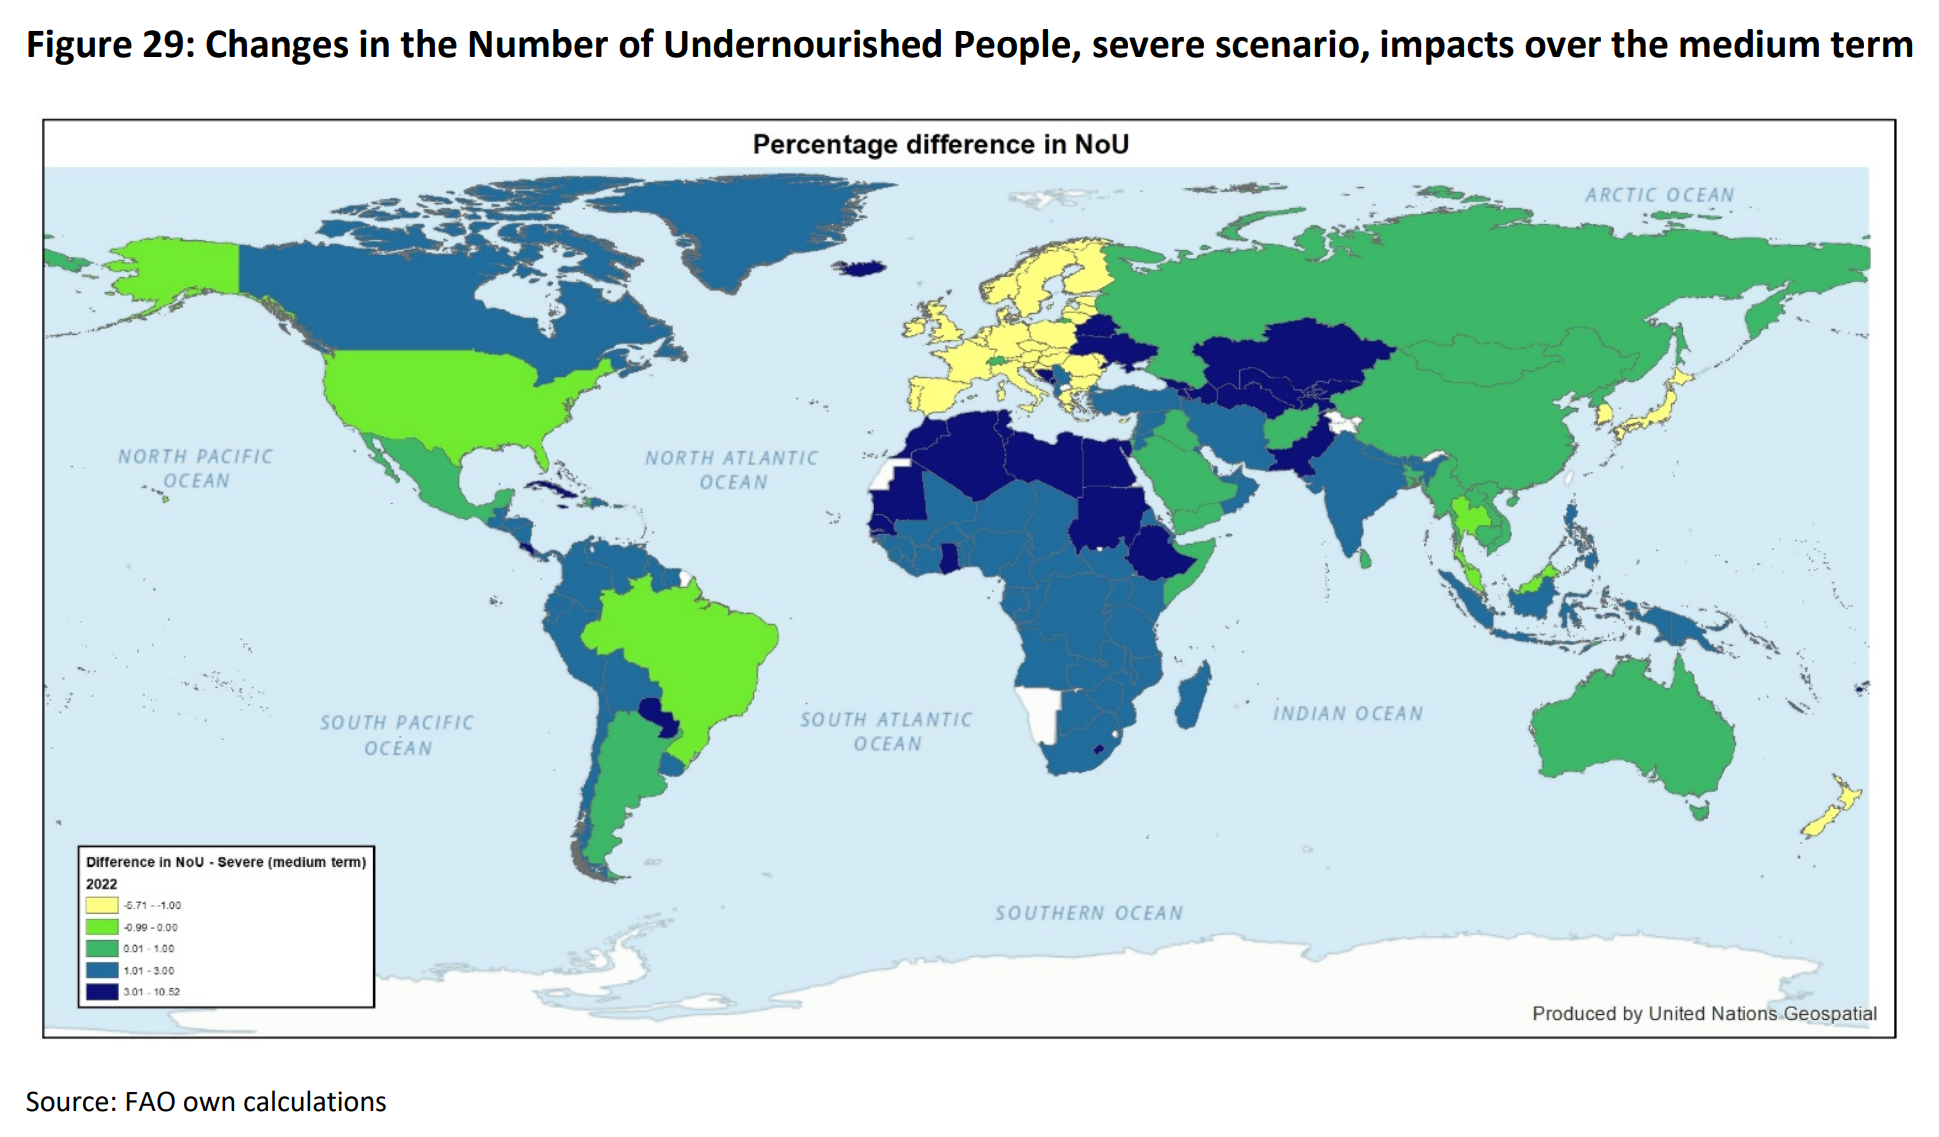
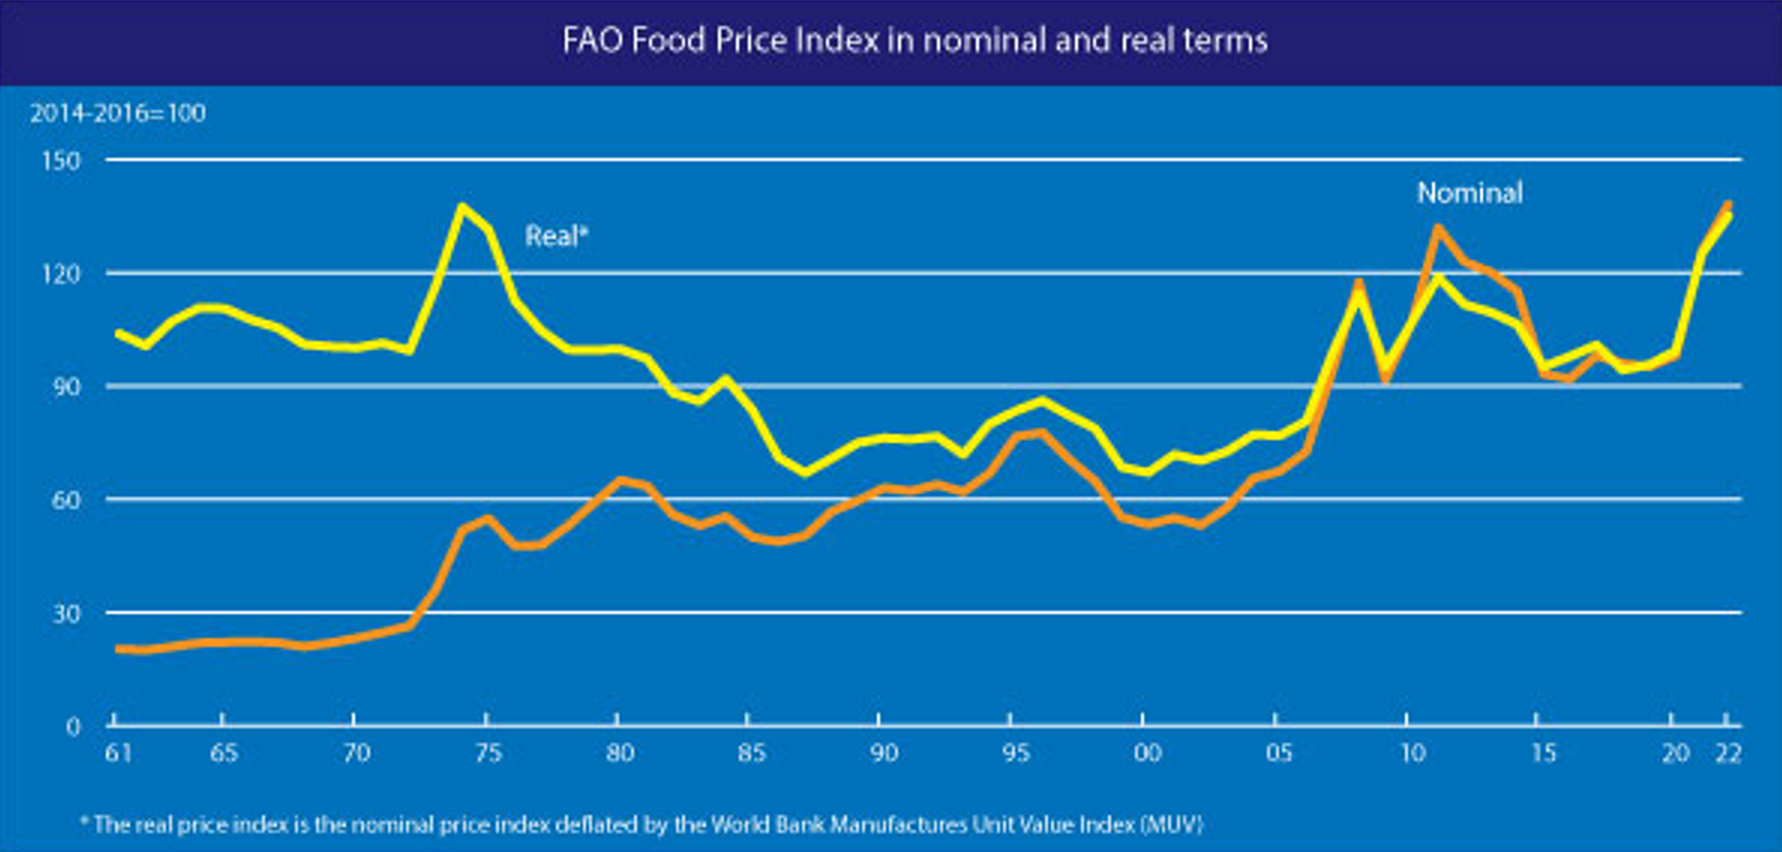
Another measure of human development, prevalence of undernourishment (POU), also continued to worsen in 2022, even before the Russia’s war denied a hungry world most of the agricultural output of Ukraine. The UN report, The State of Food Security and Nutrition in the World 2022 found that world hunger rose in 2021, with 2.3 billion people facing moderate or severe difficulty obtaining adequate food.
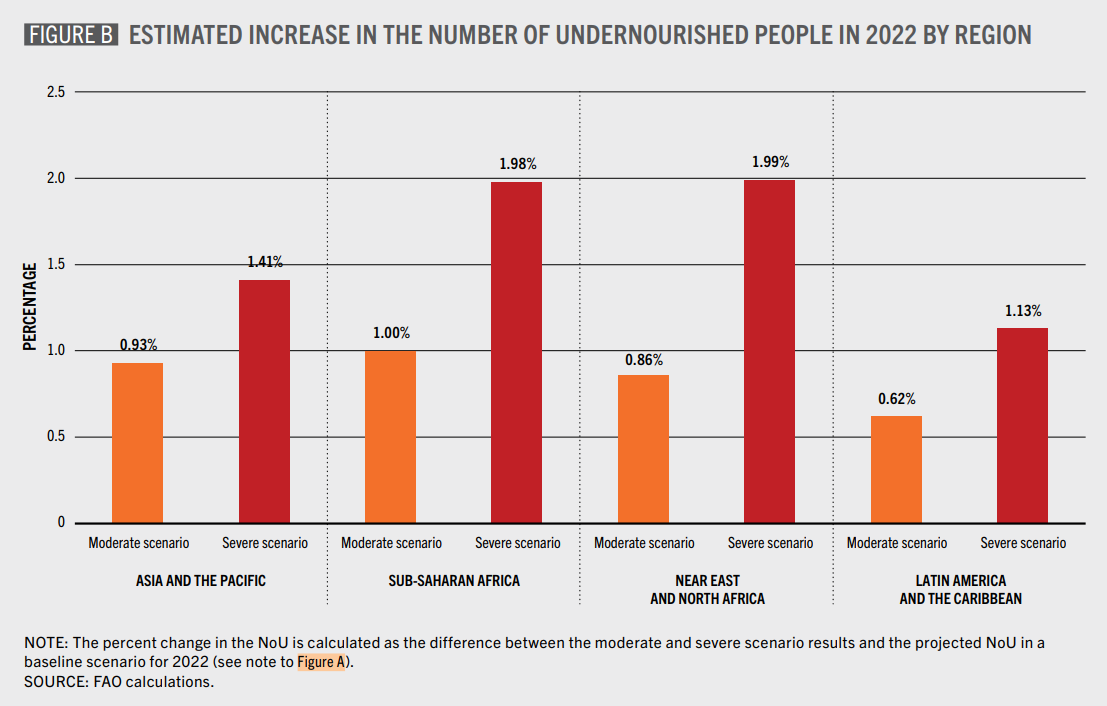
The UN reported, “The most recent evidence available suggests that the number of people unable to afford a healthy diet around the world rose by 112 million to almost 3.1 billion, reflecting the impacts of rising consumer food prices during the (COVID-19) pandemic.”
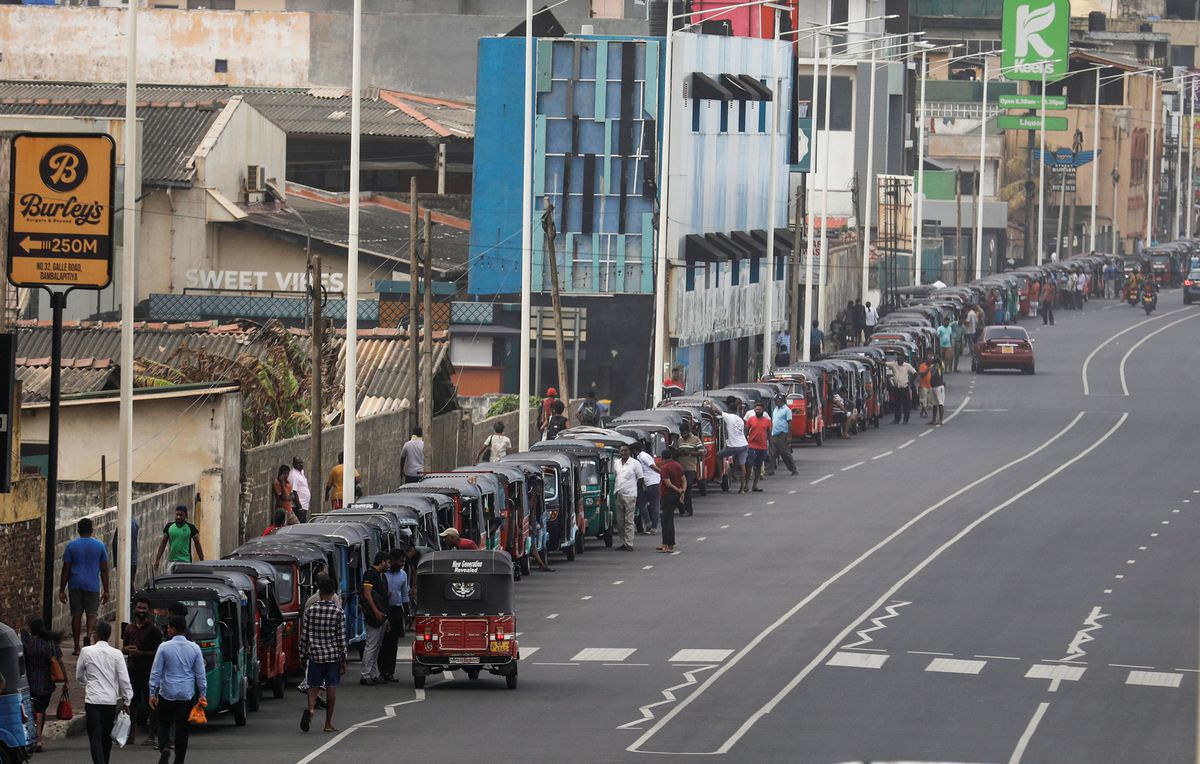
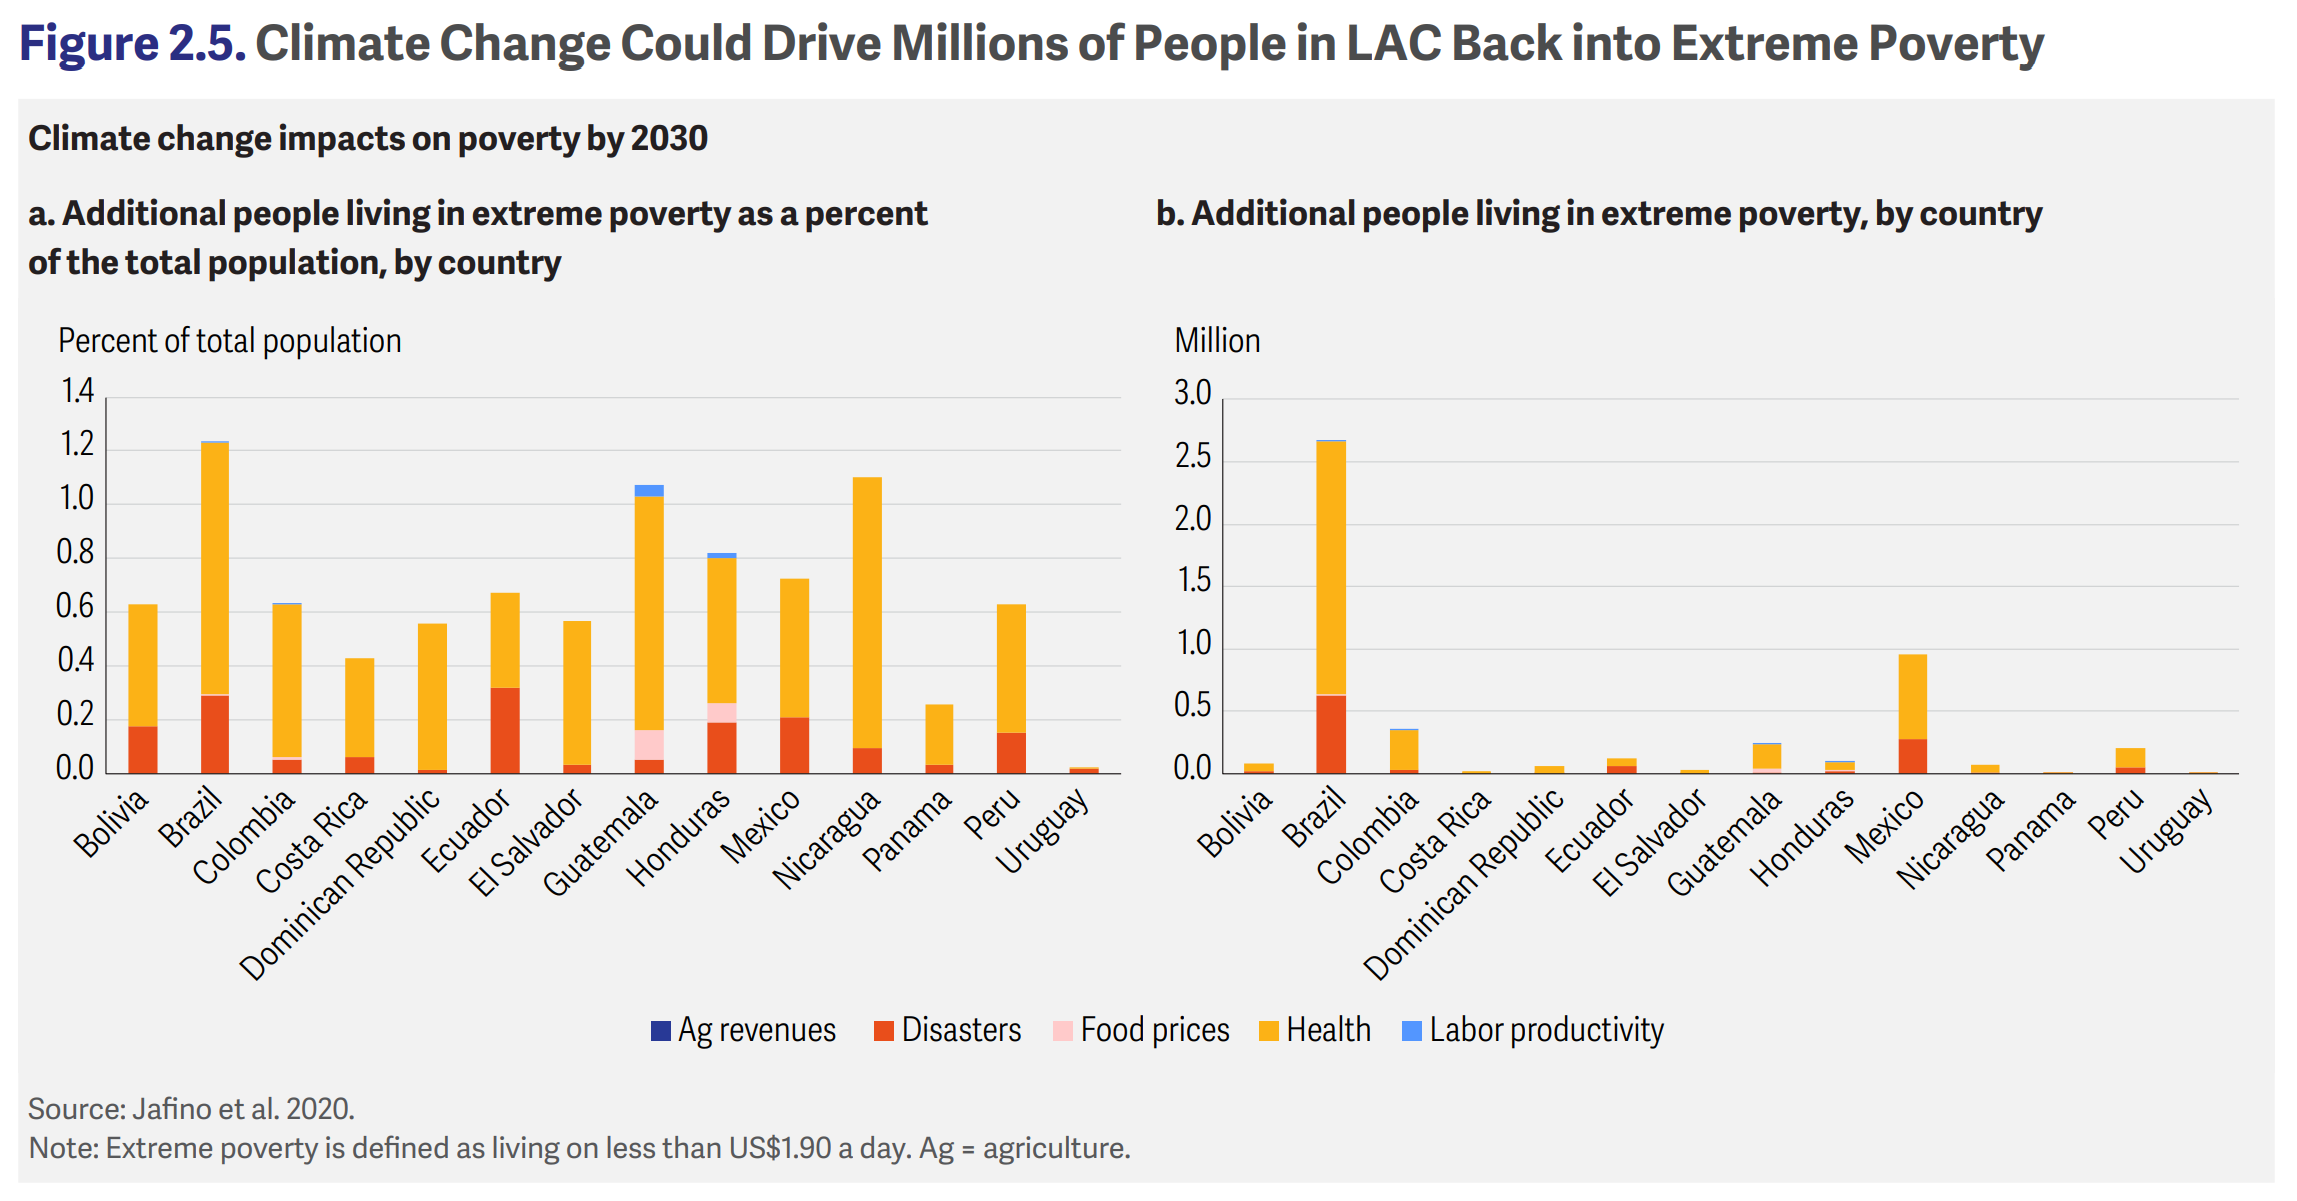
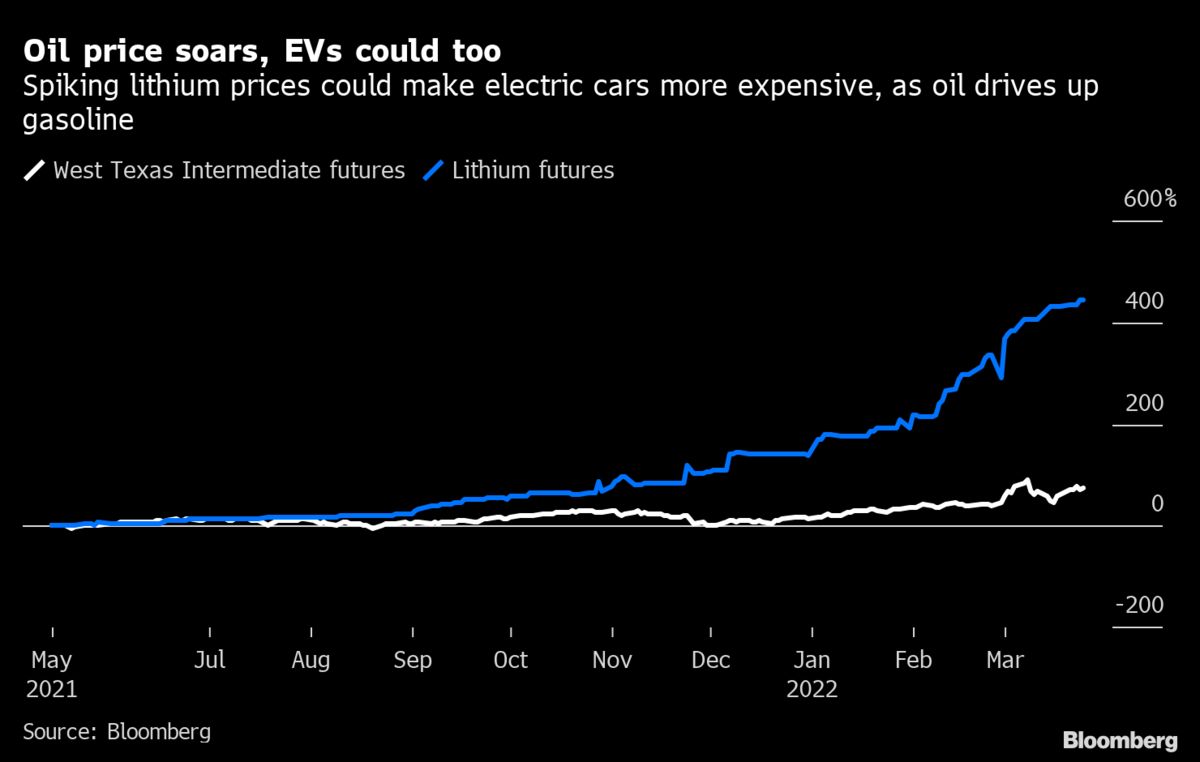
It warned that Russia’s war on Ukraine, “is disrupting supply chains and further affecting prices of grain, fertilizer and energy,” resulting in more price increases in the first half of 2022. Simultaneously, more frequent and extreme climate disasters are also disrupting supply chains and agriculture, especially in low-income countries.
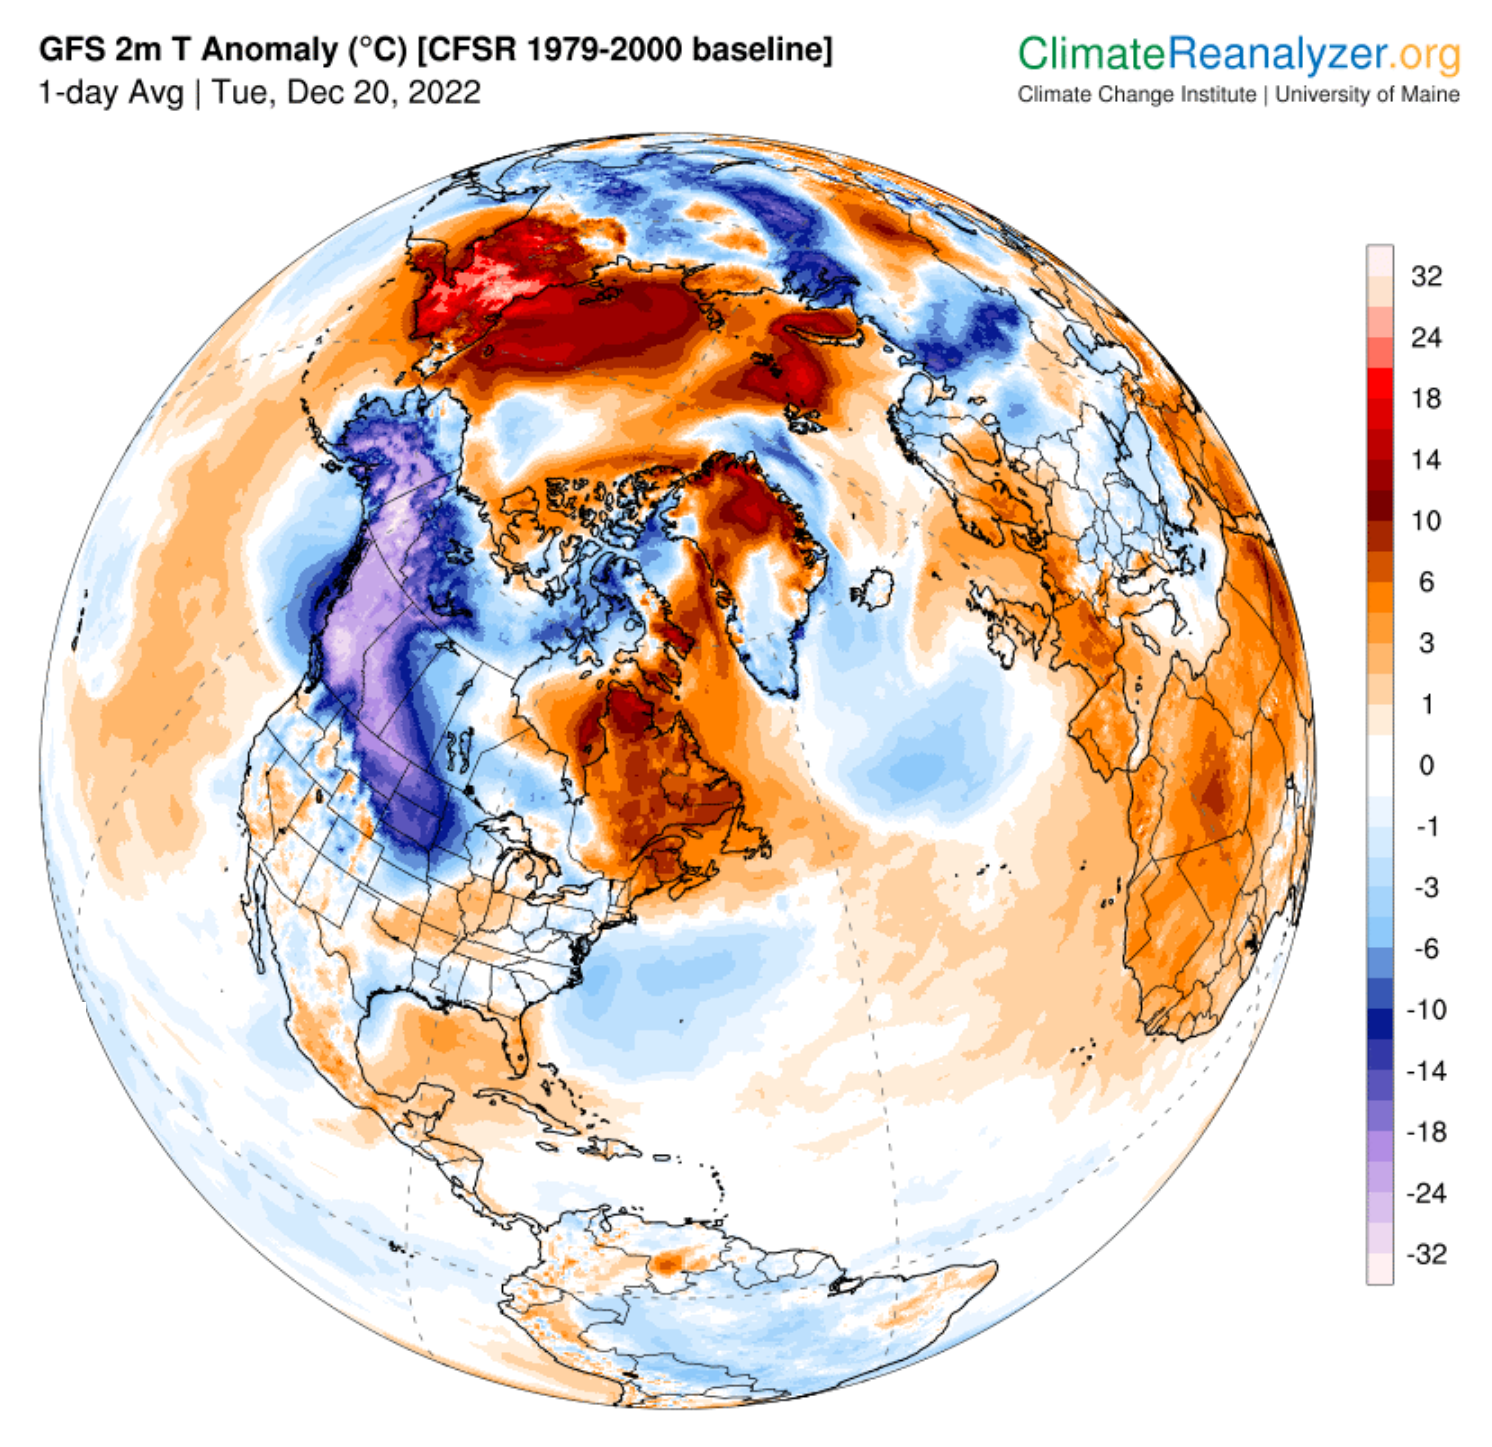
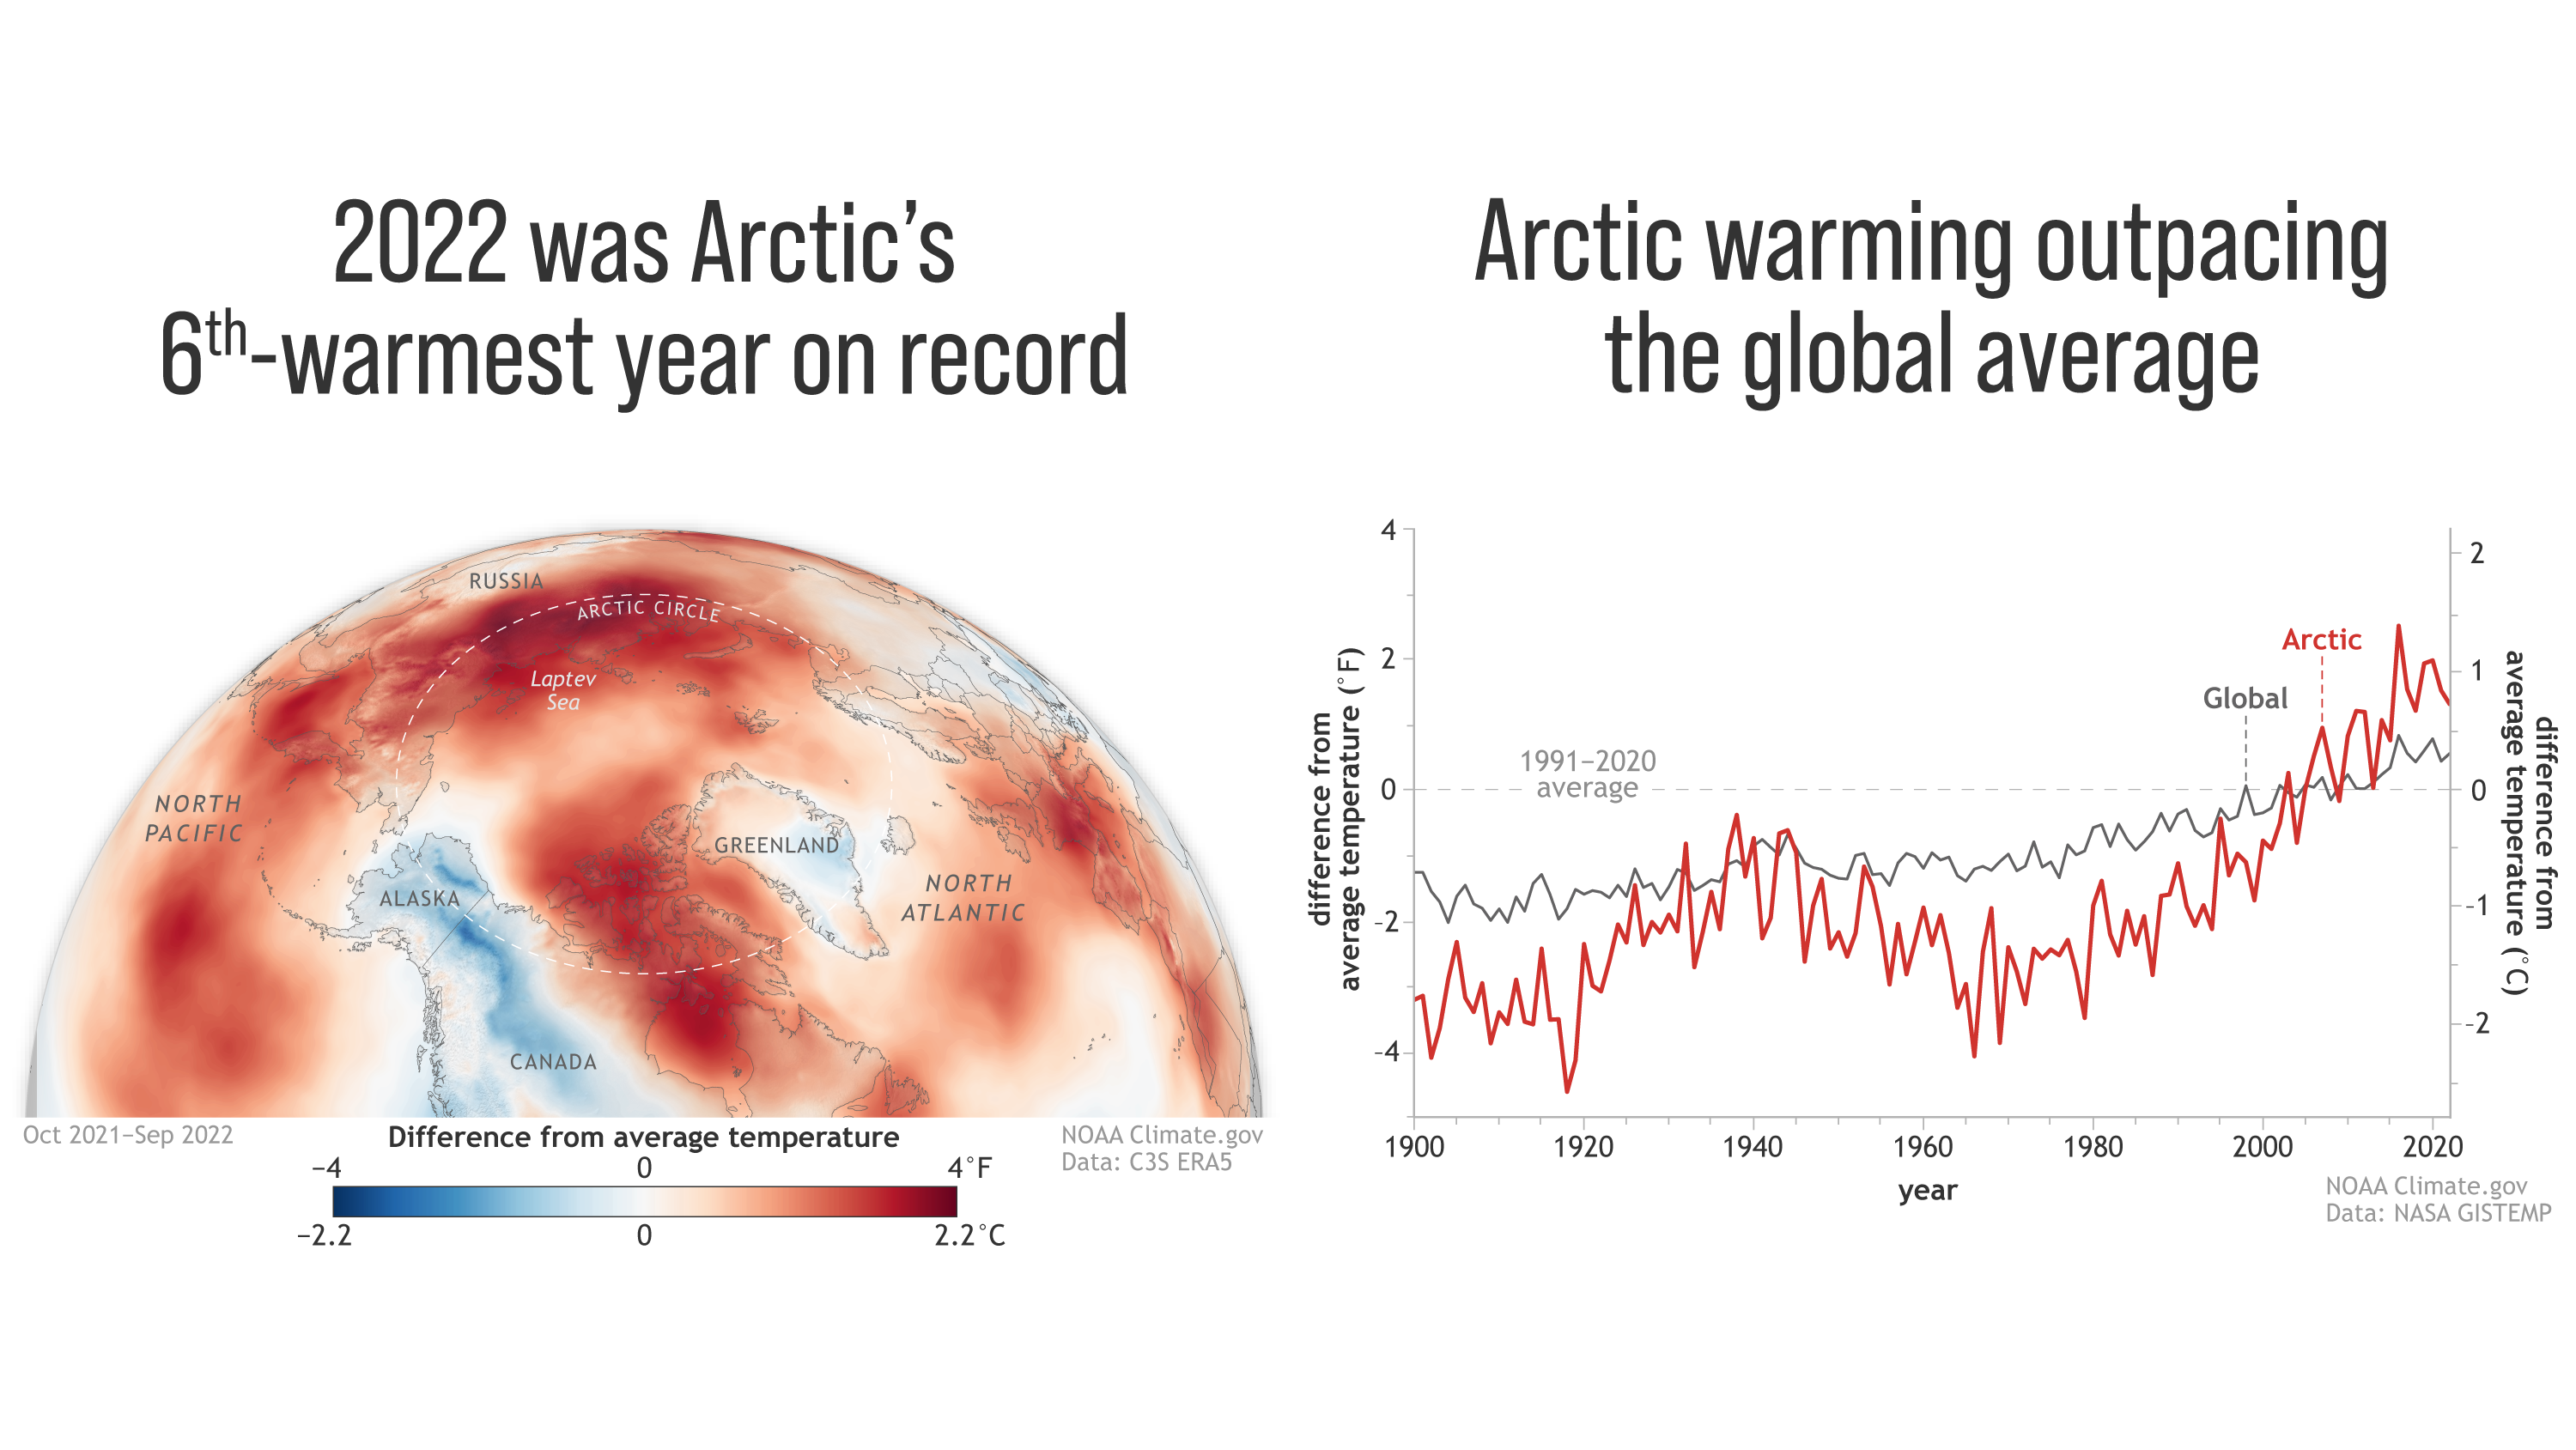
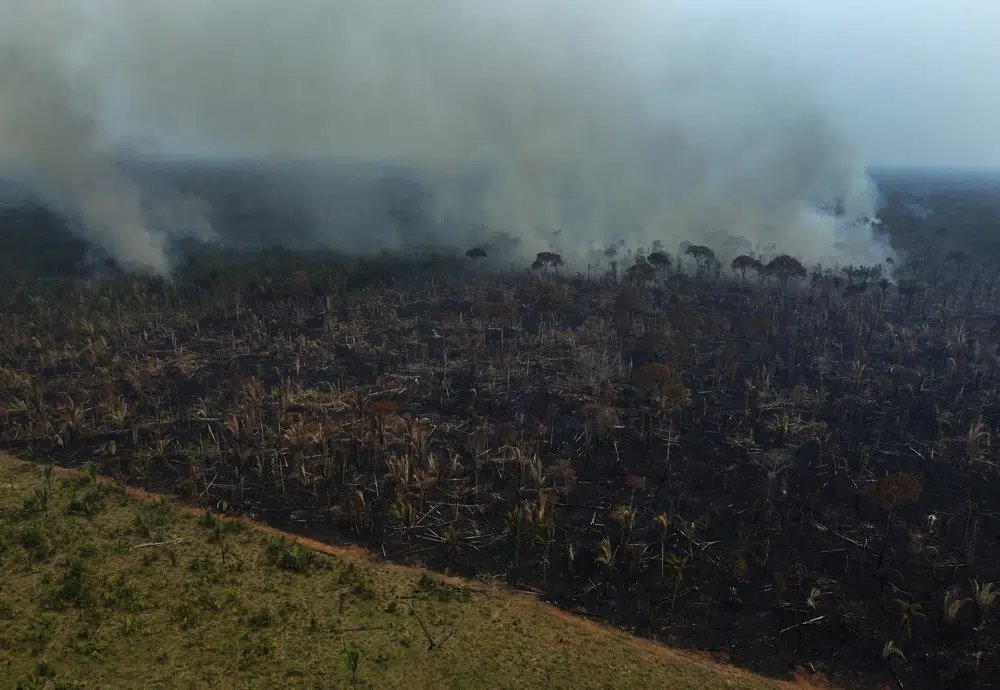
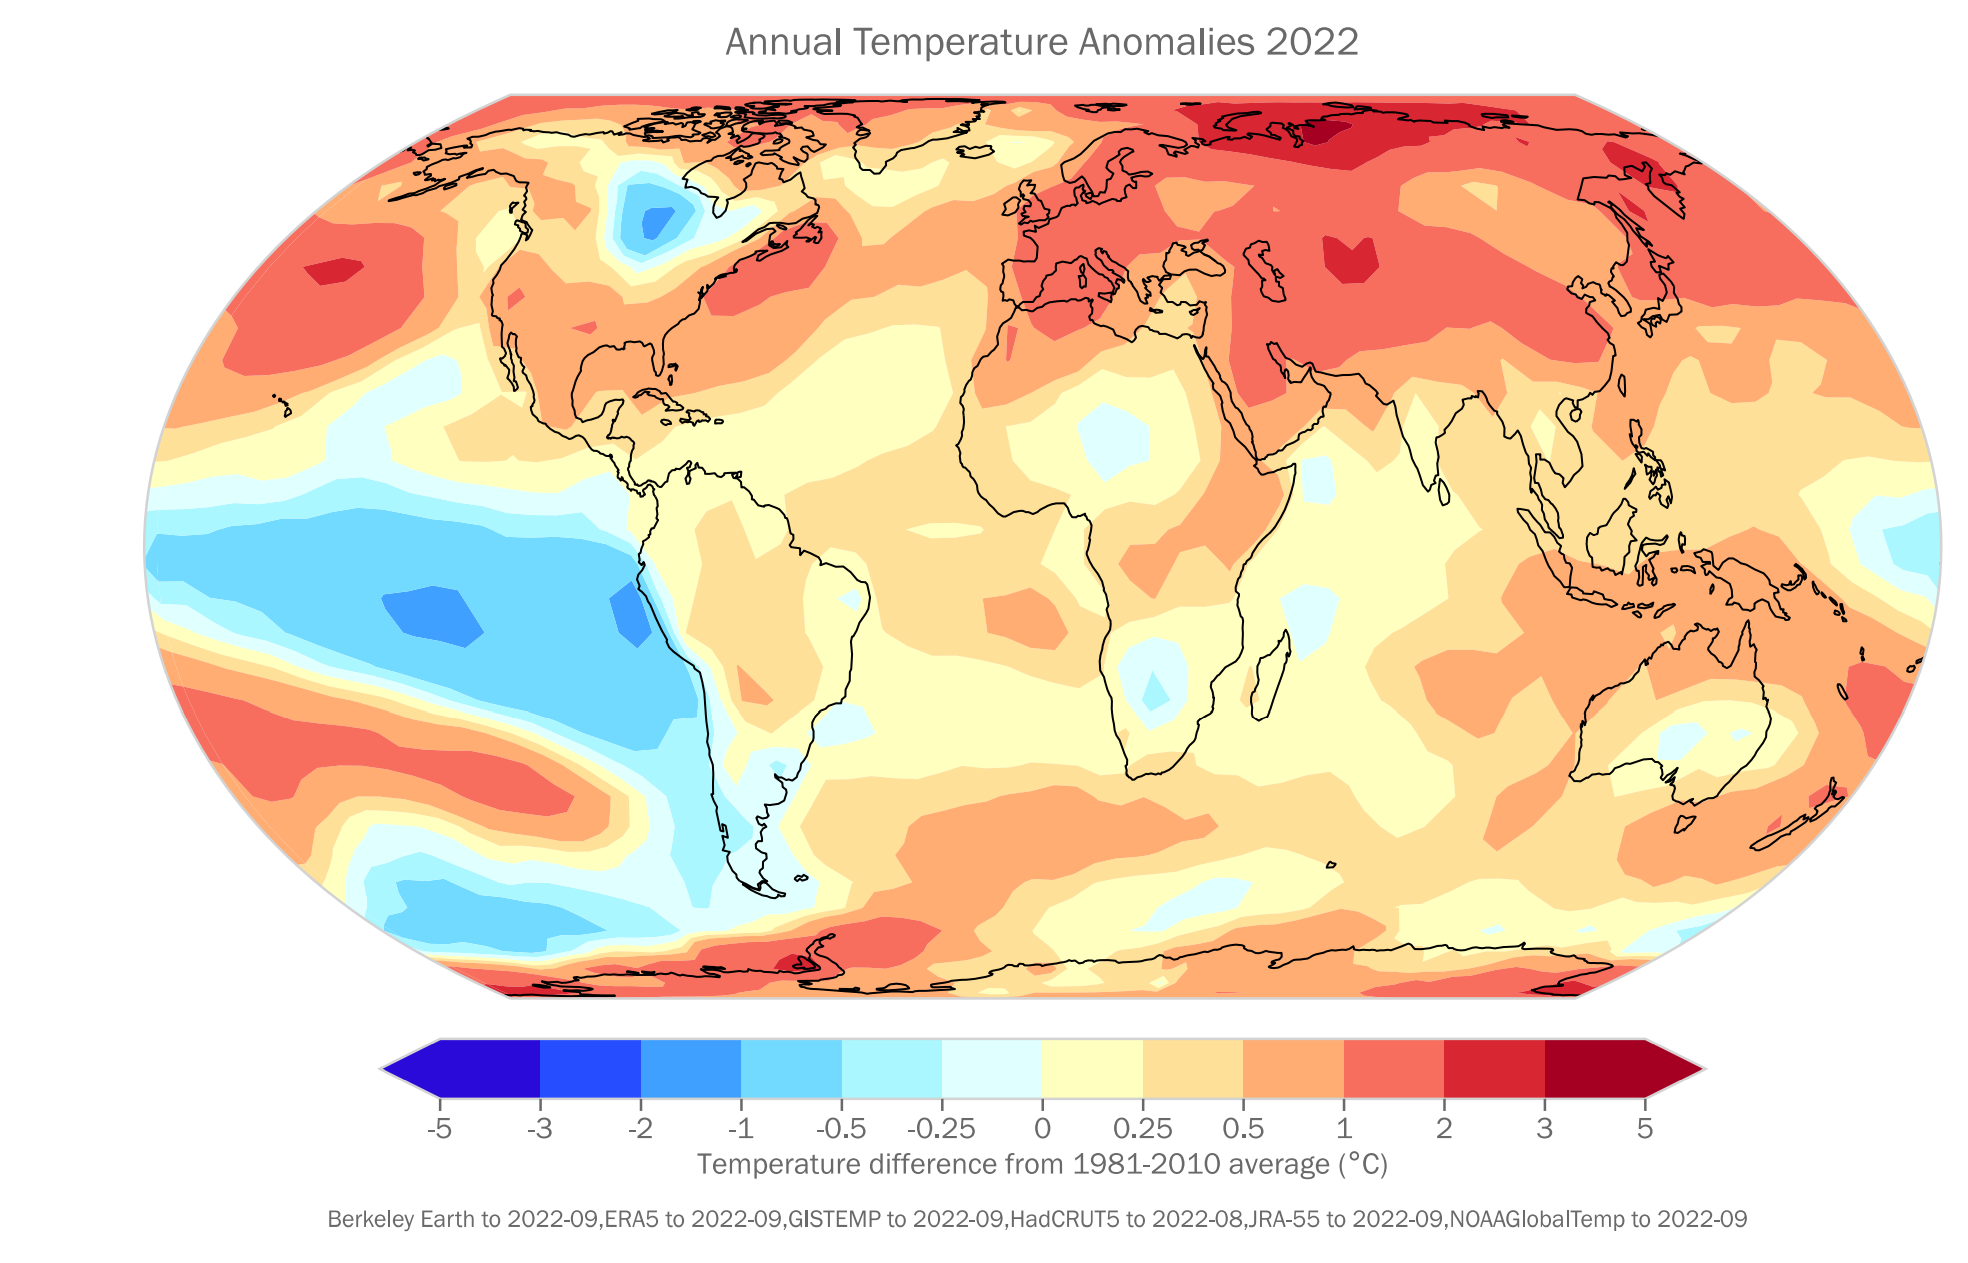
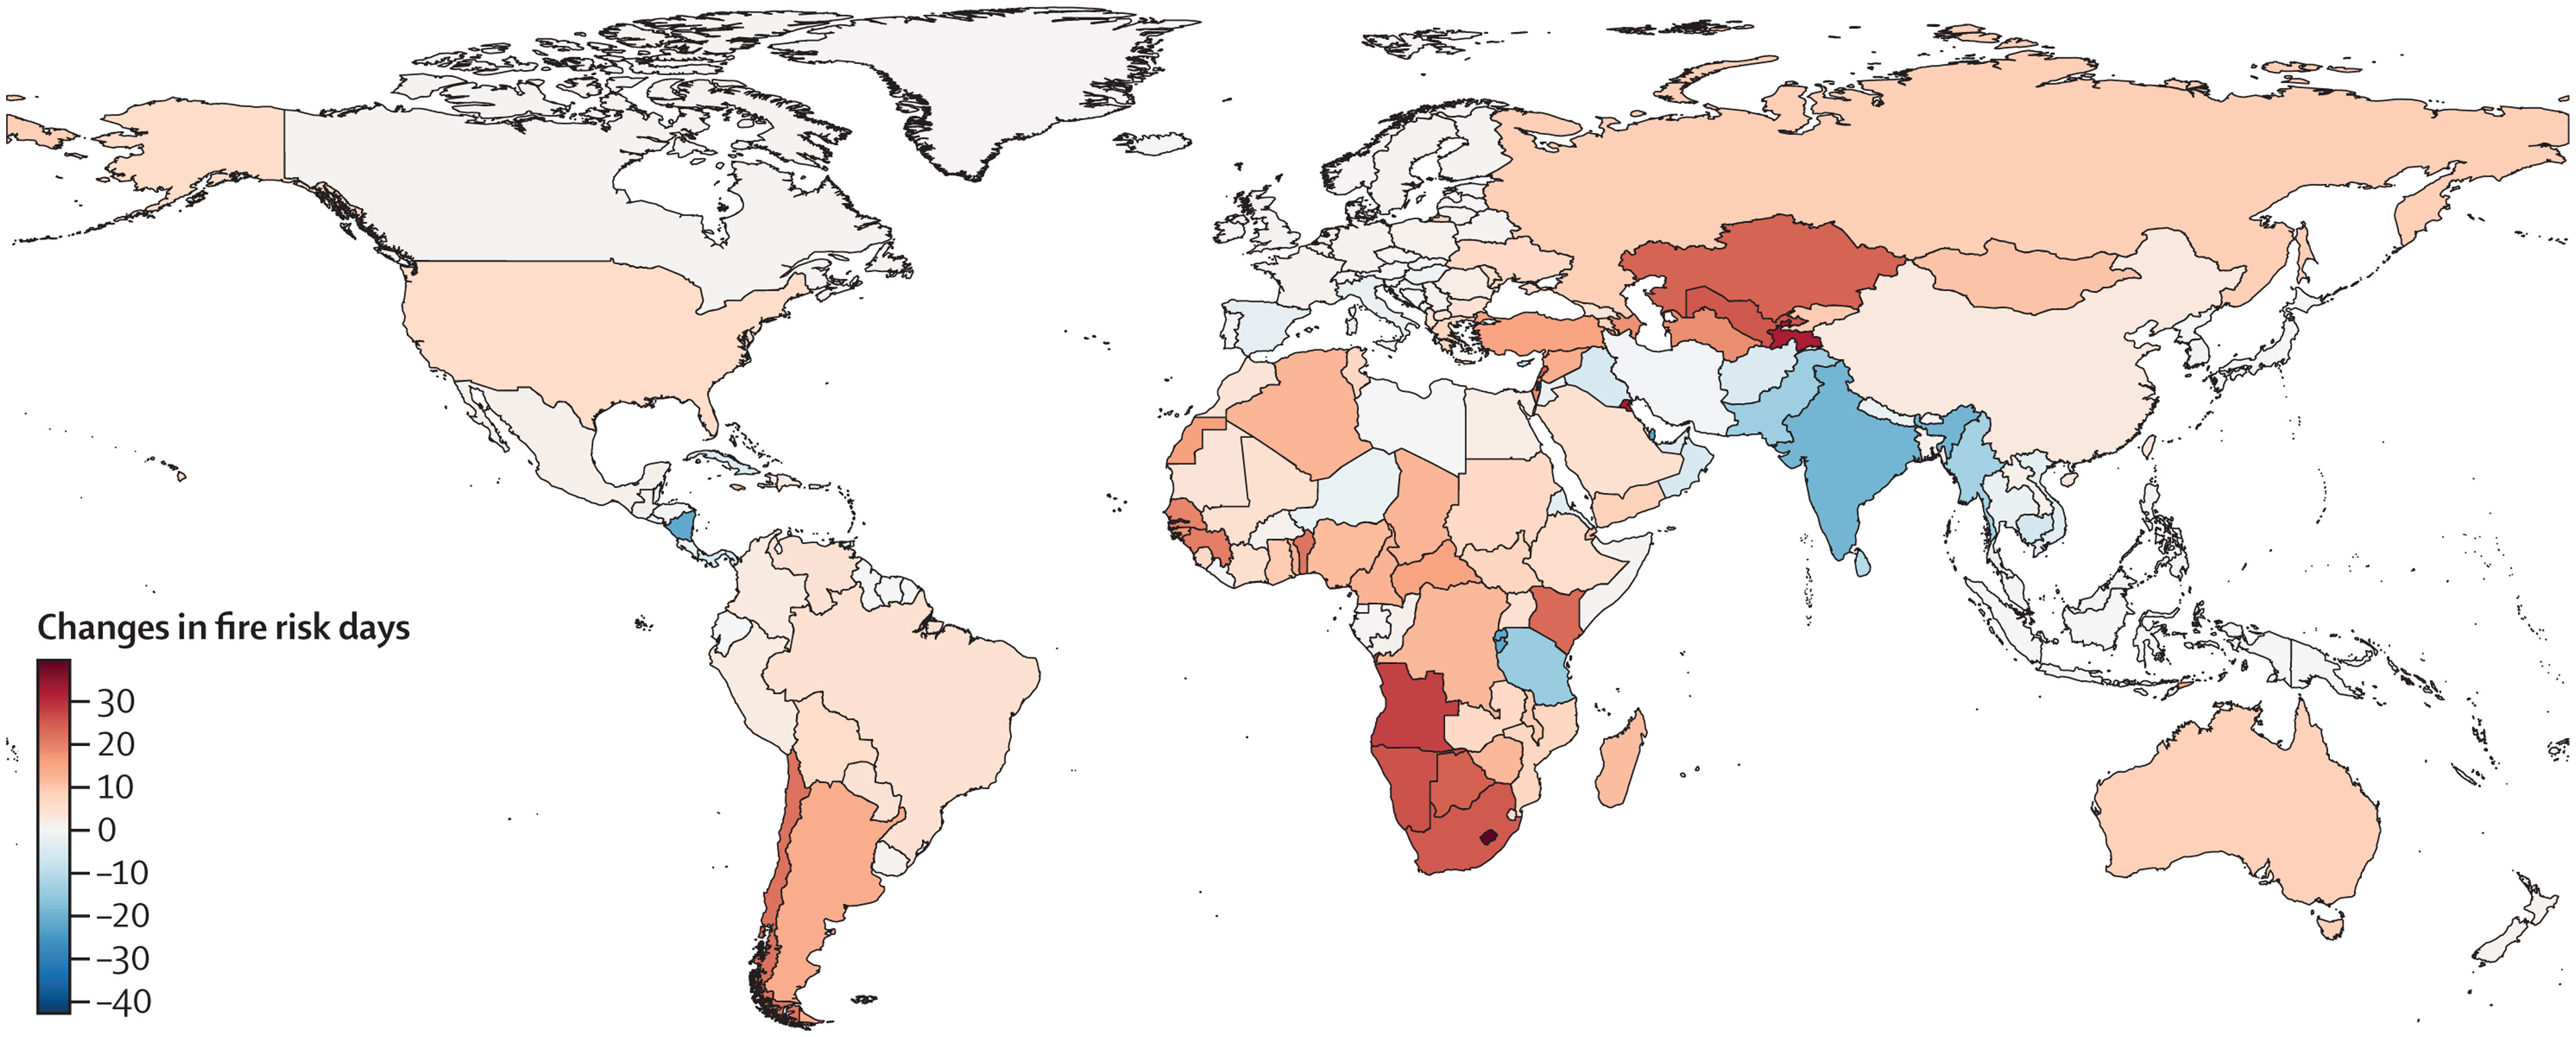
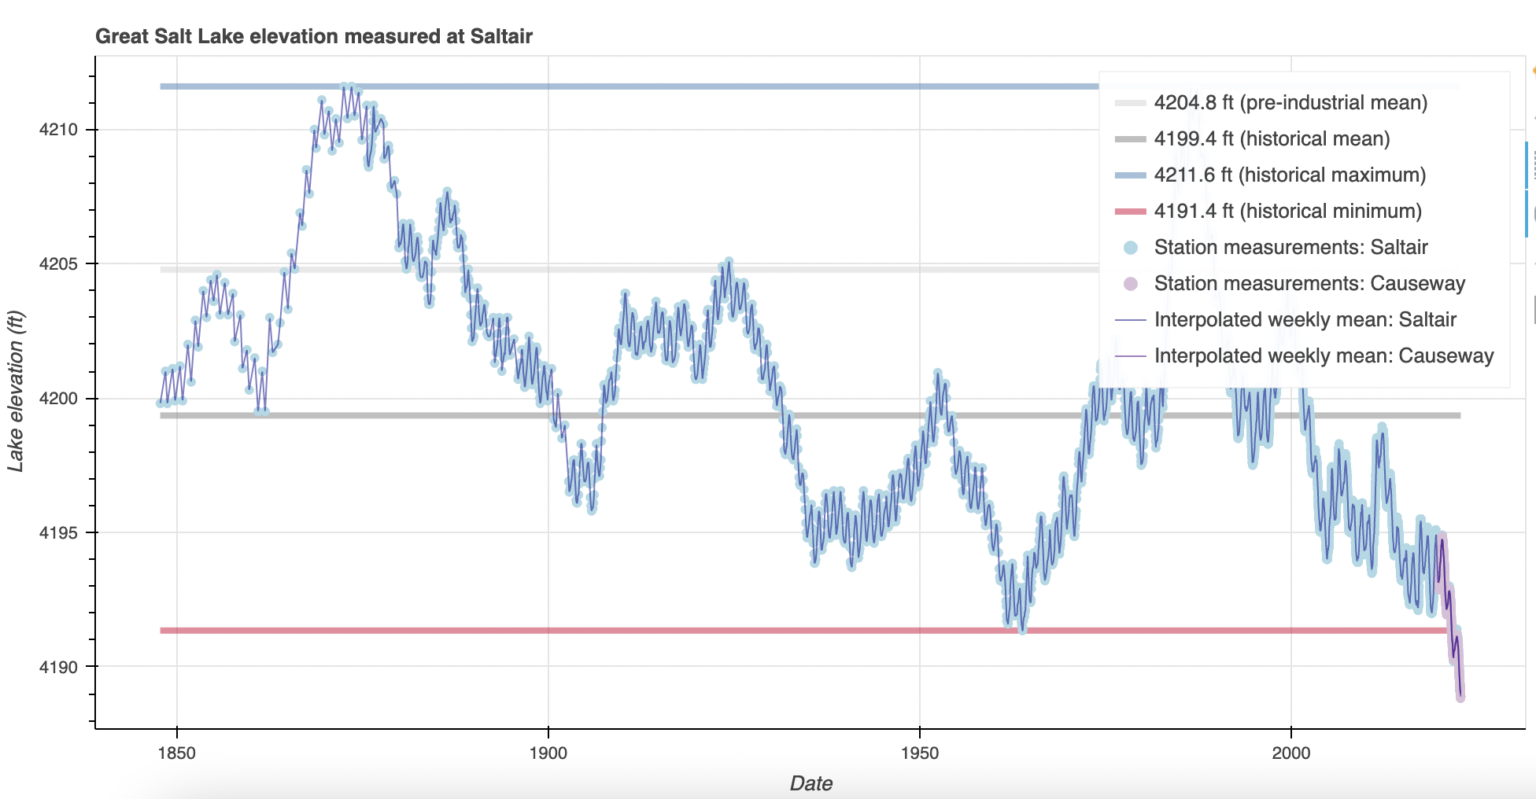
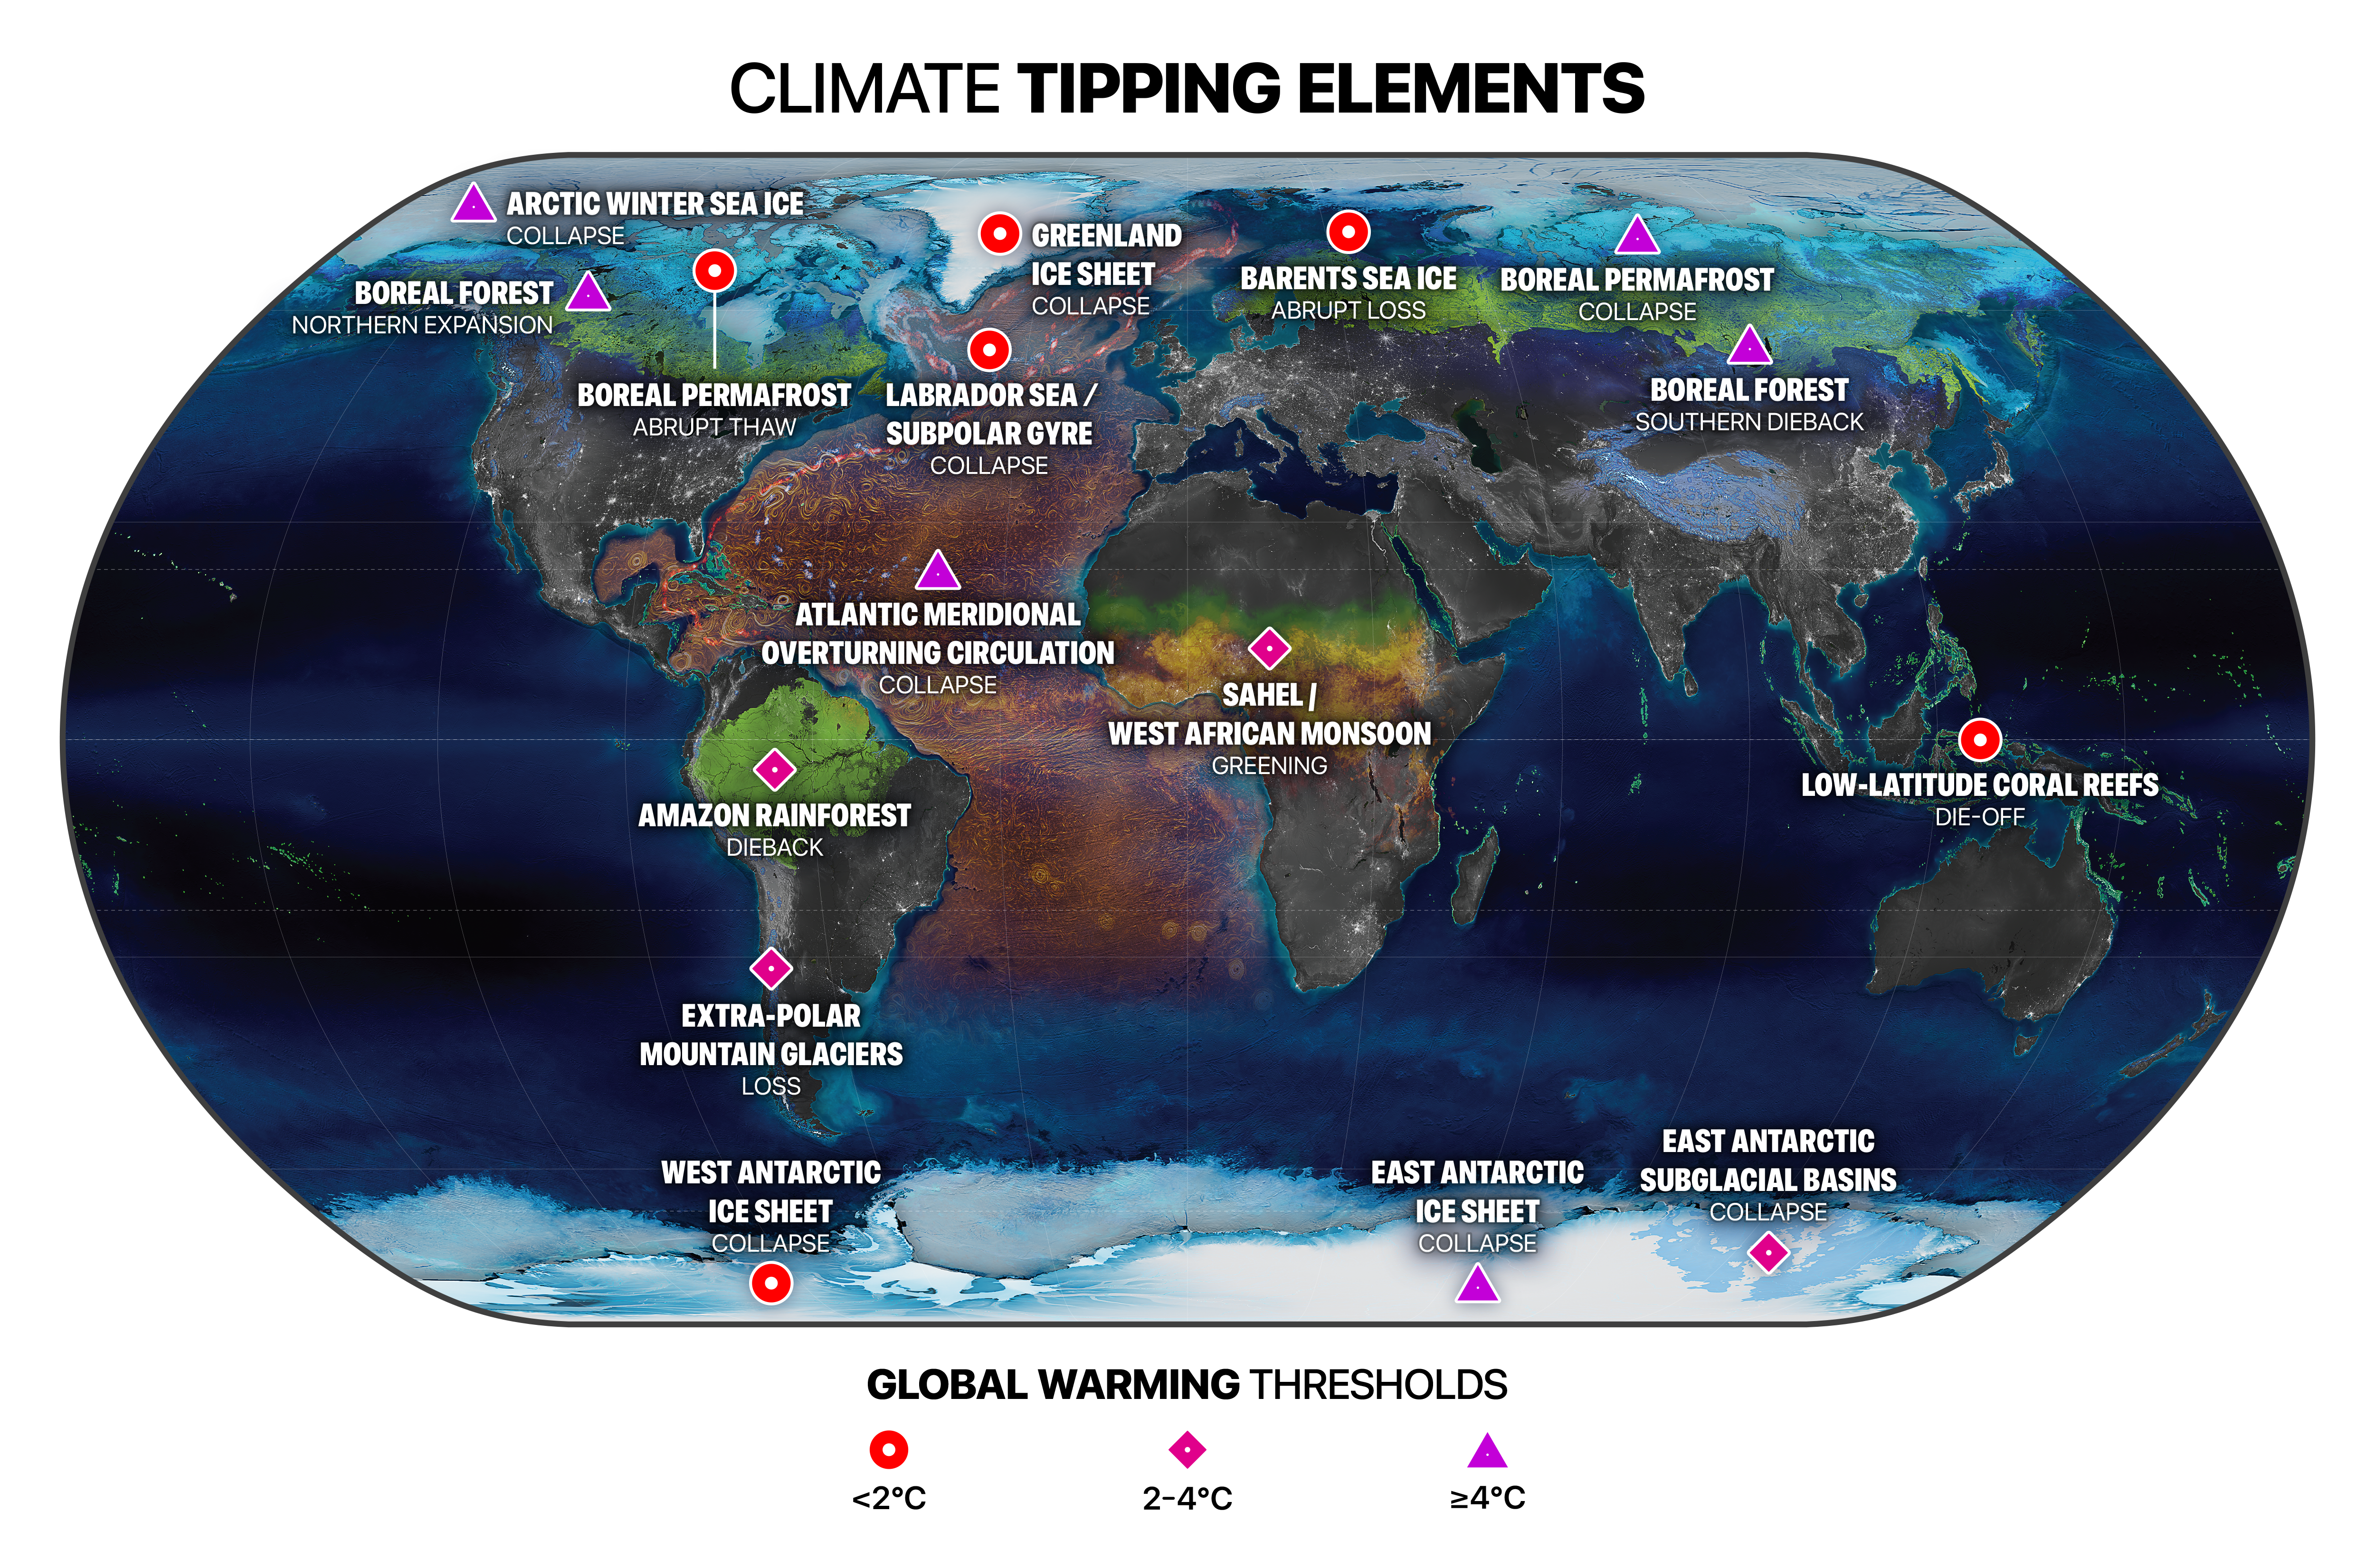
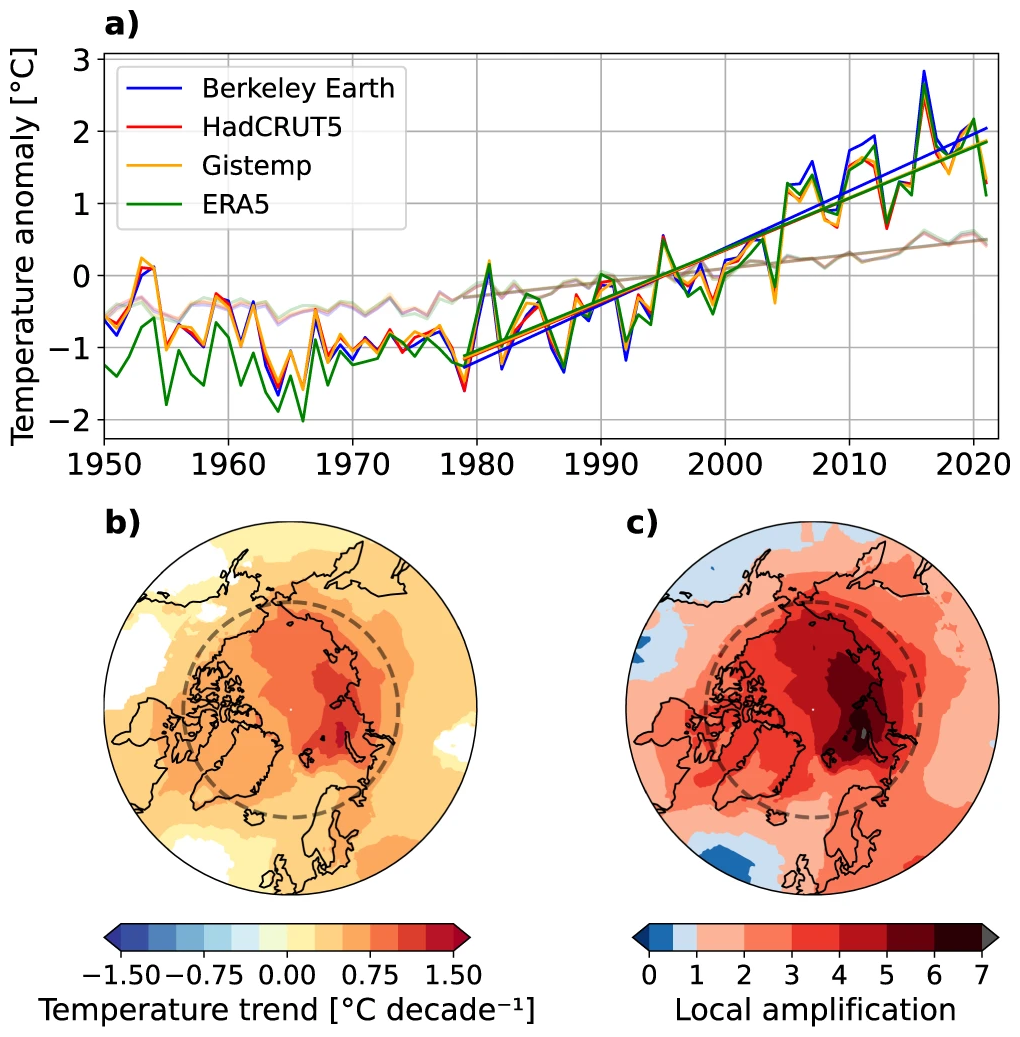
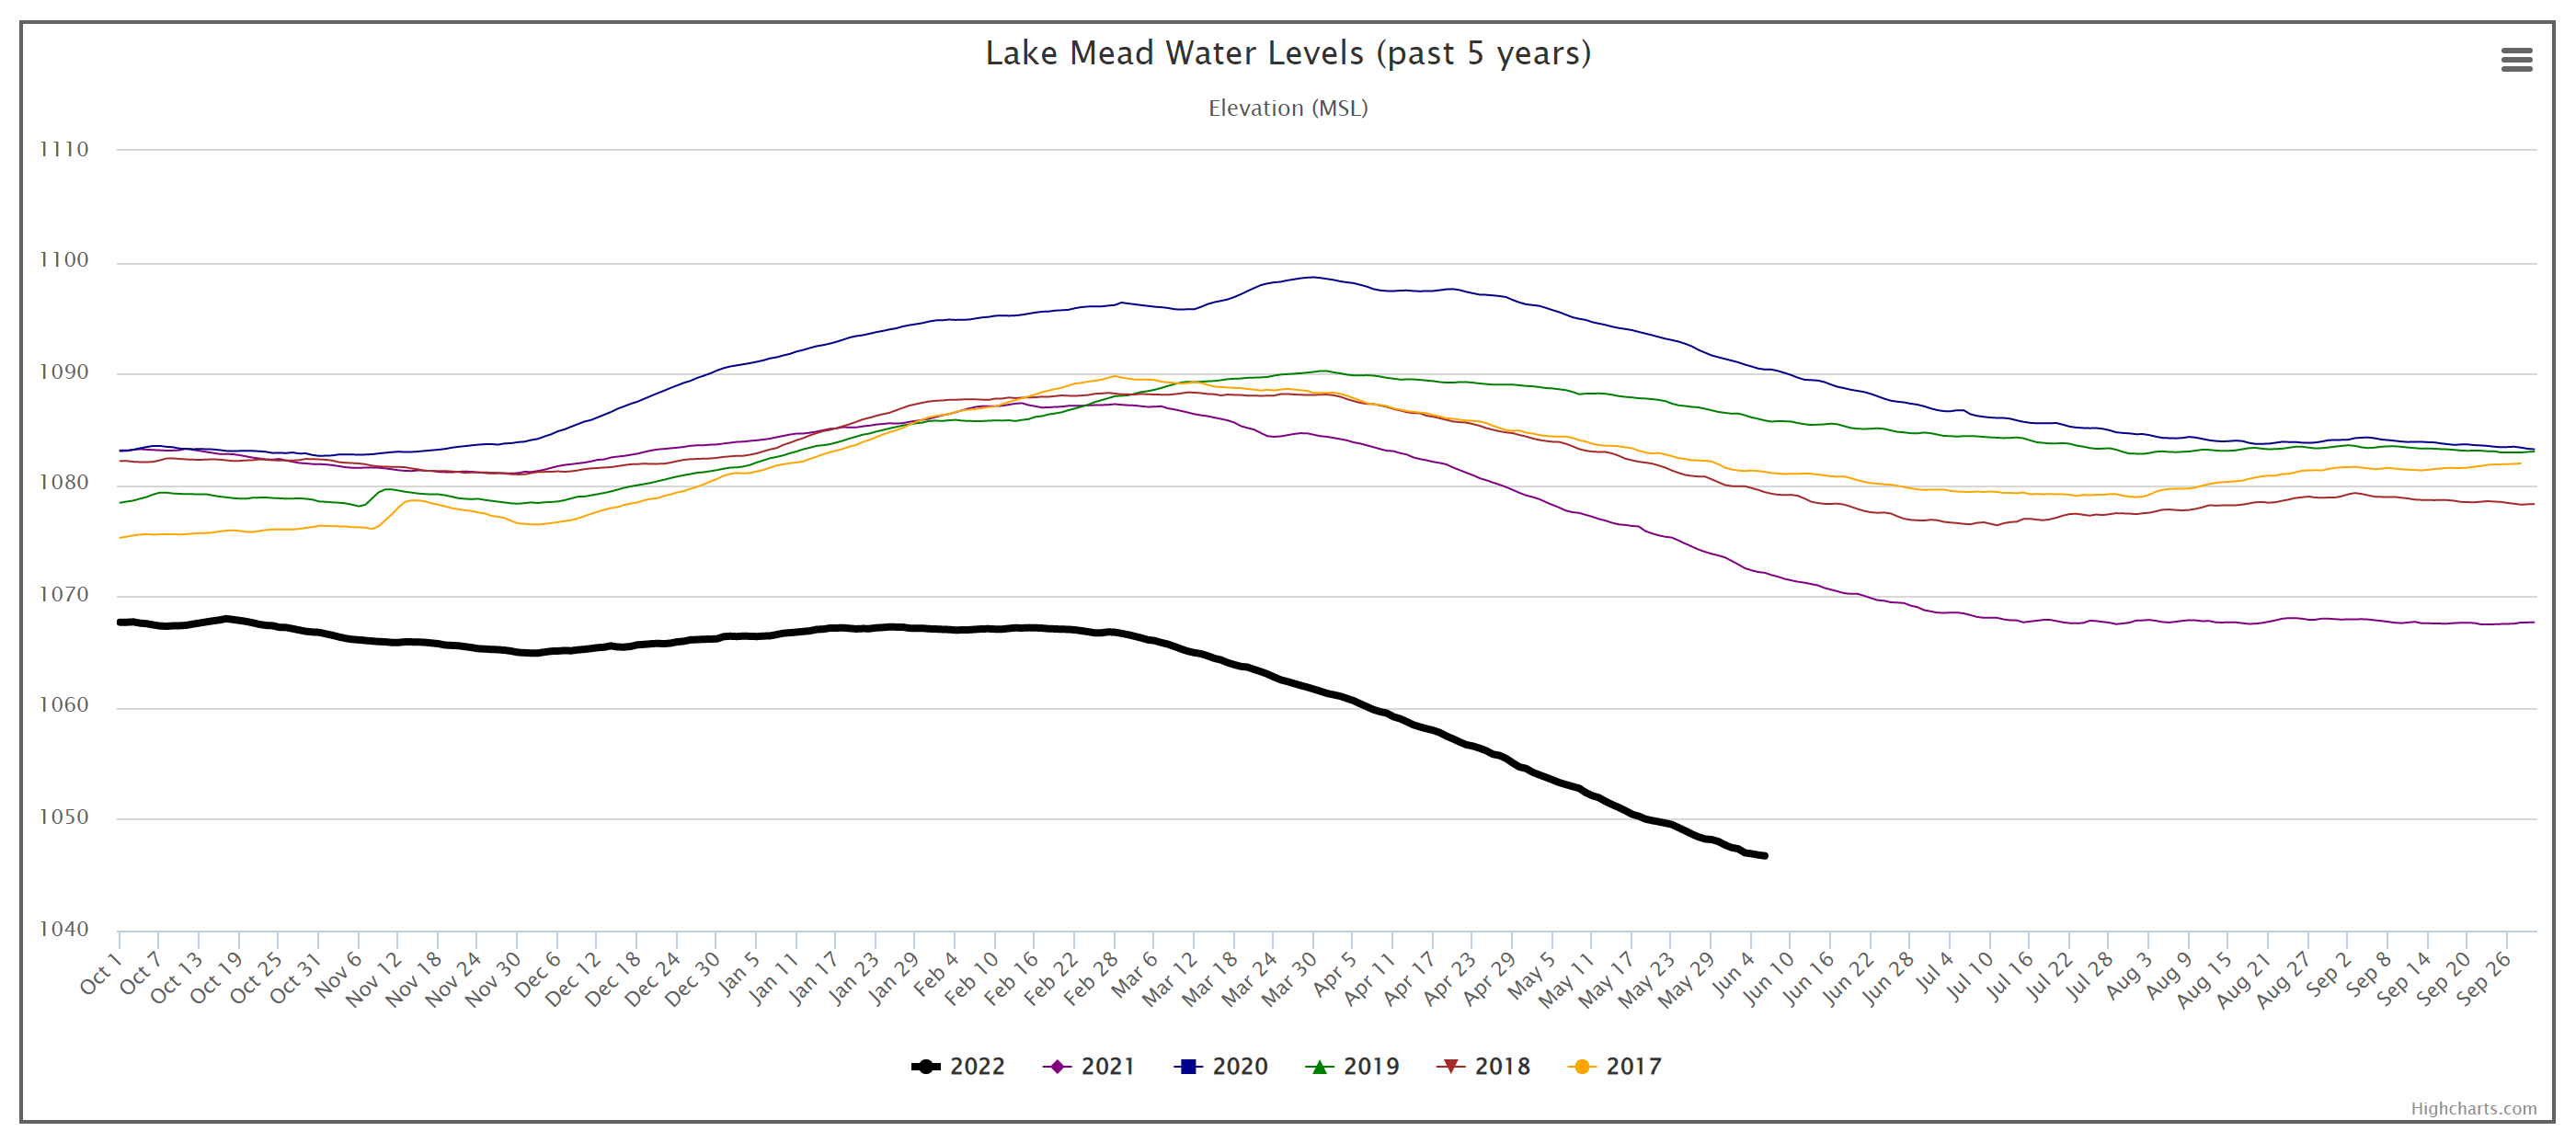
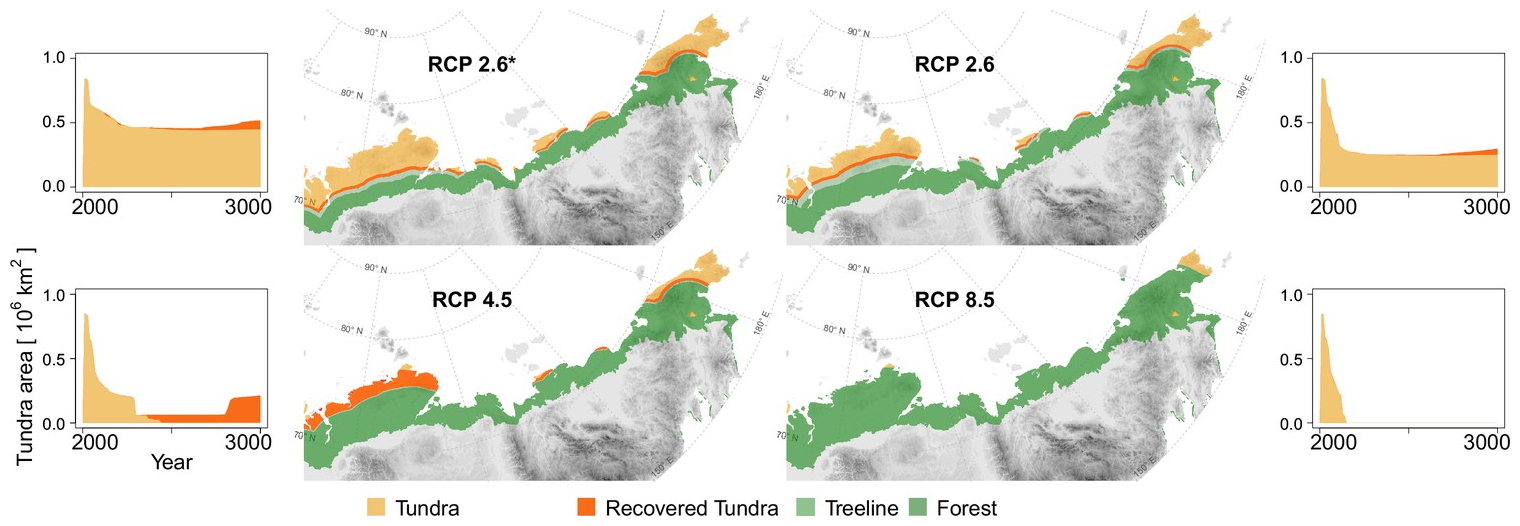
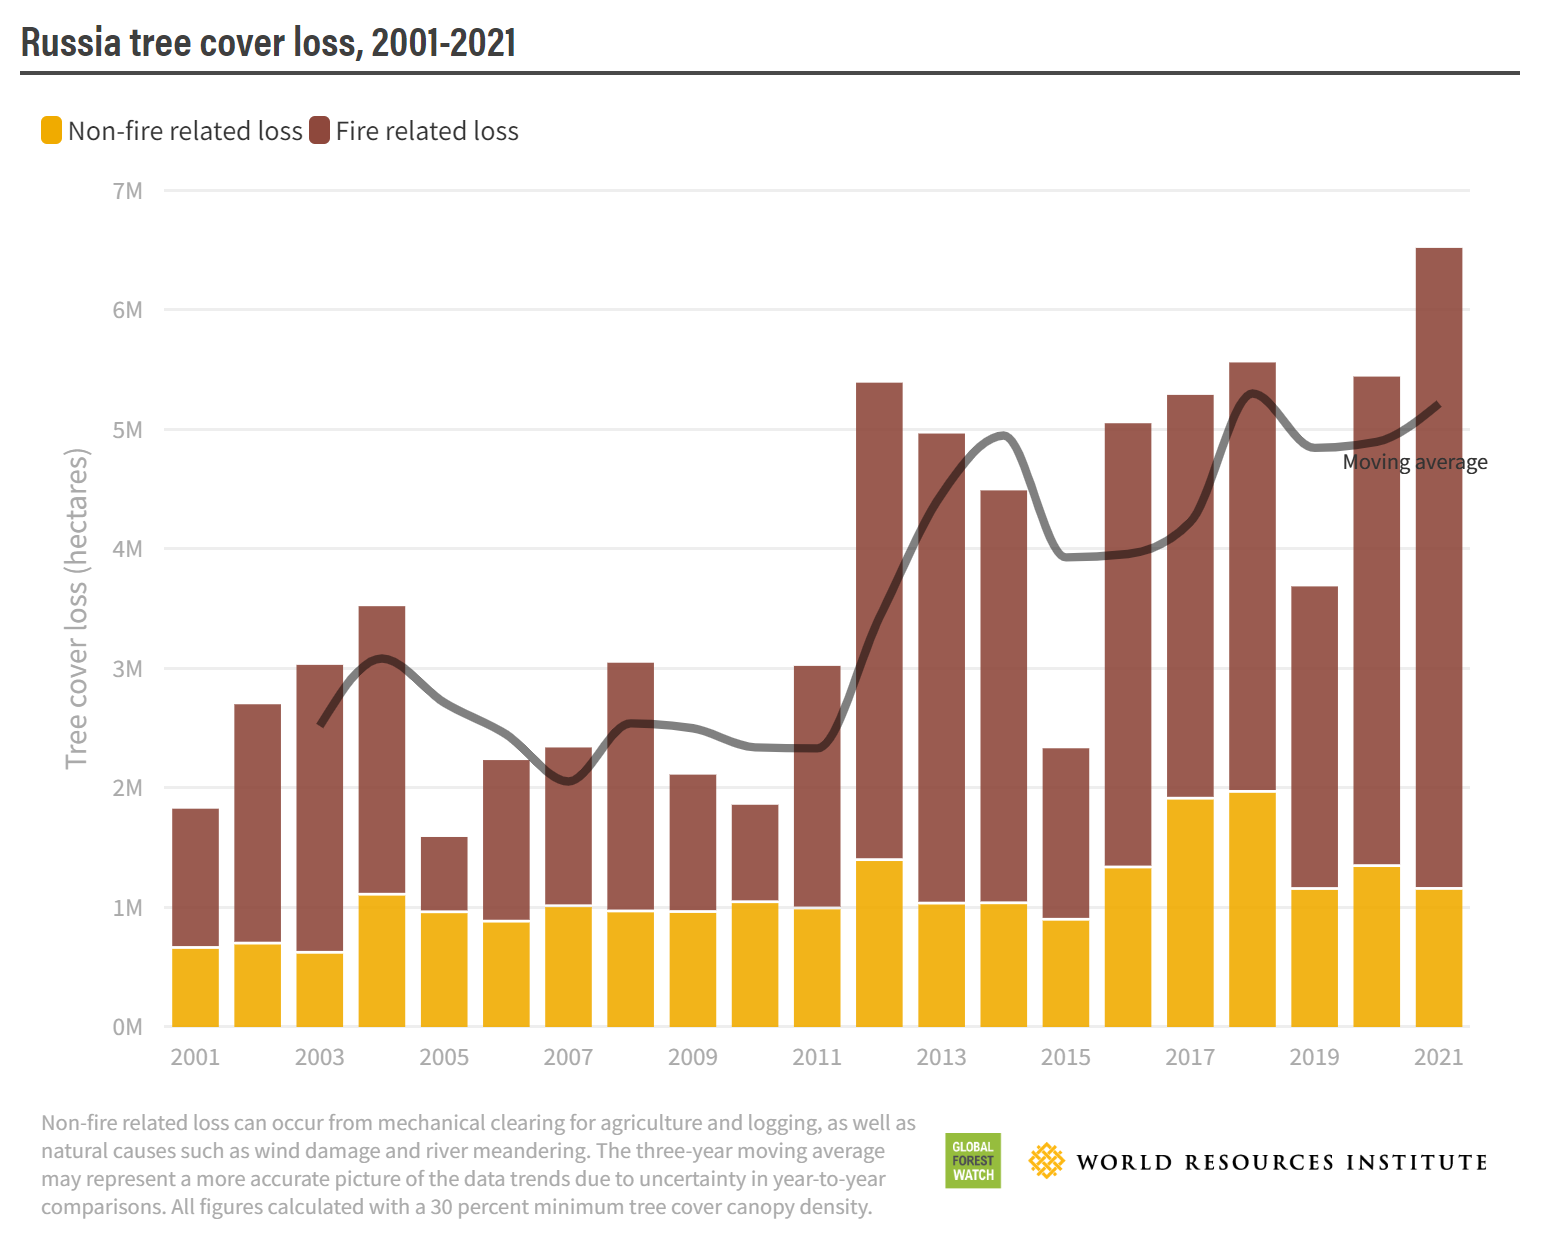
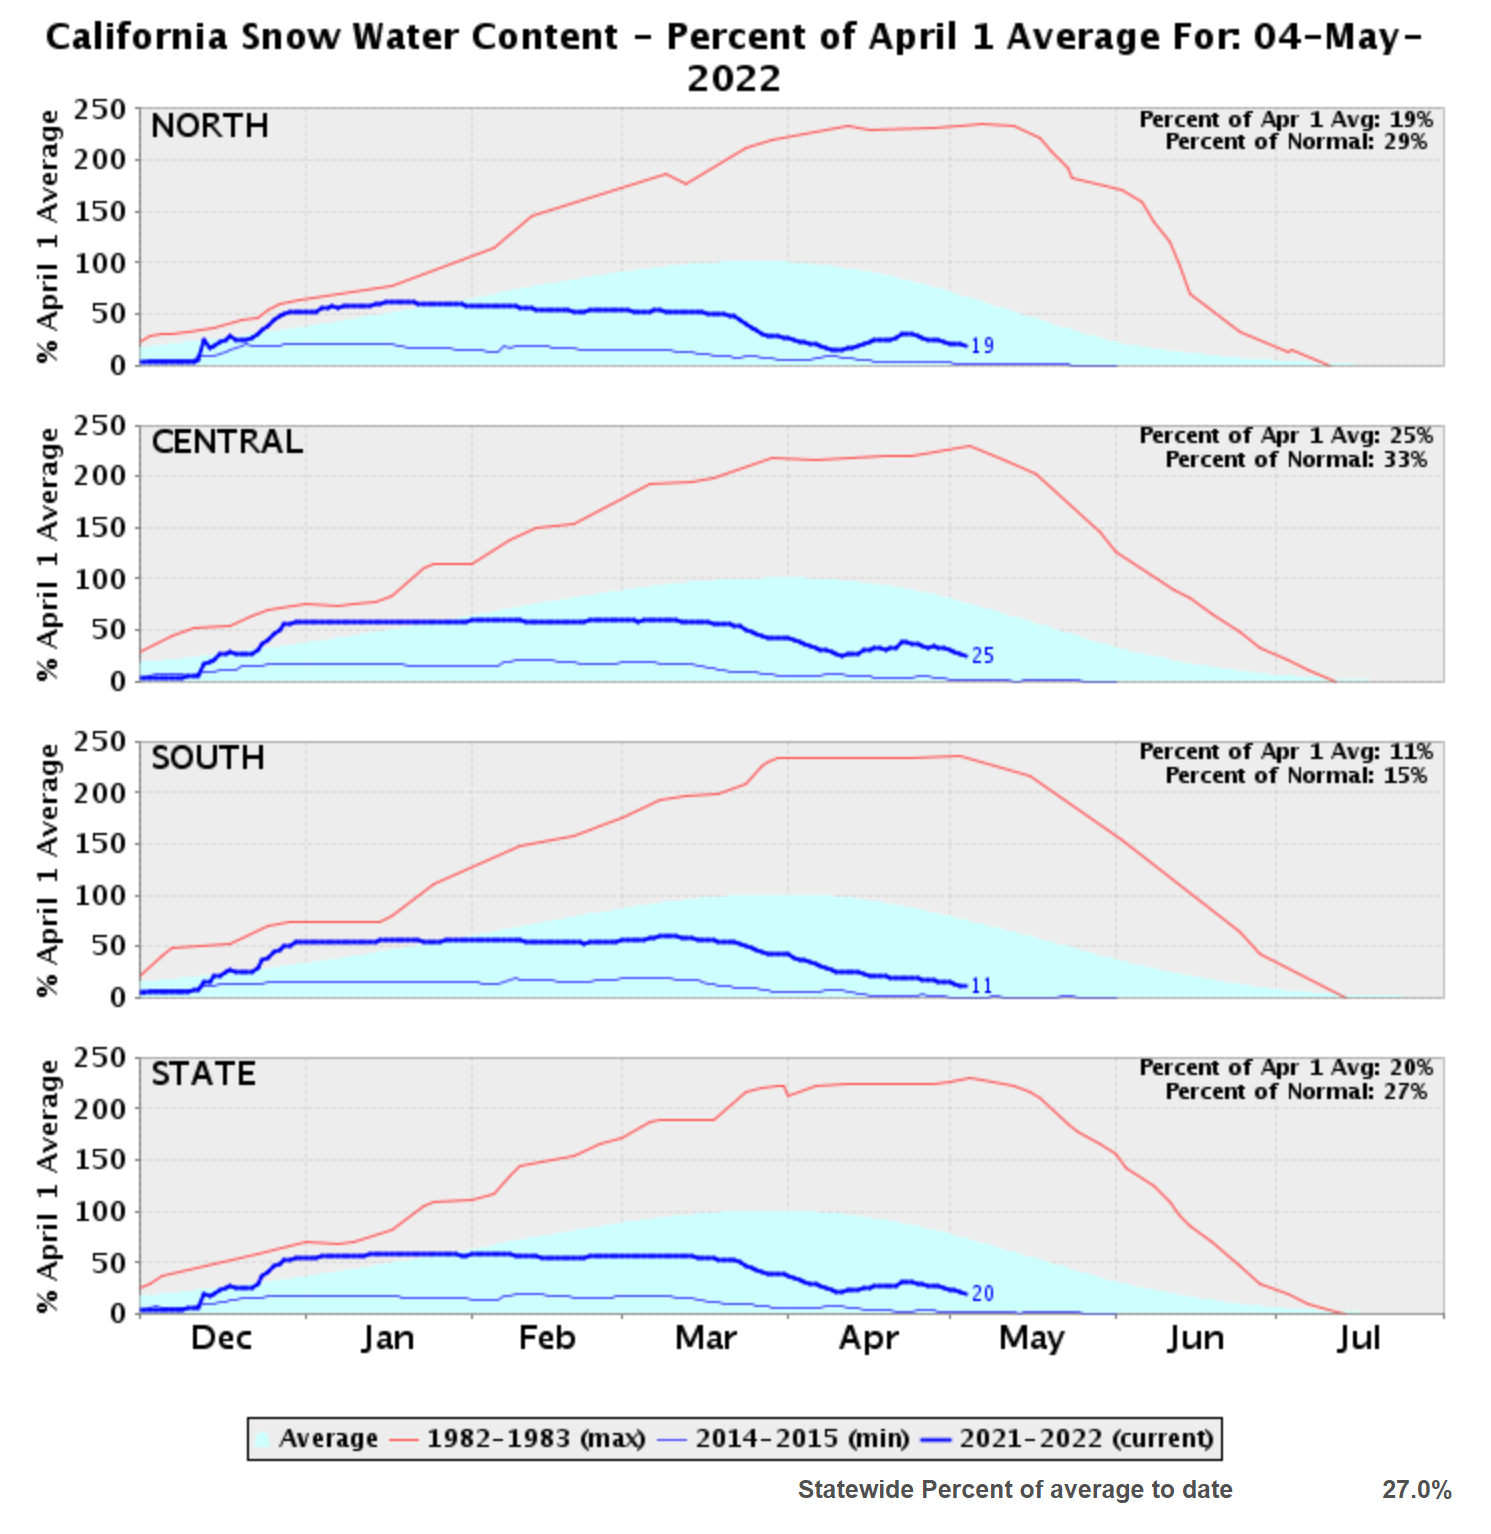
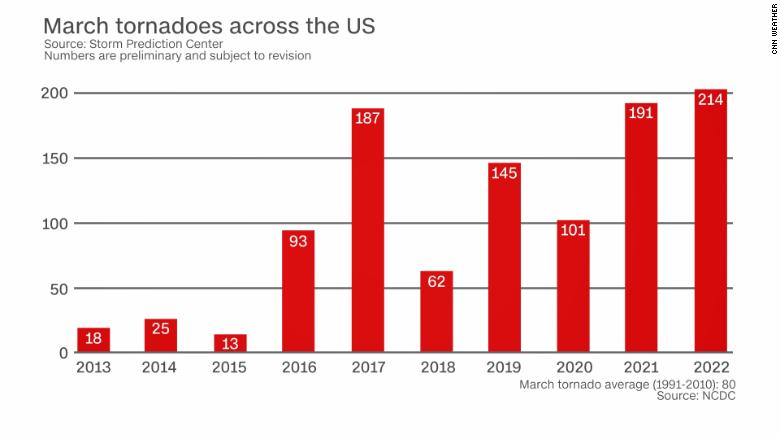
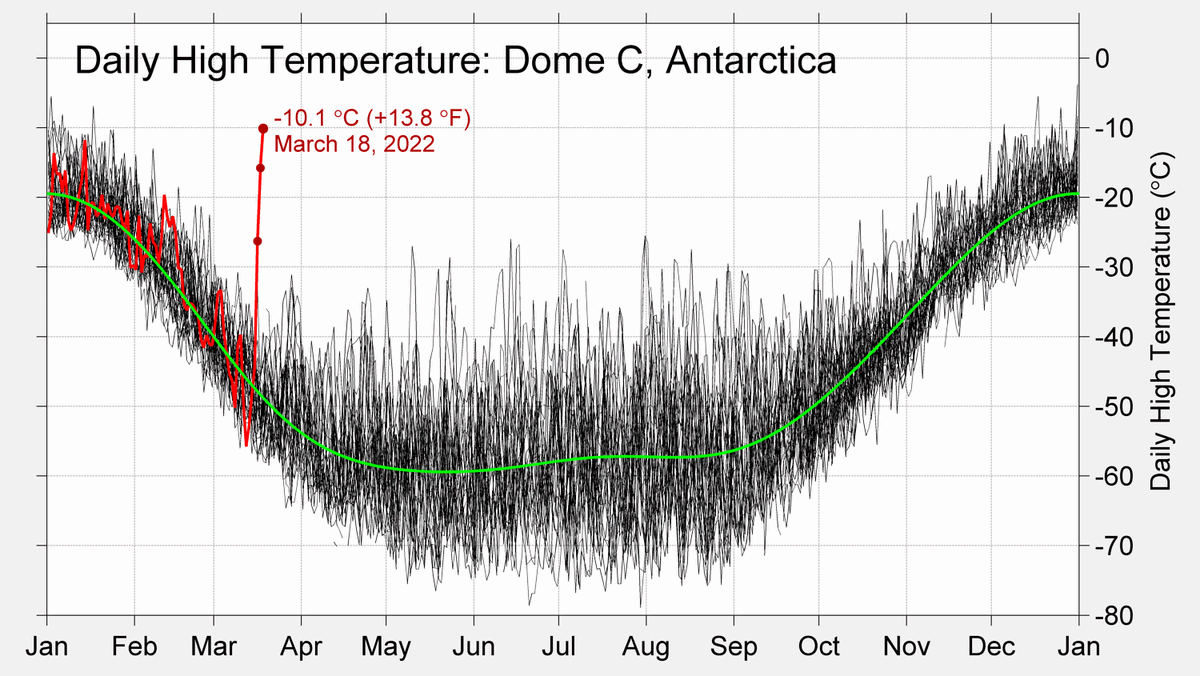
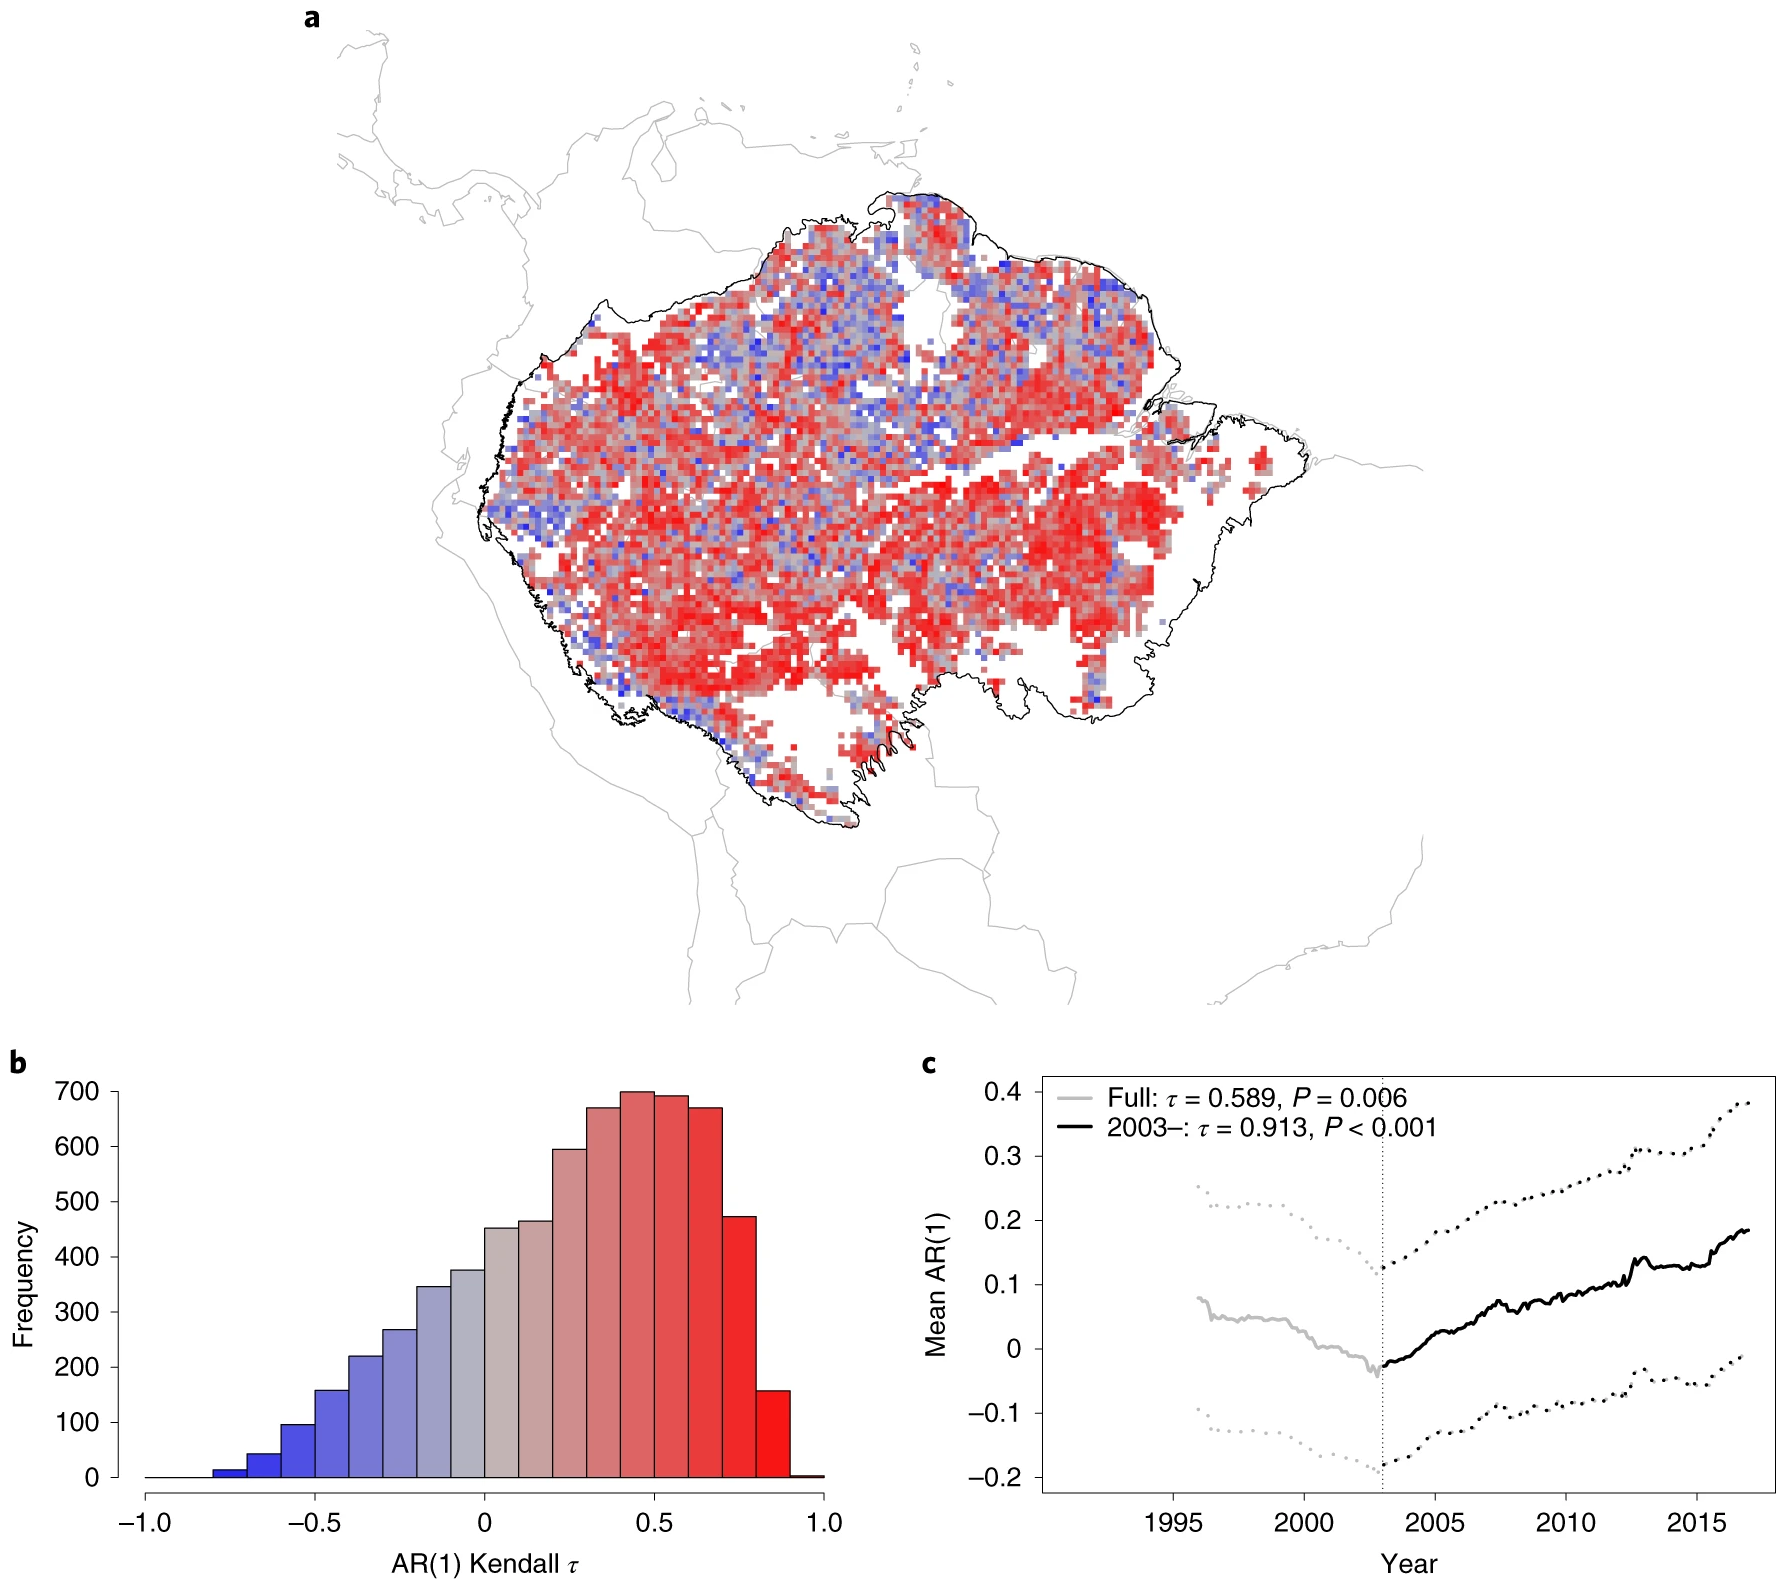
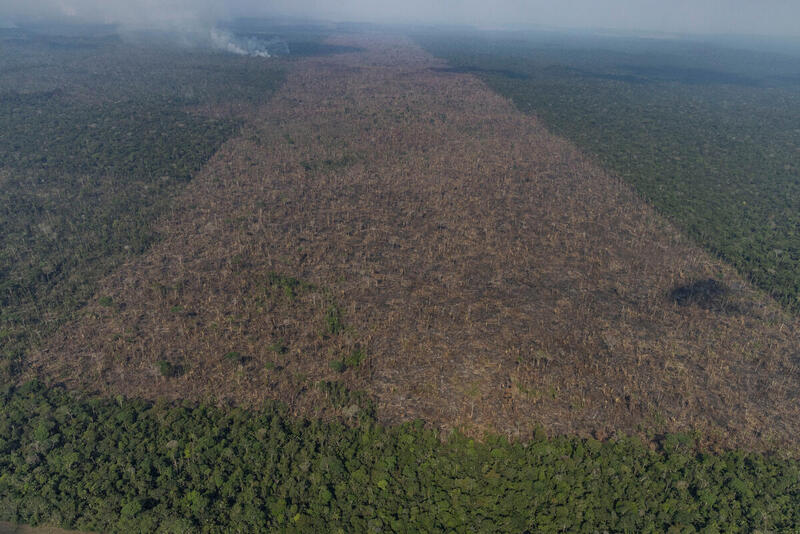
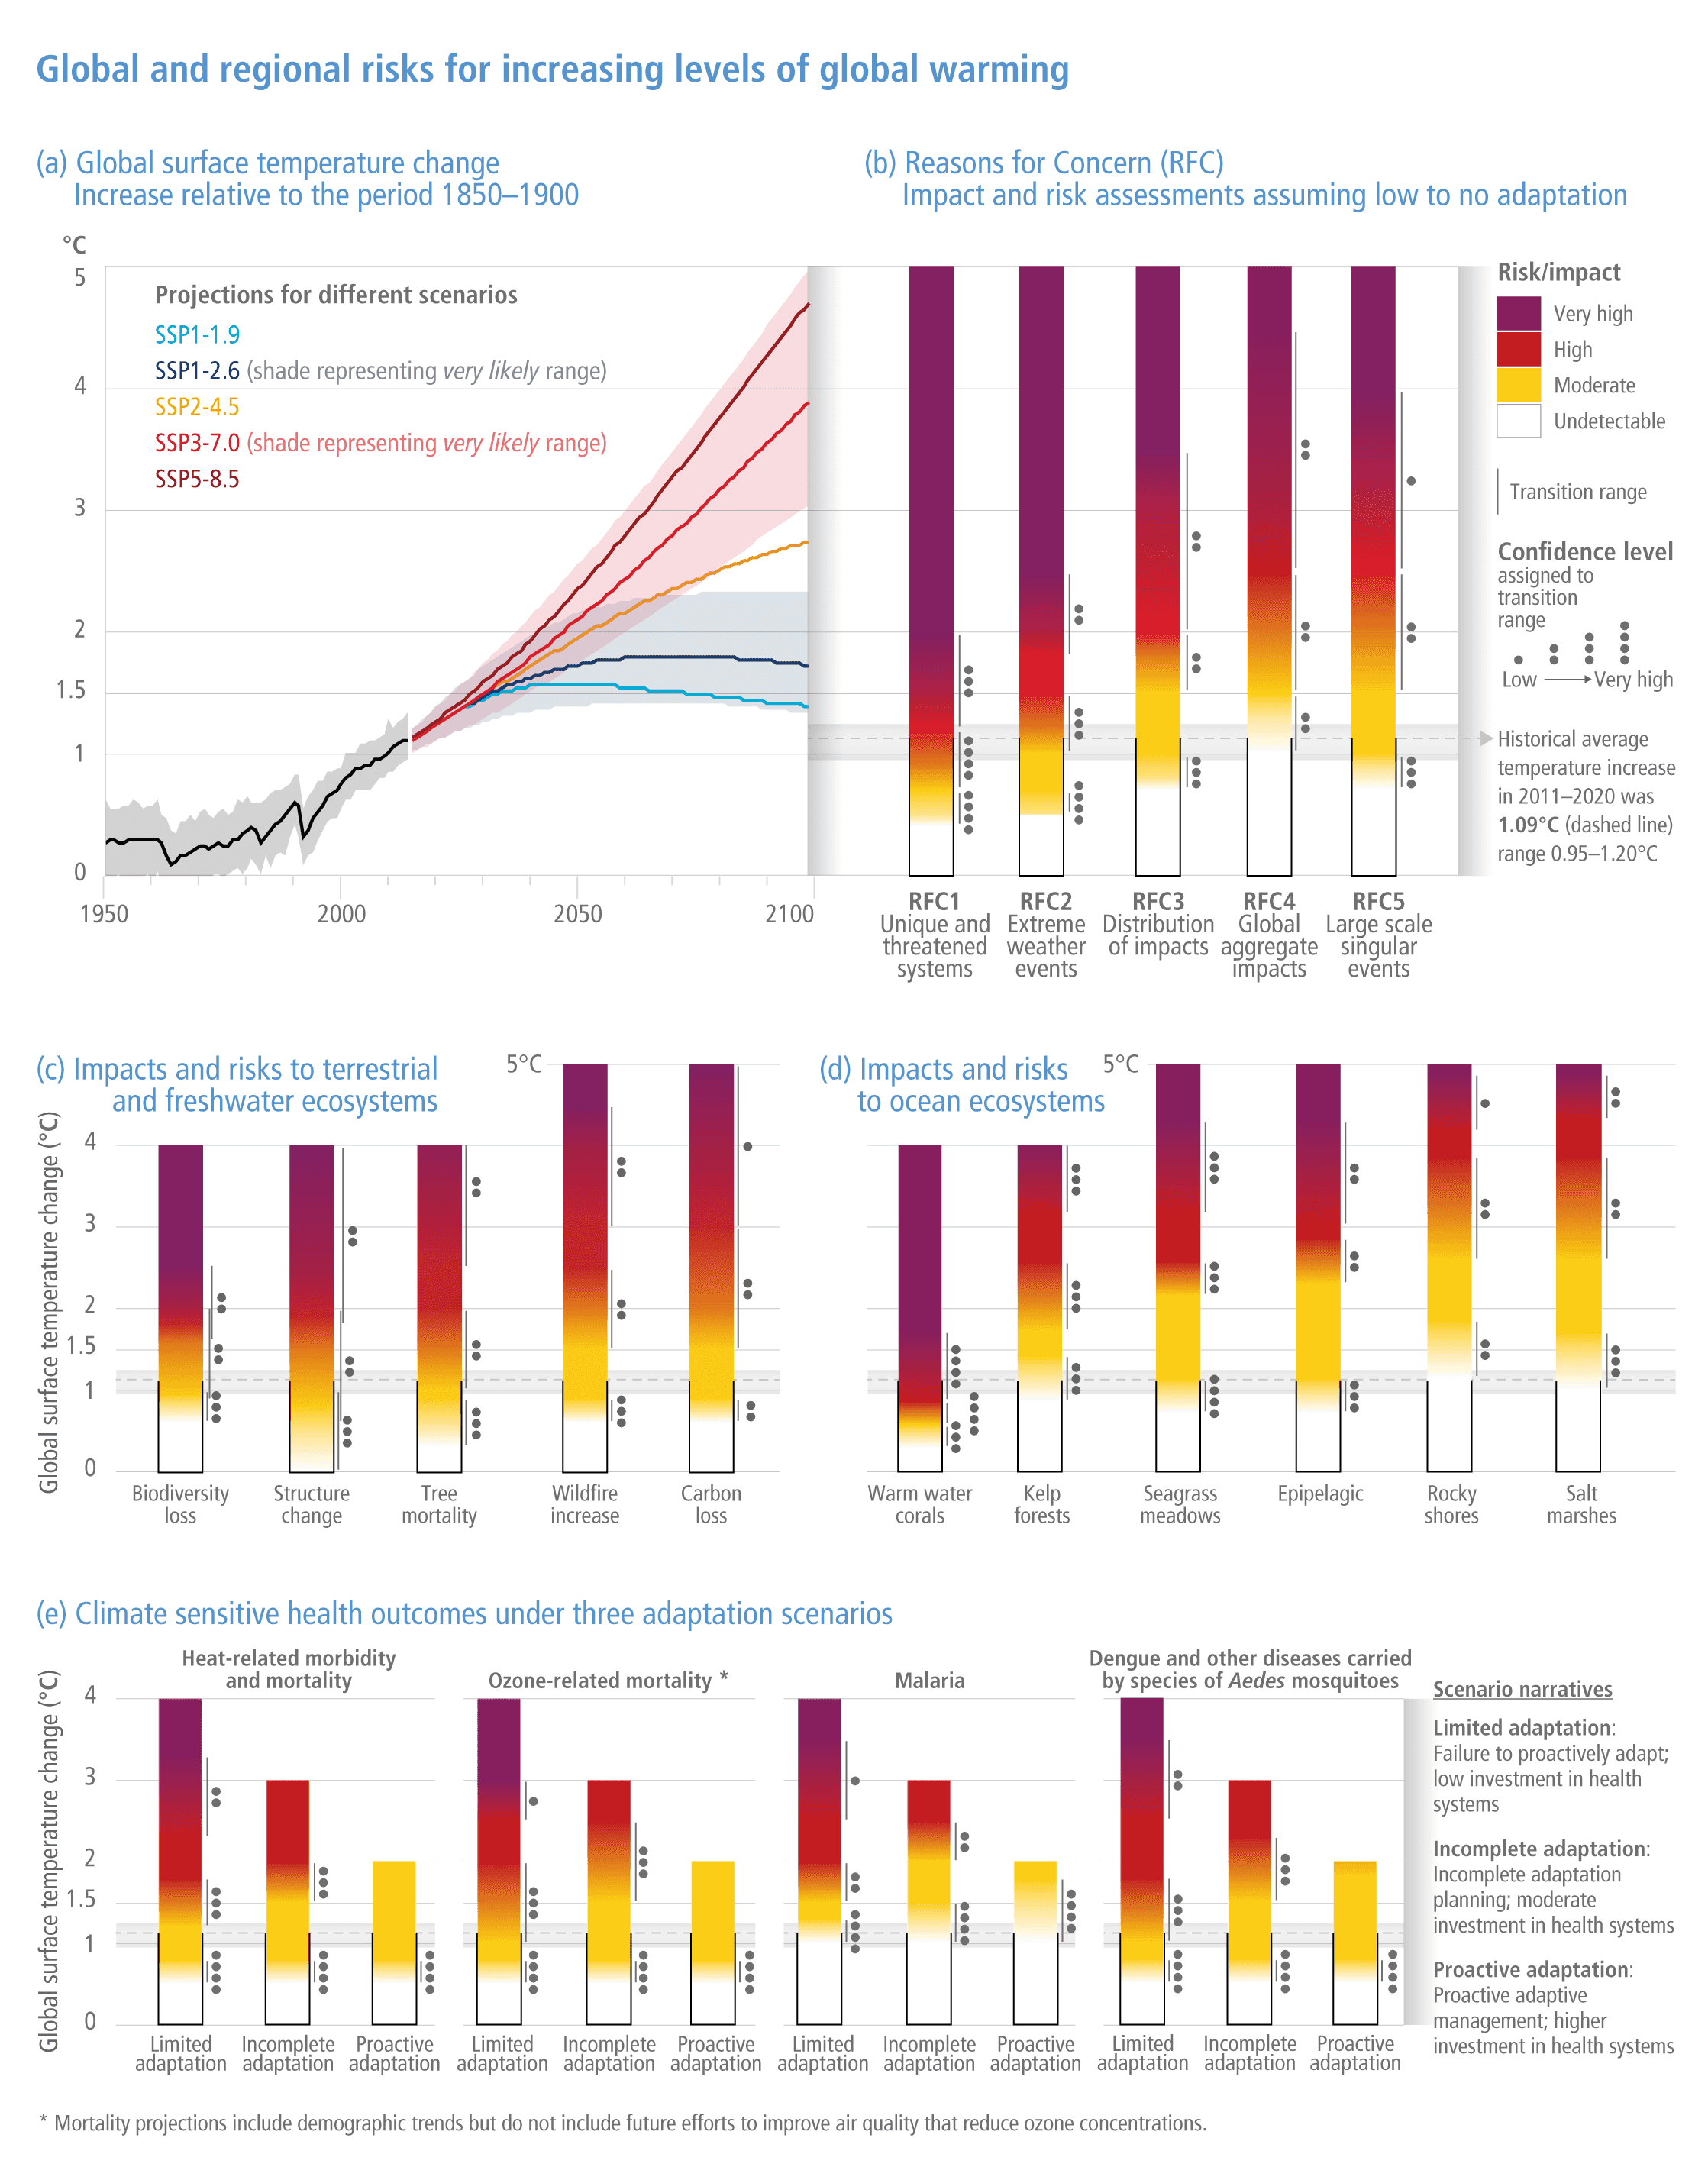
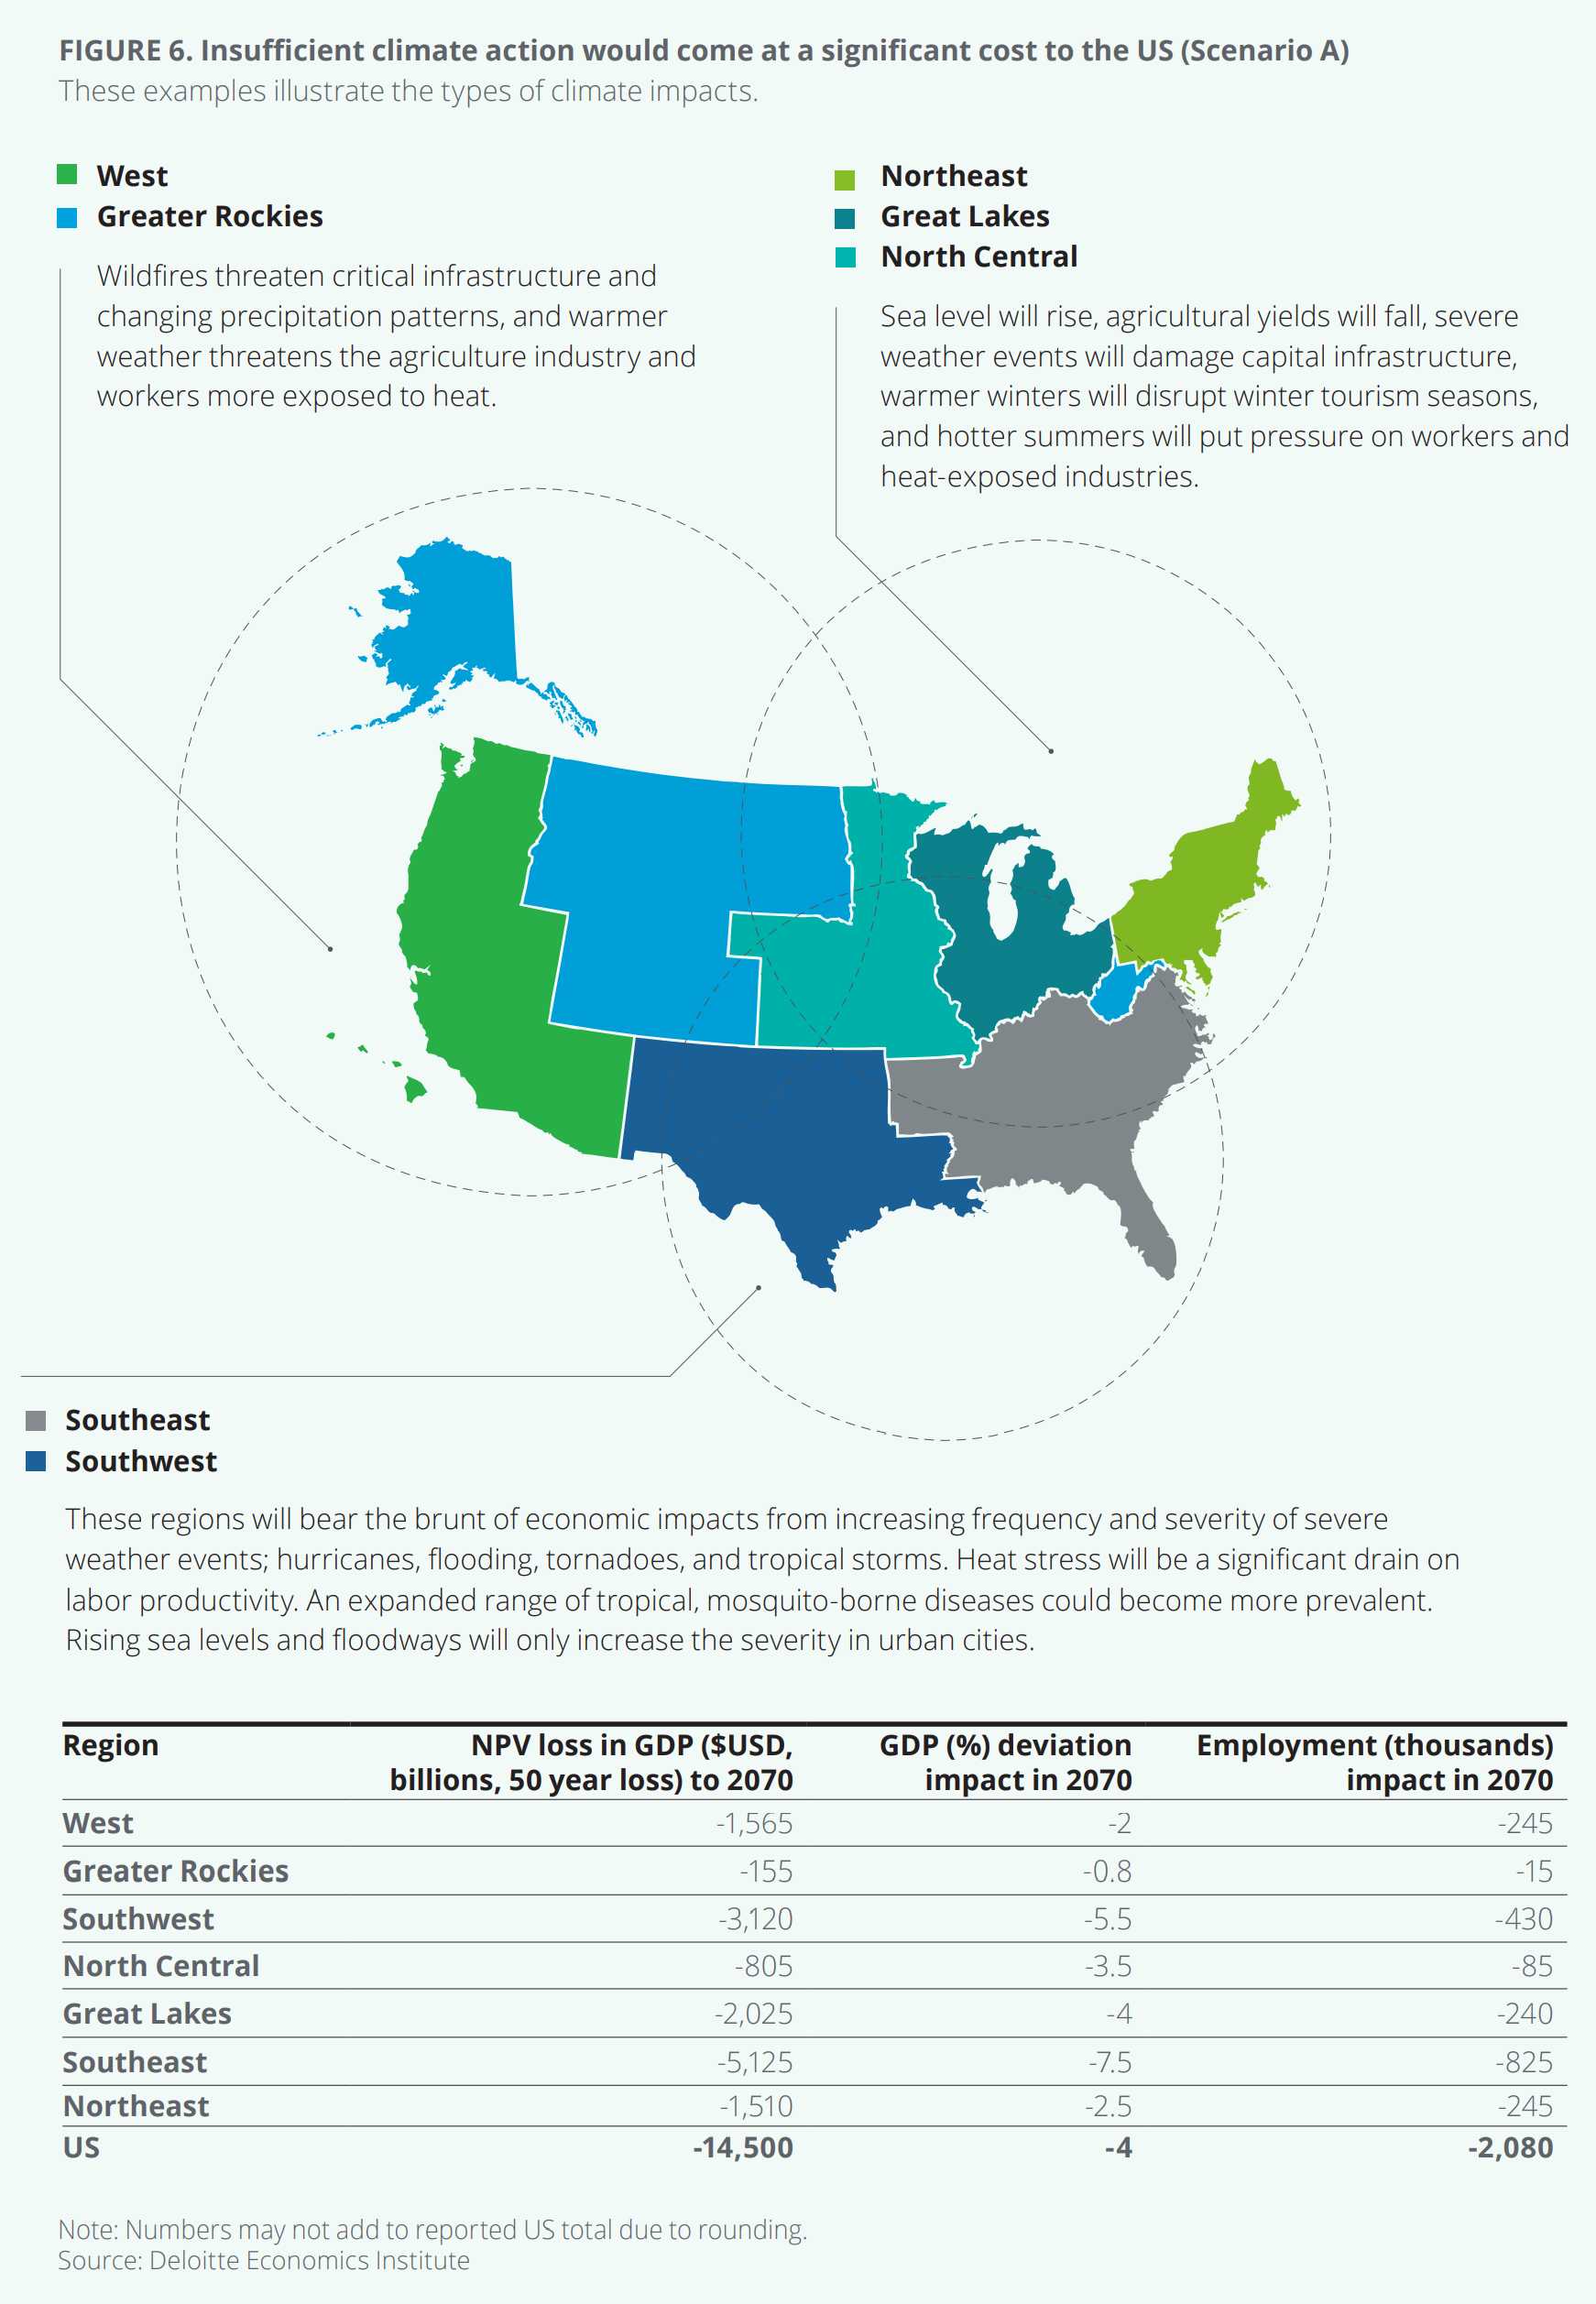
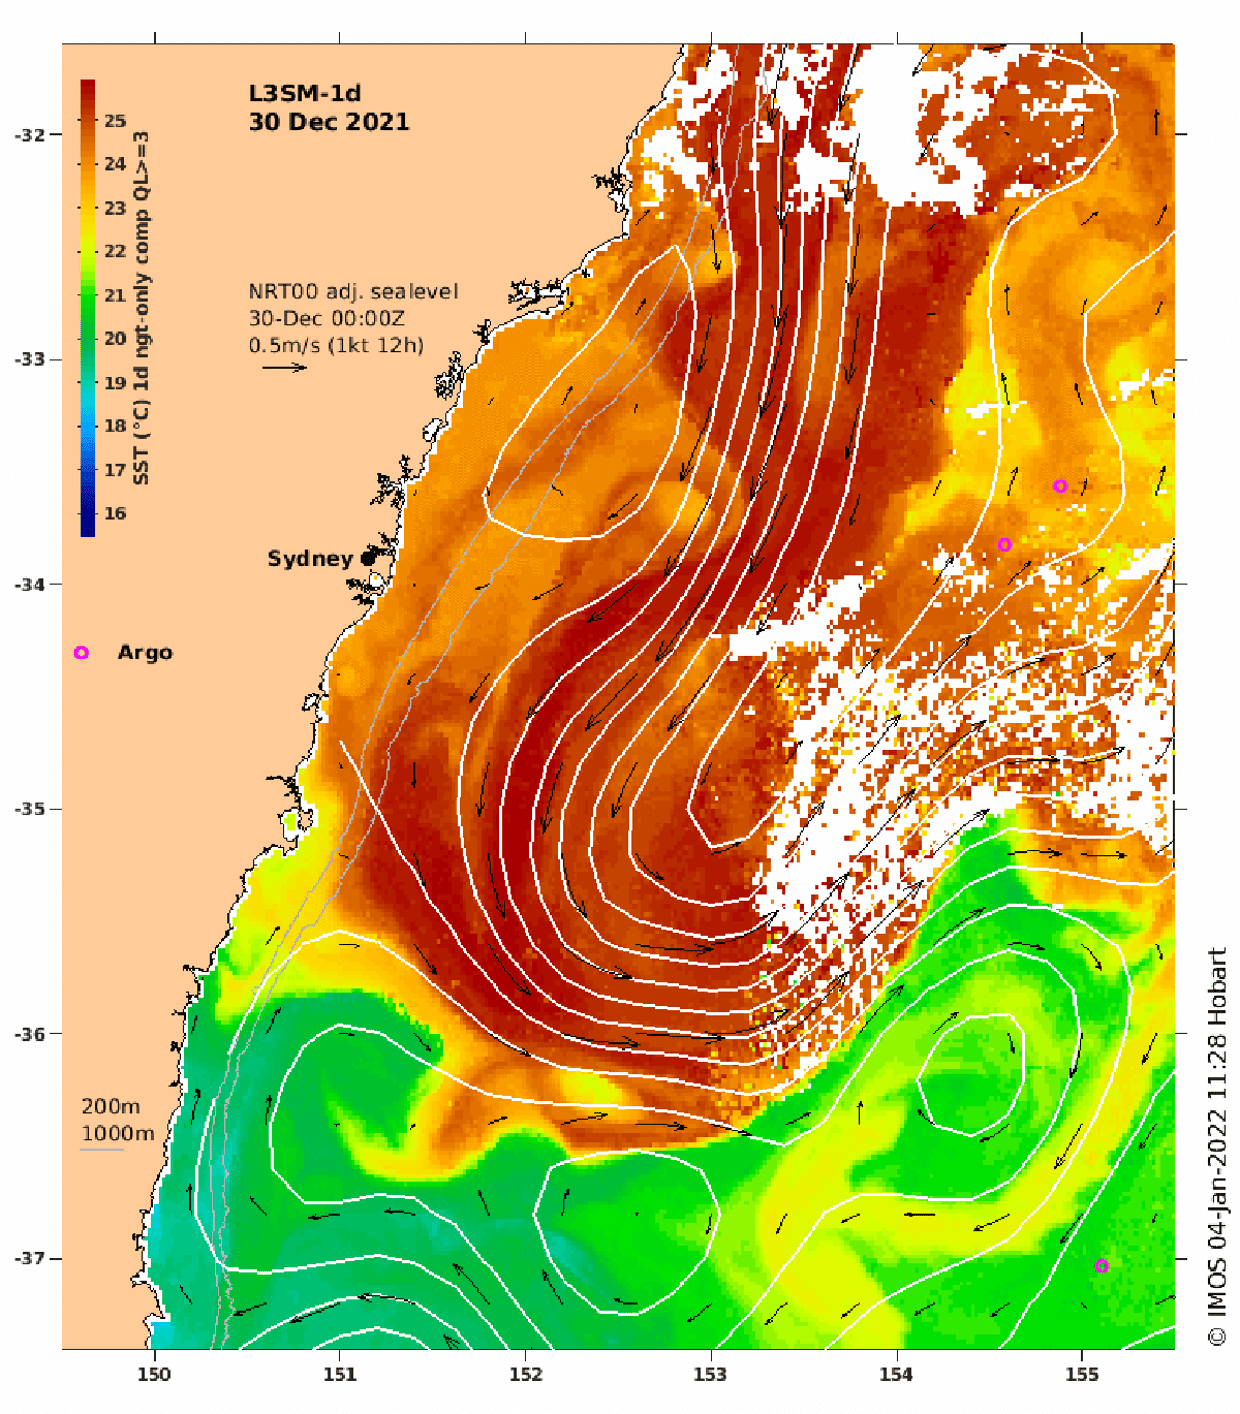
Abrupt climate change
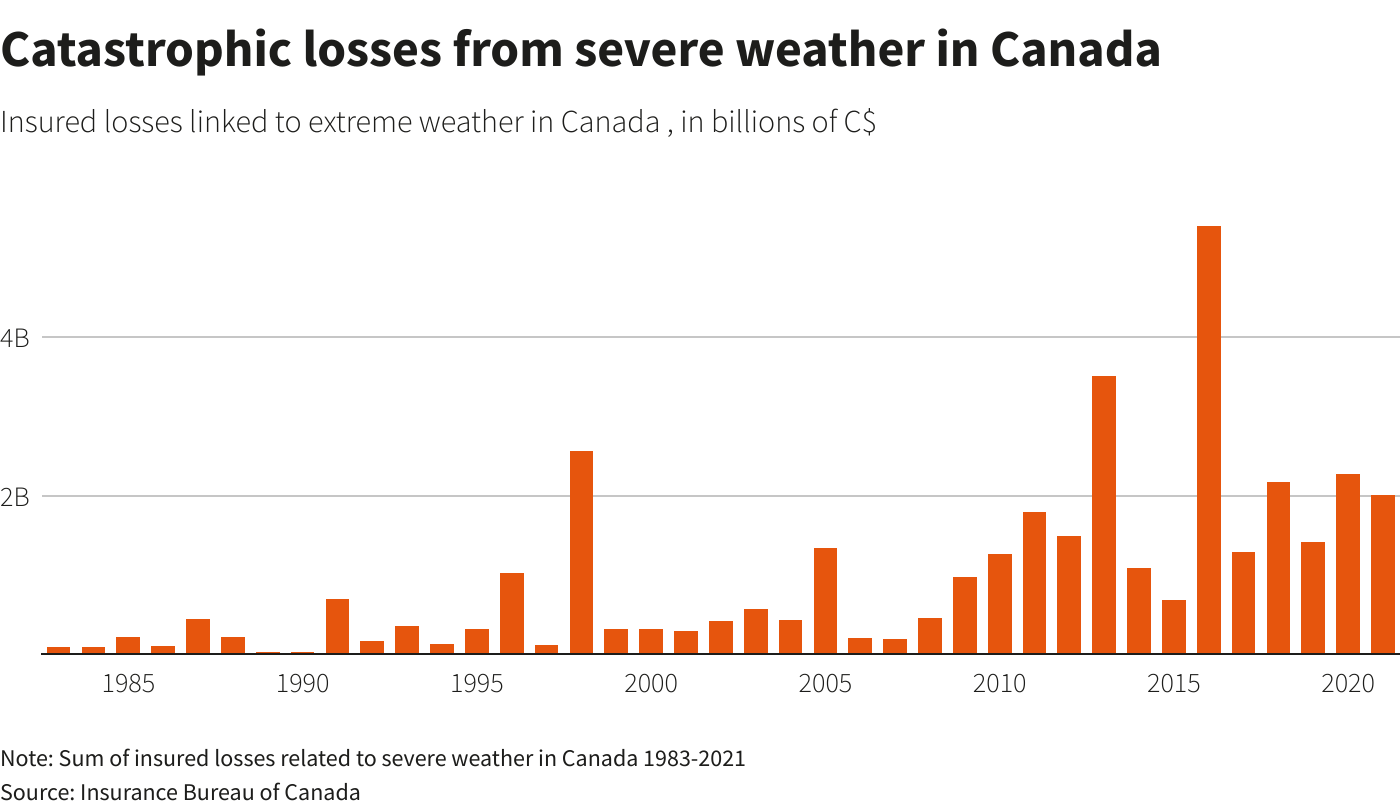
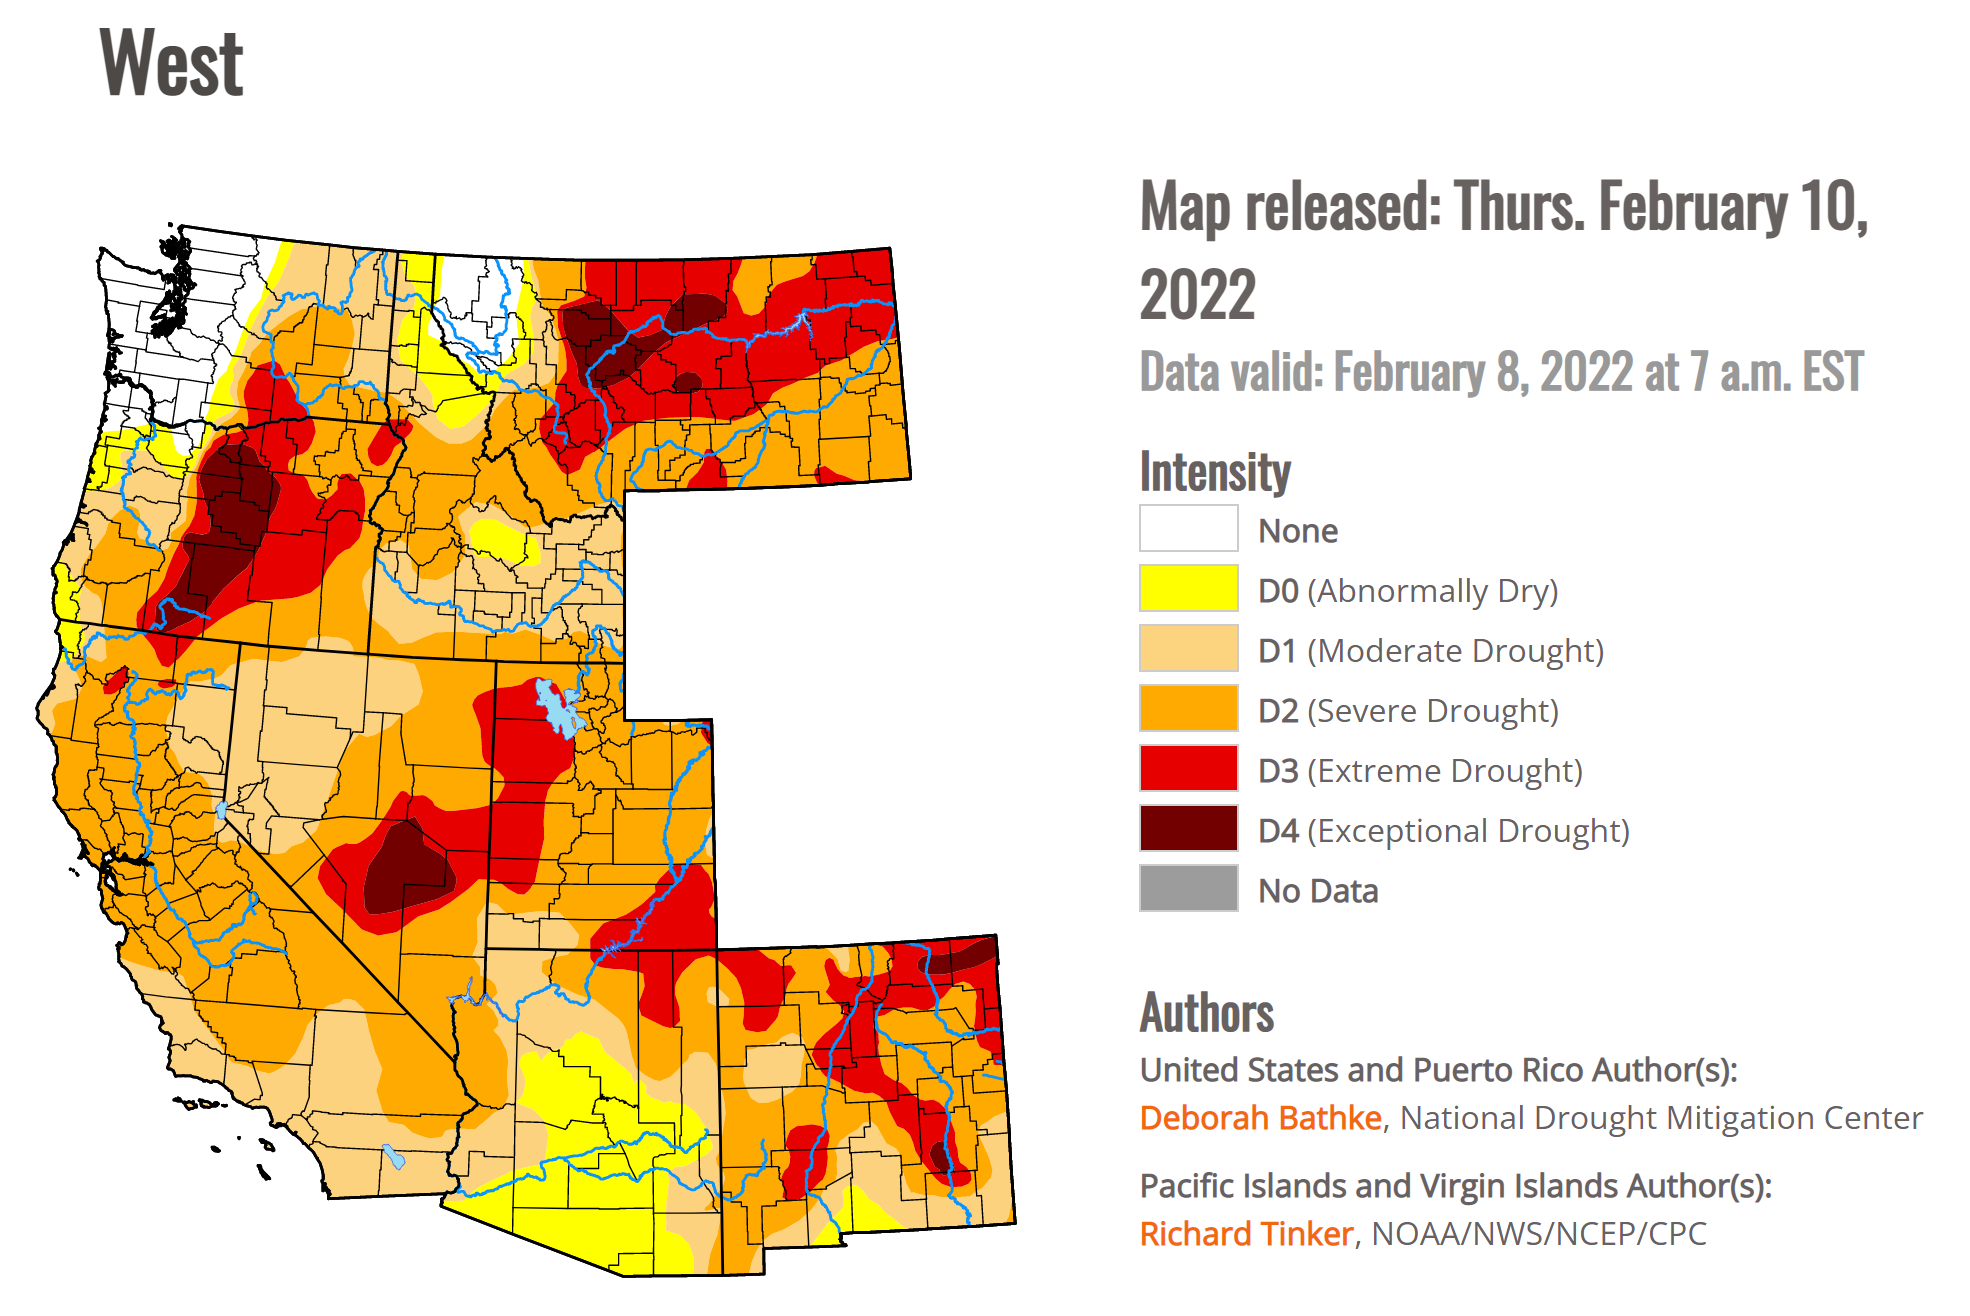
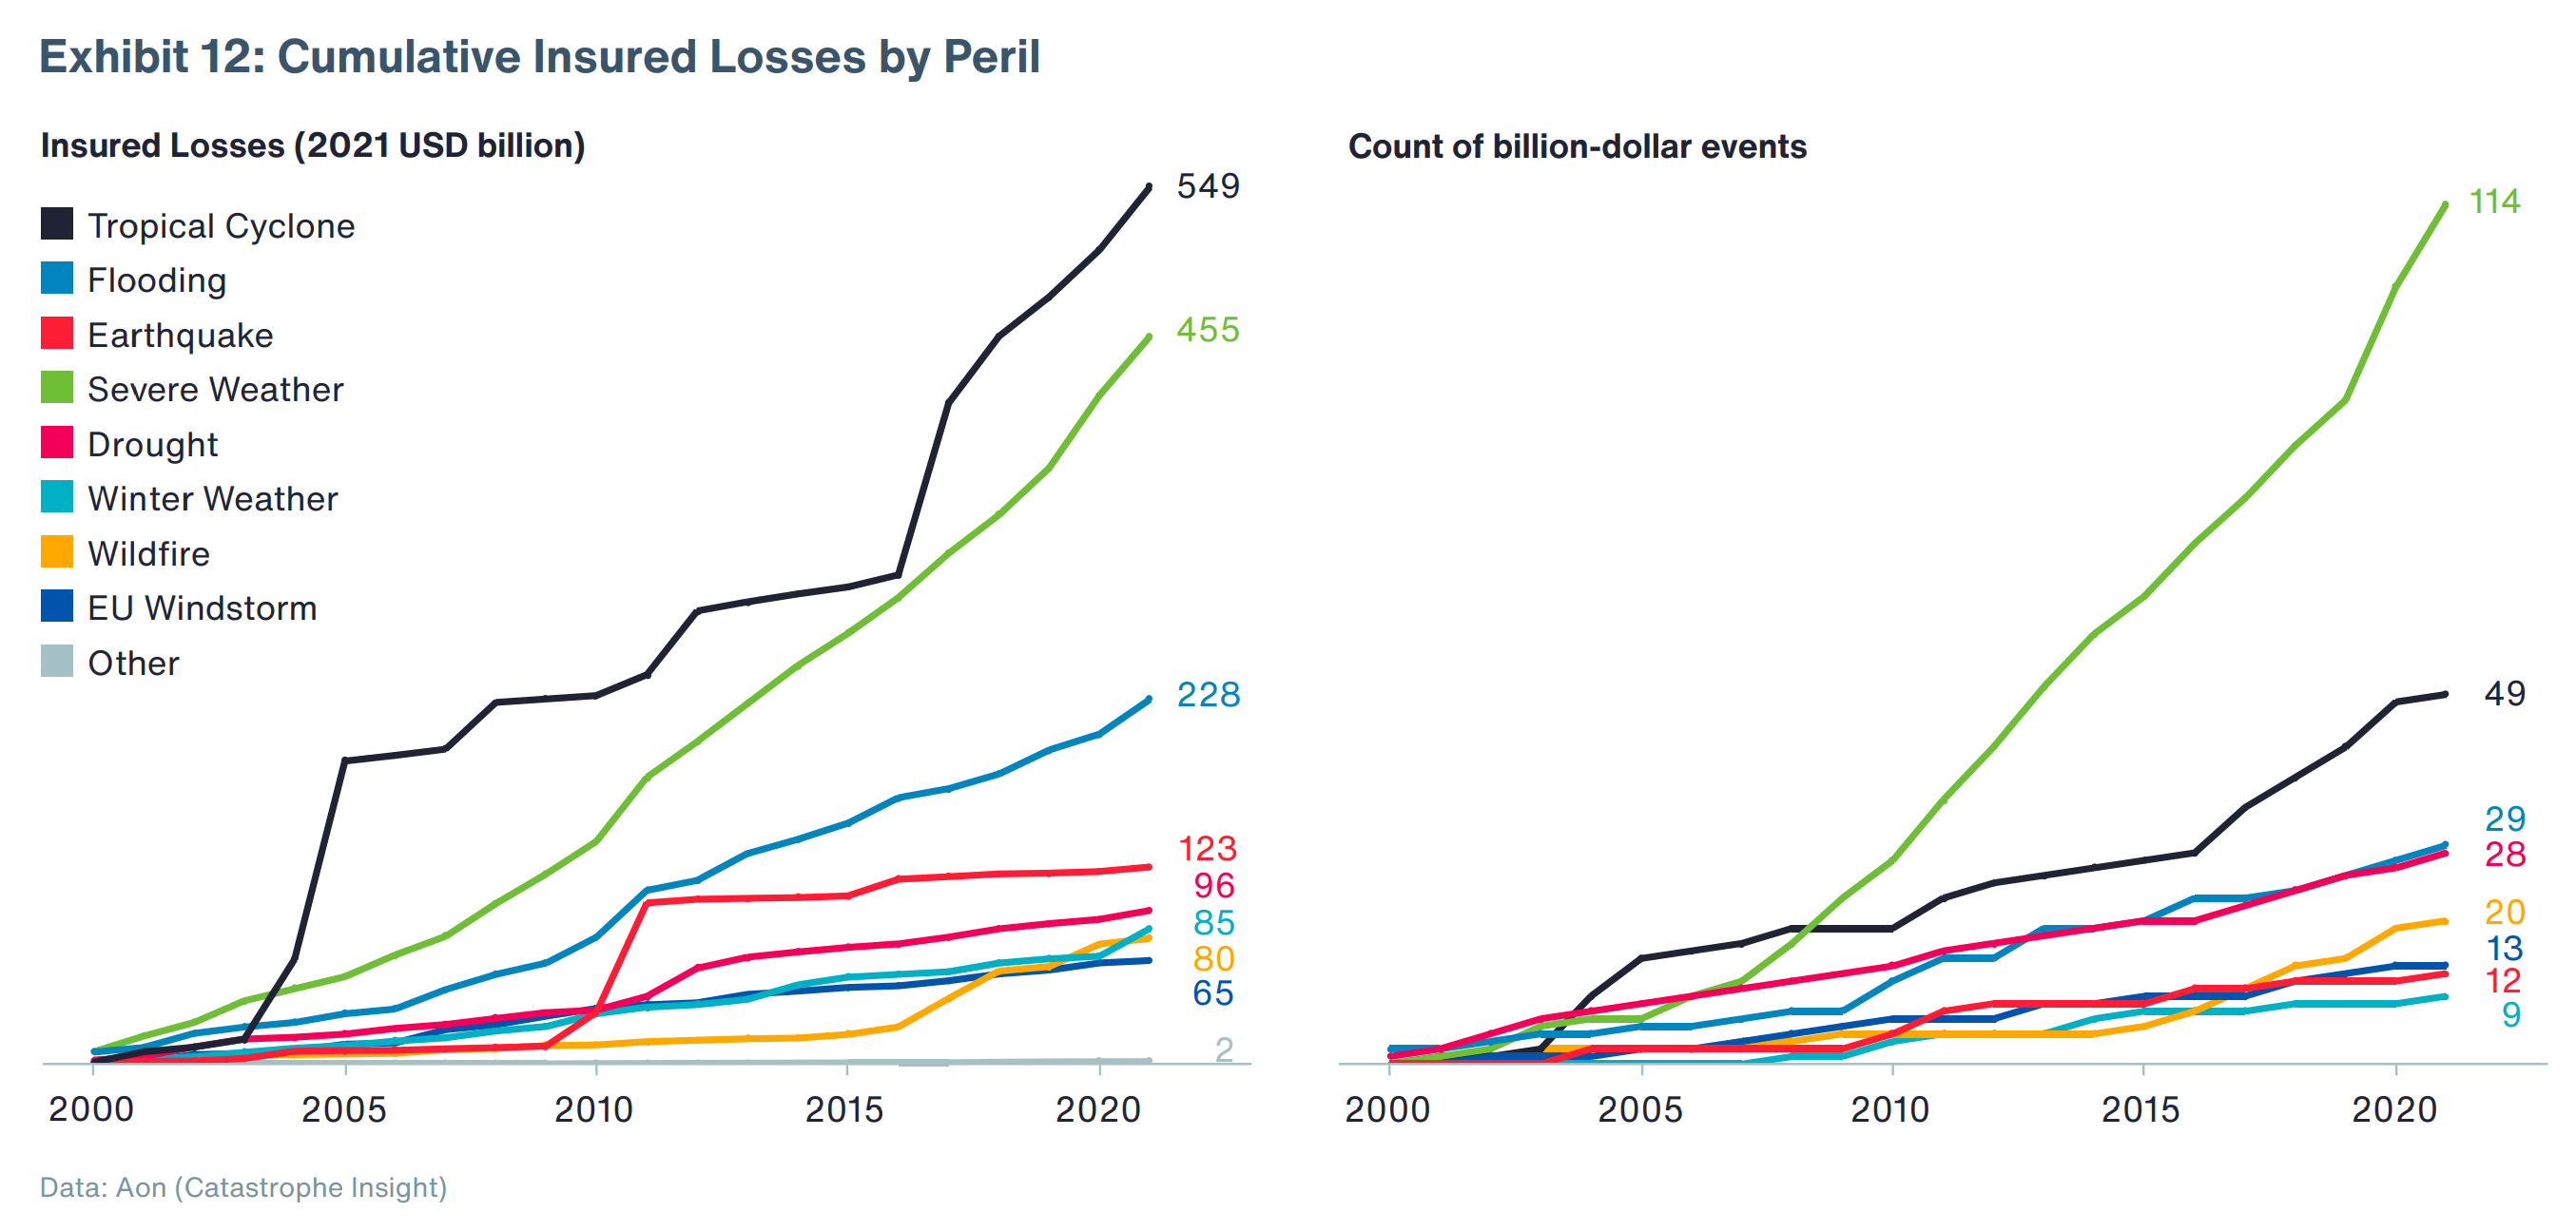
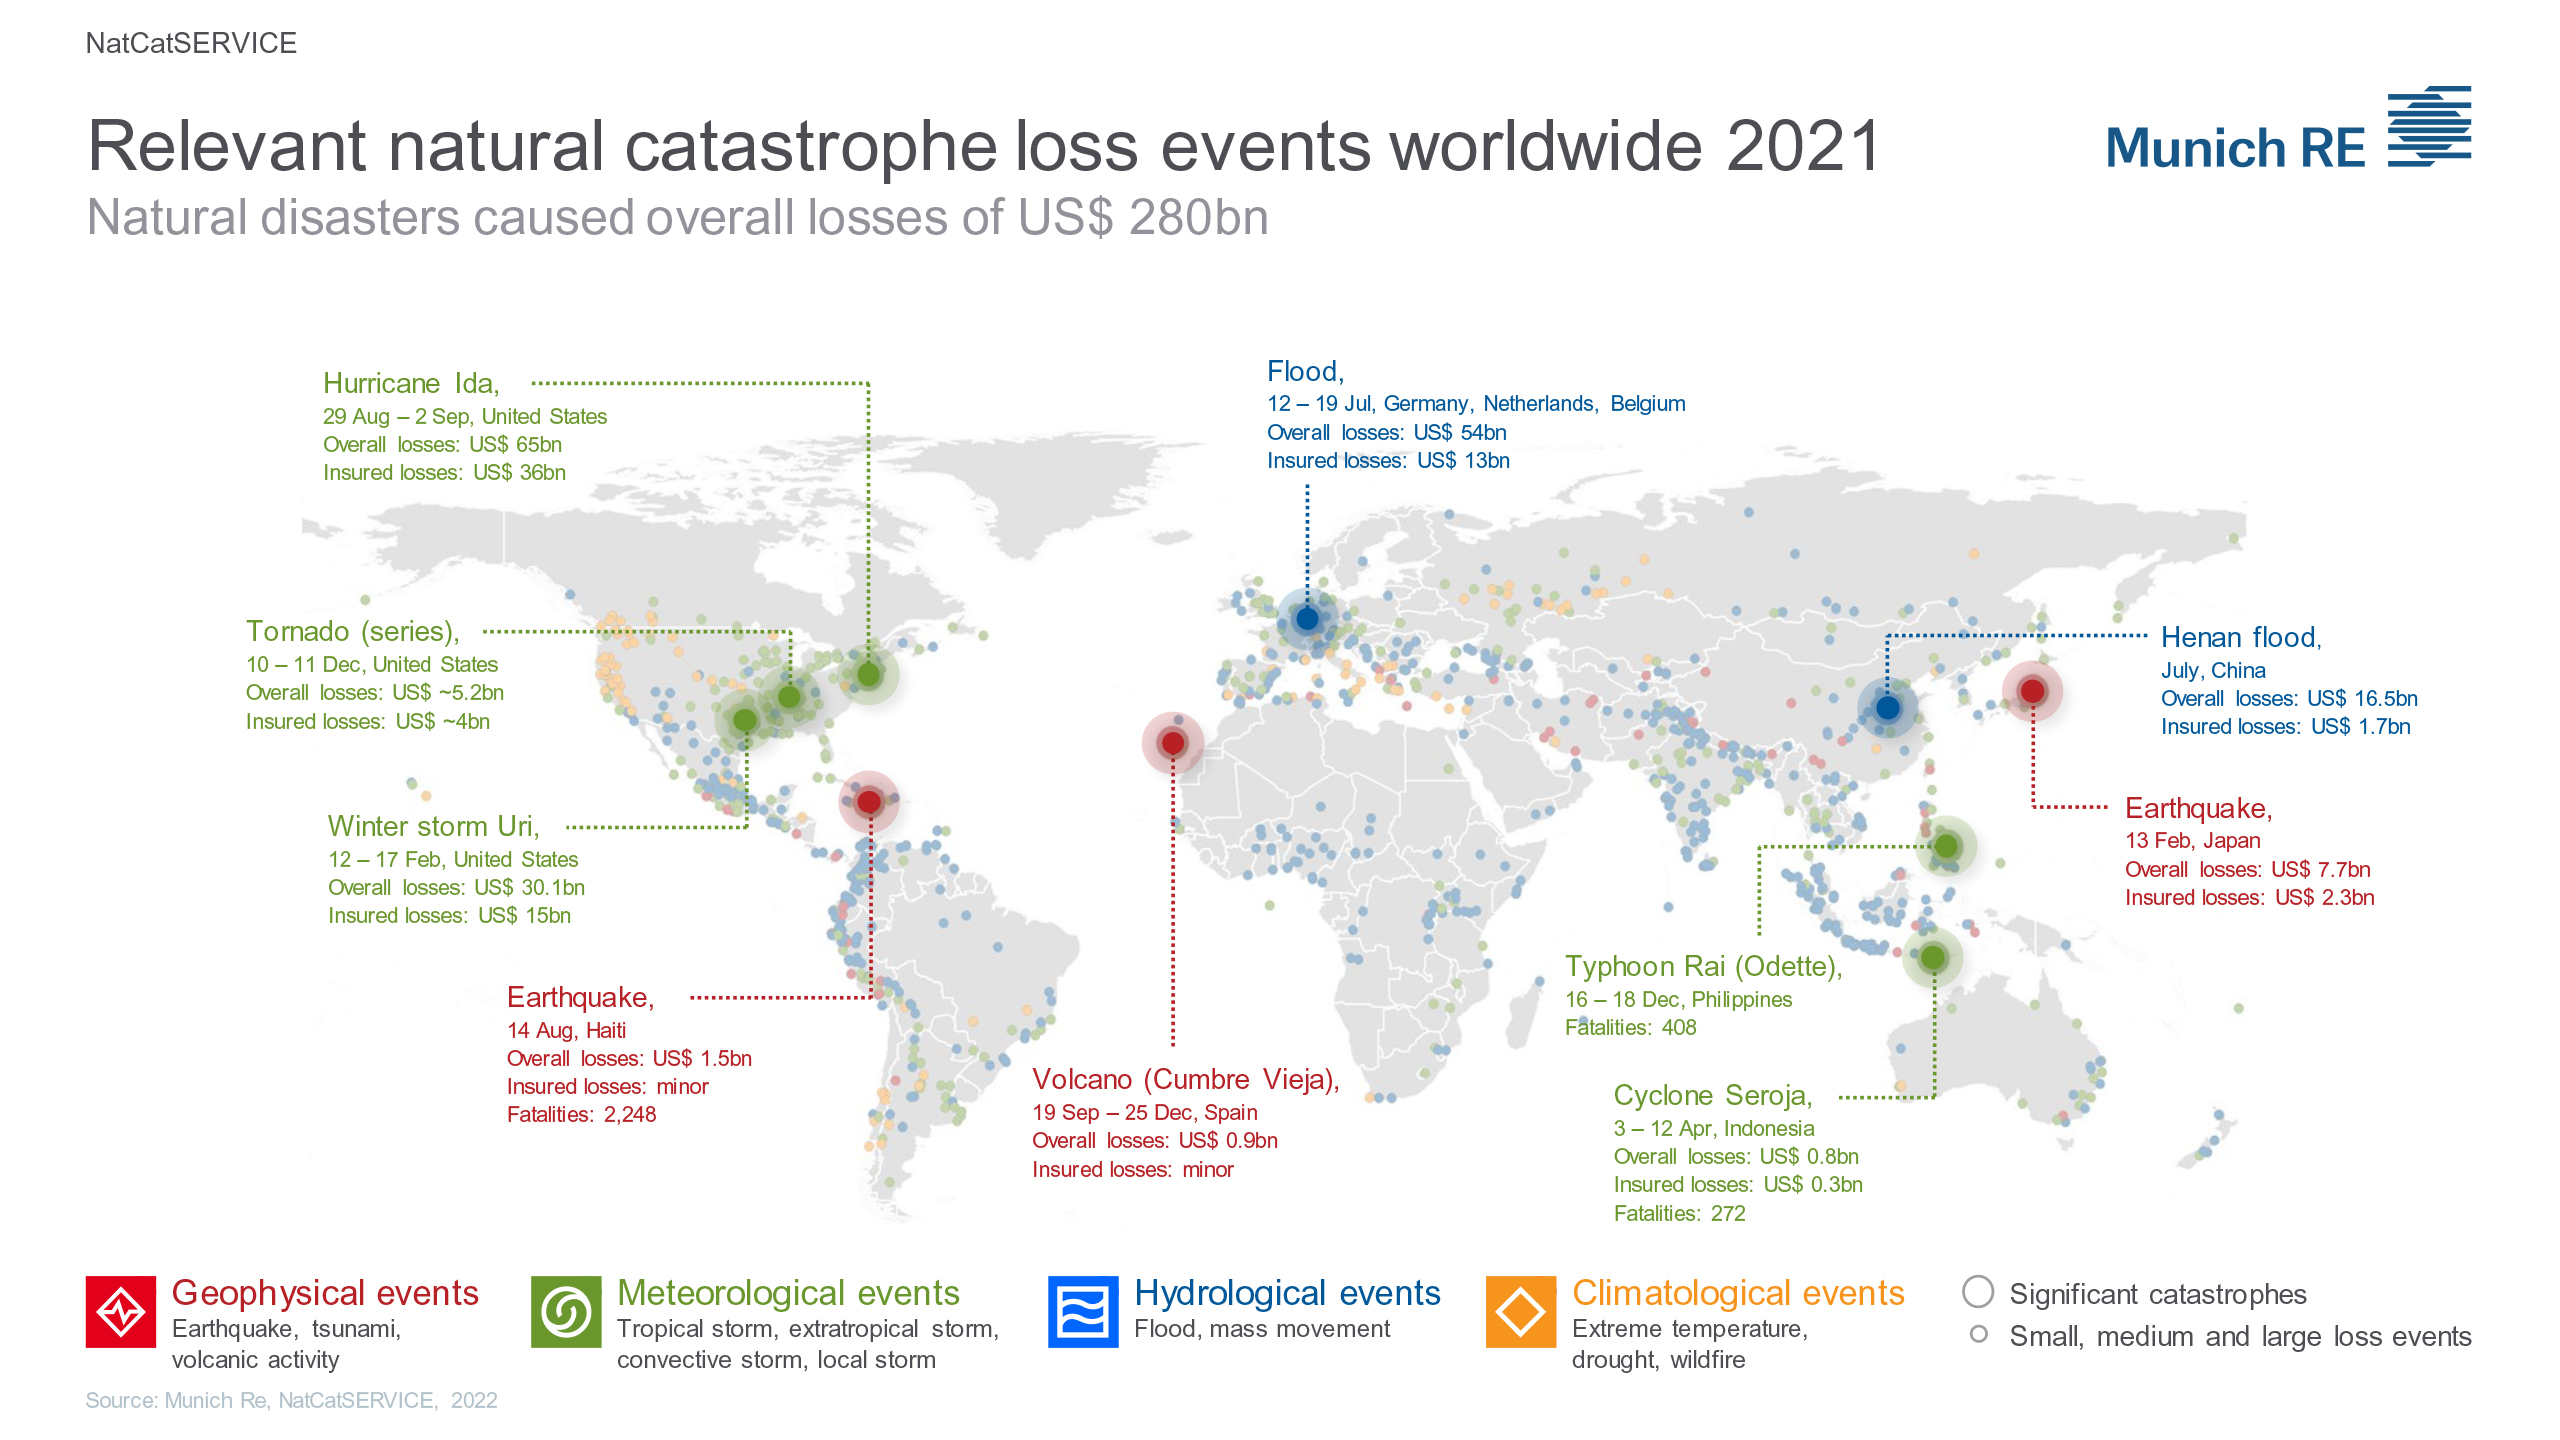
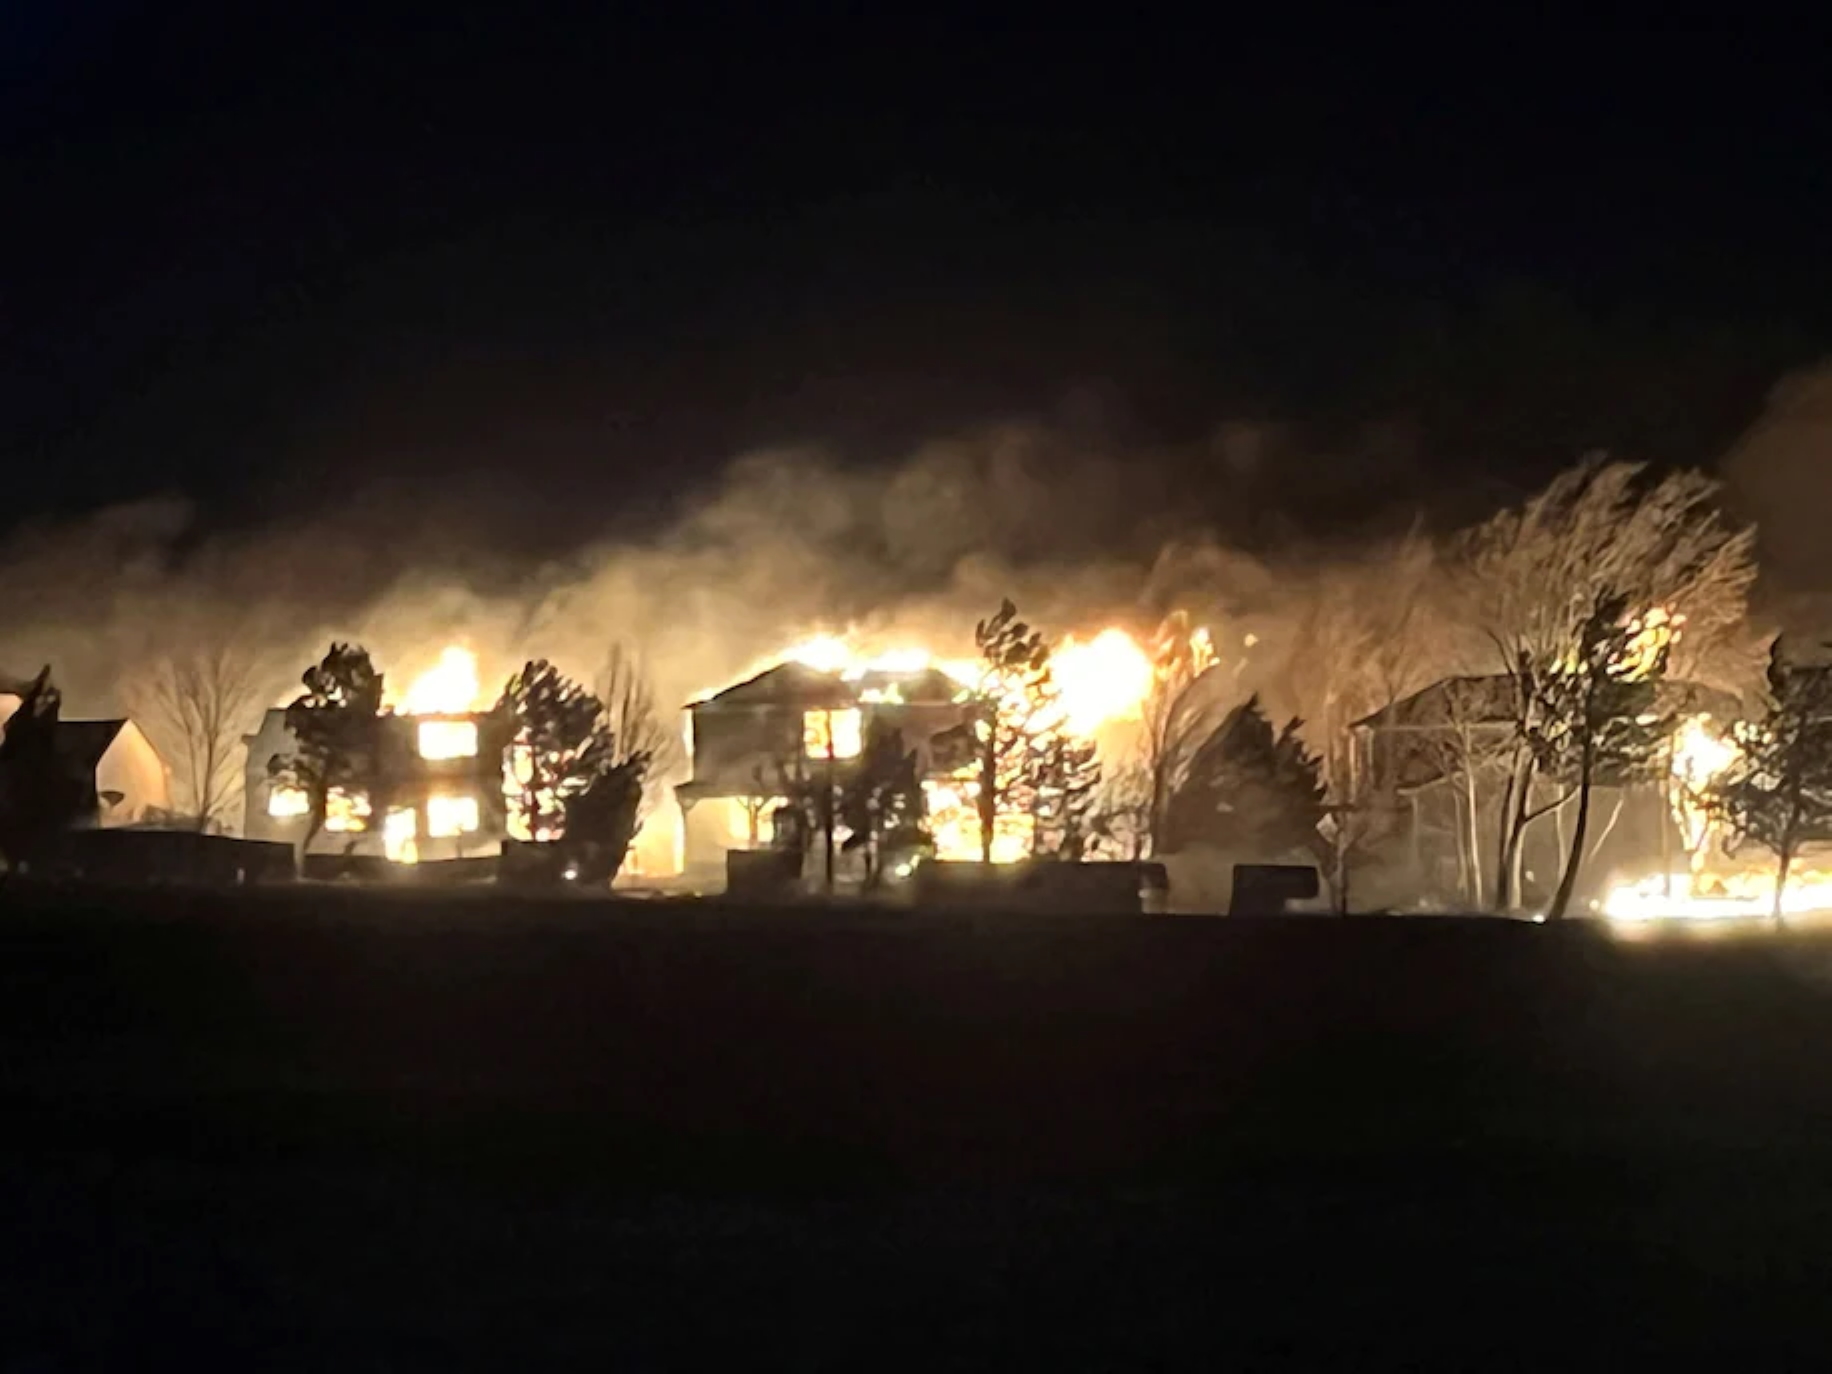
The background against which all this human chaos is unfolding is the rapidly changing global climate. In 2022, there was no paucity of climate catastrophe.
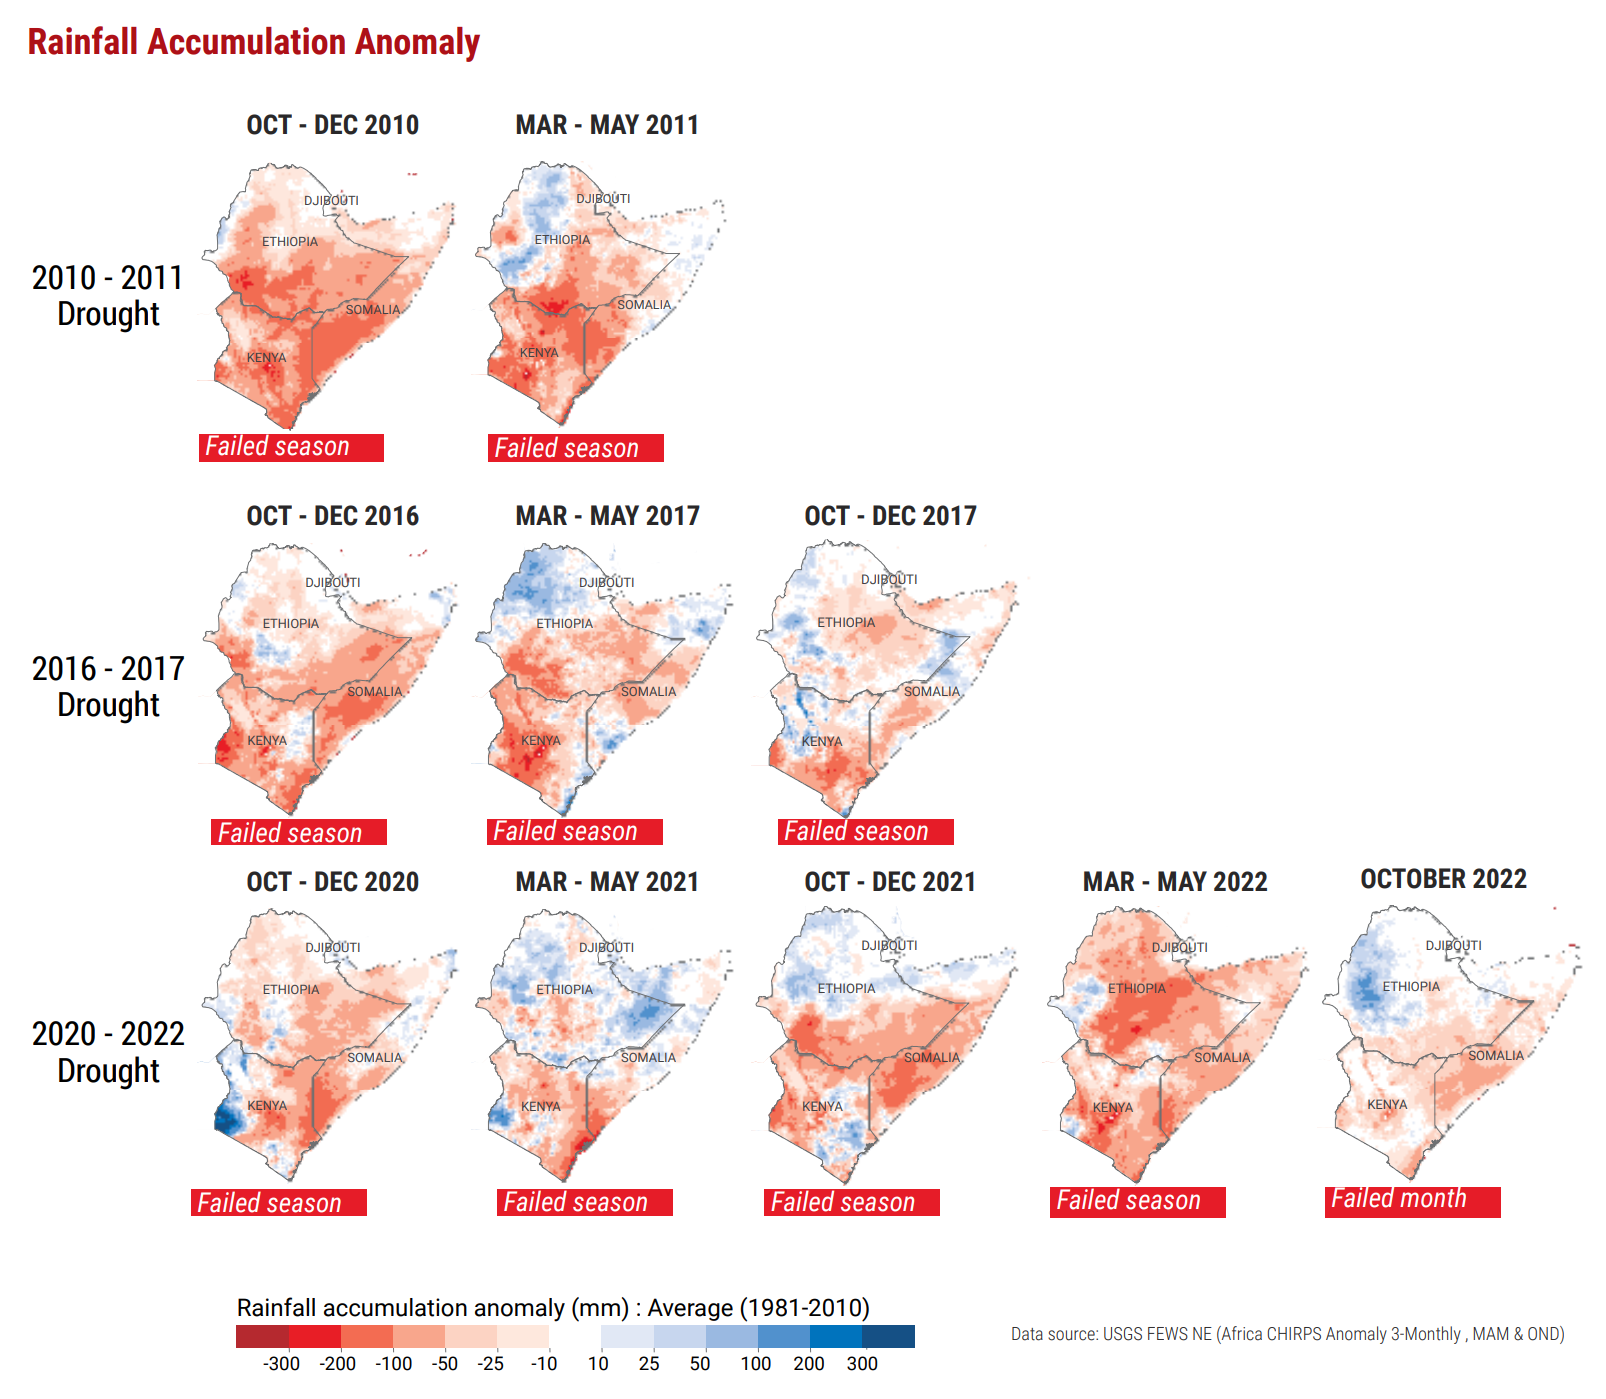
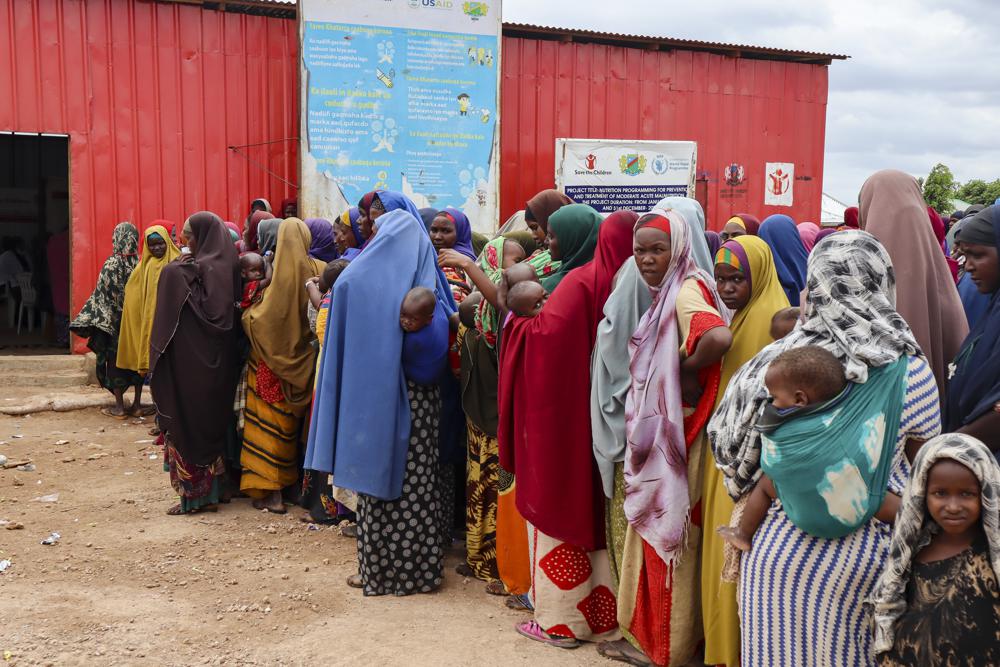
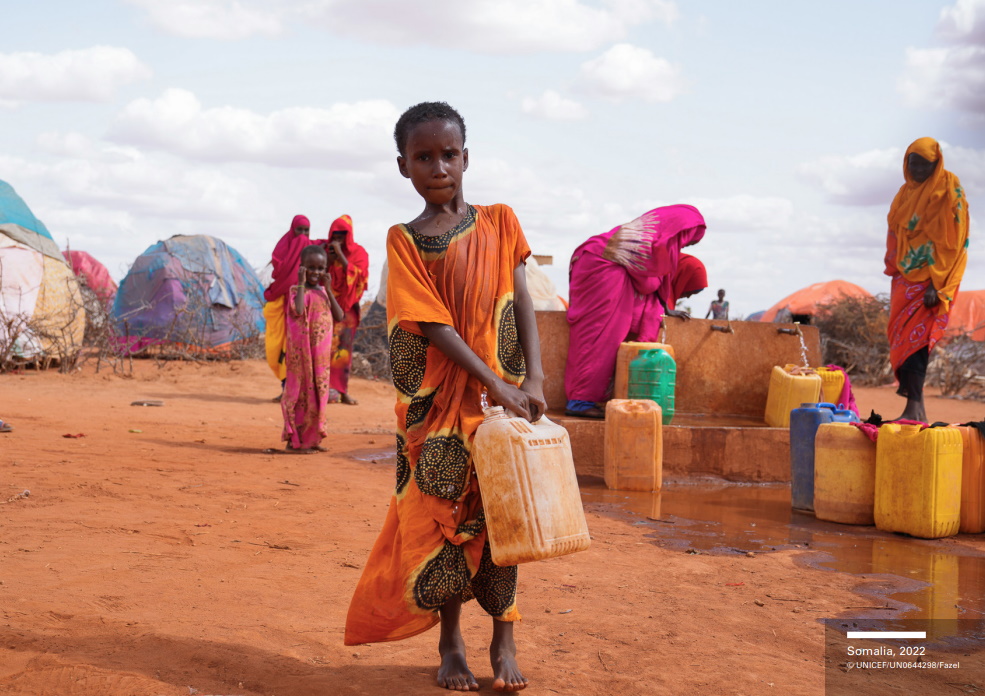
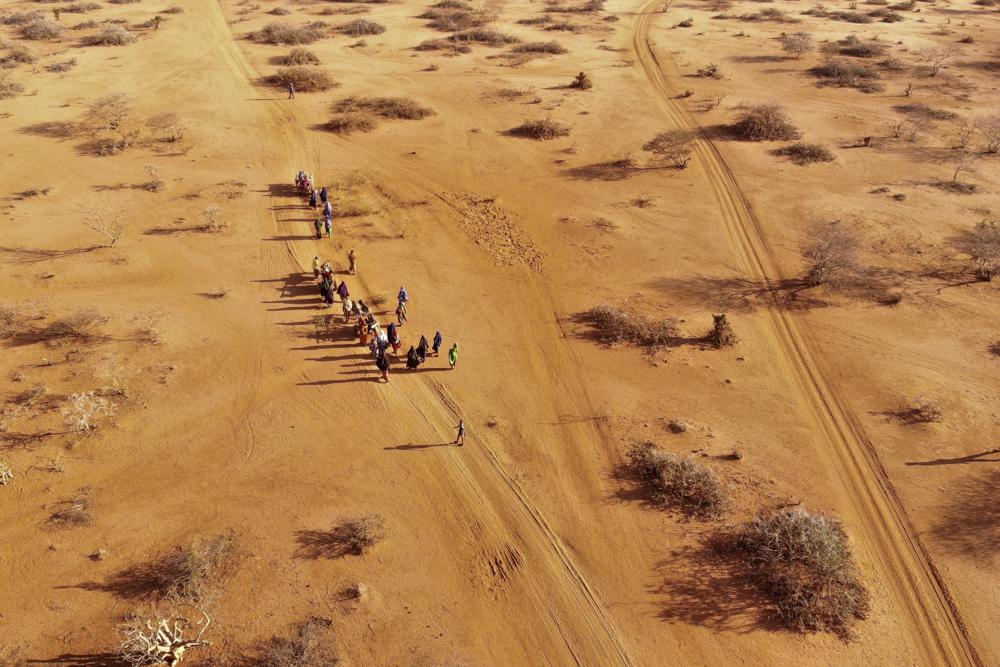
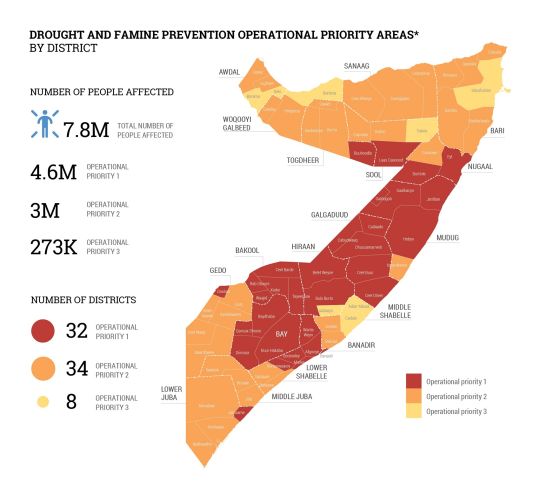
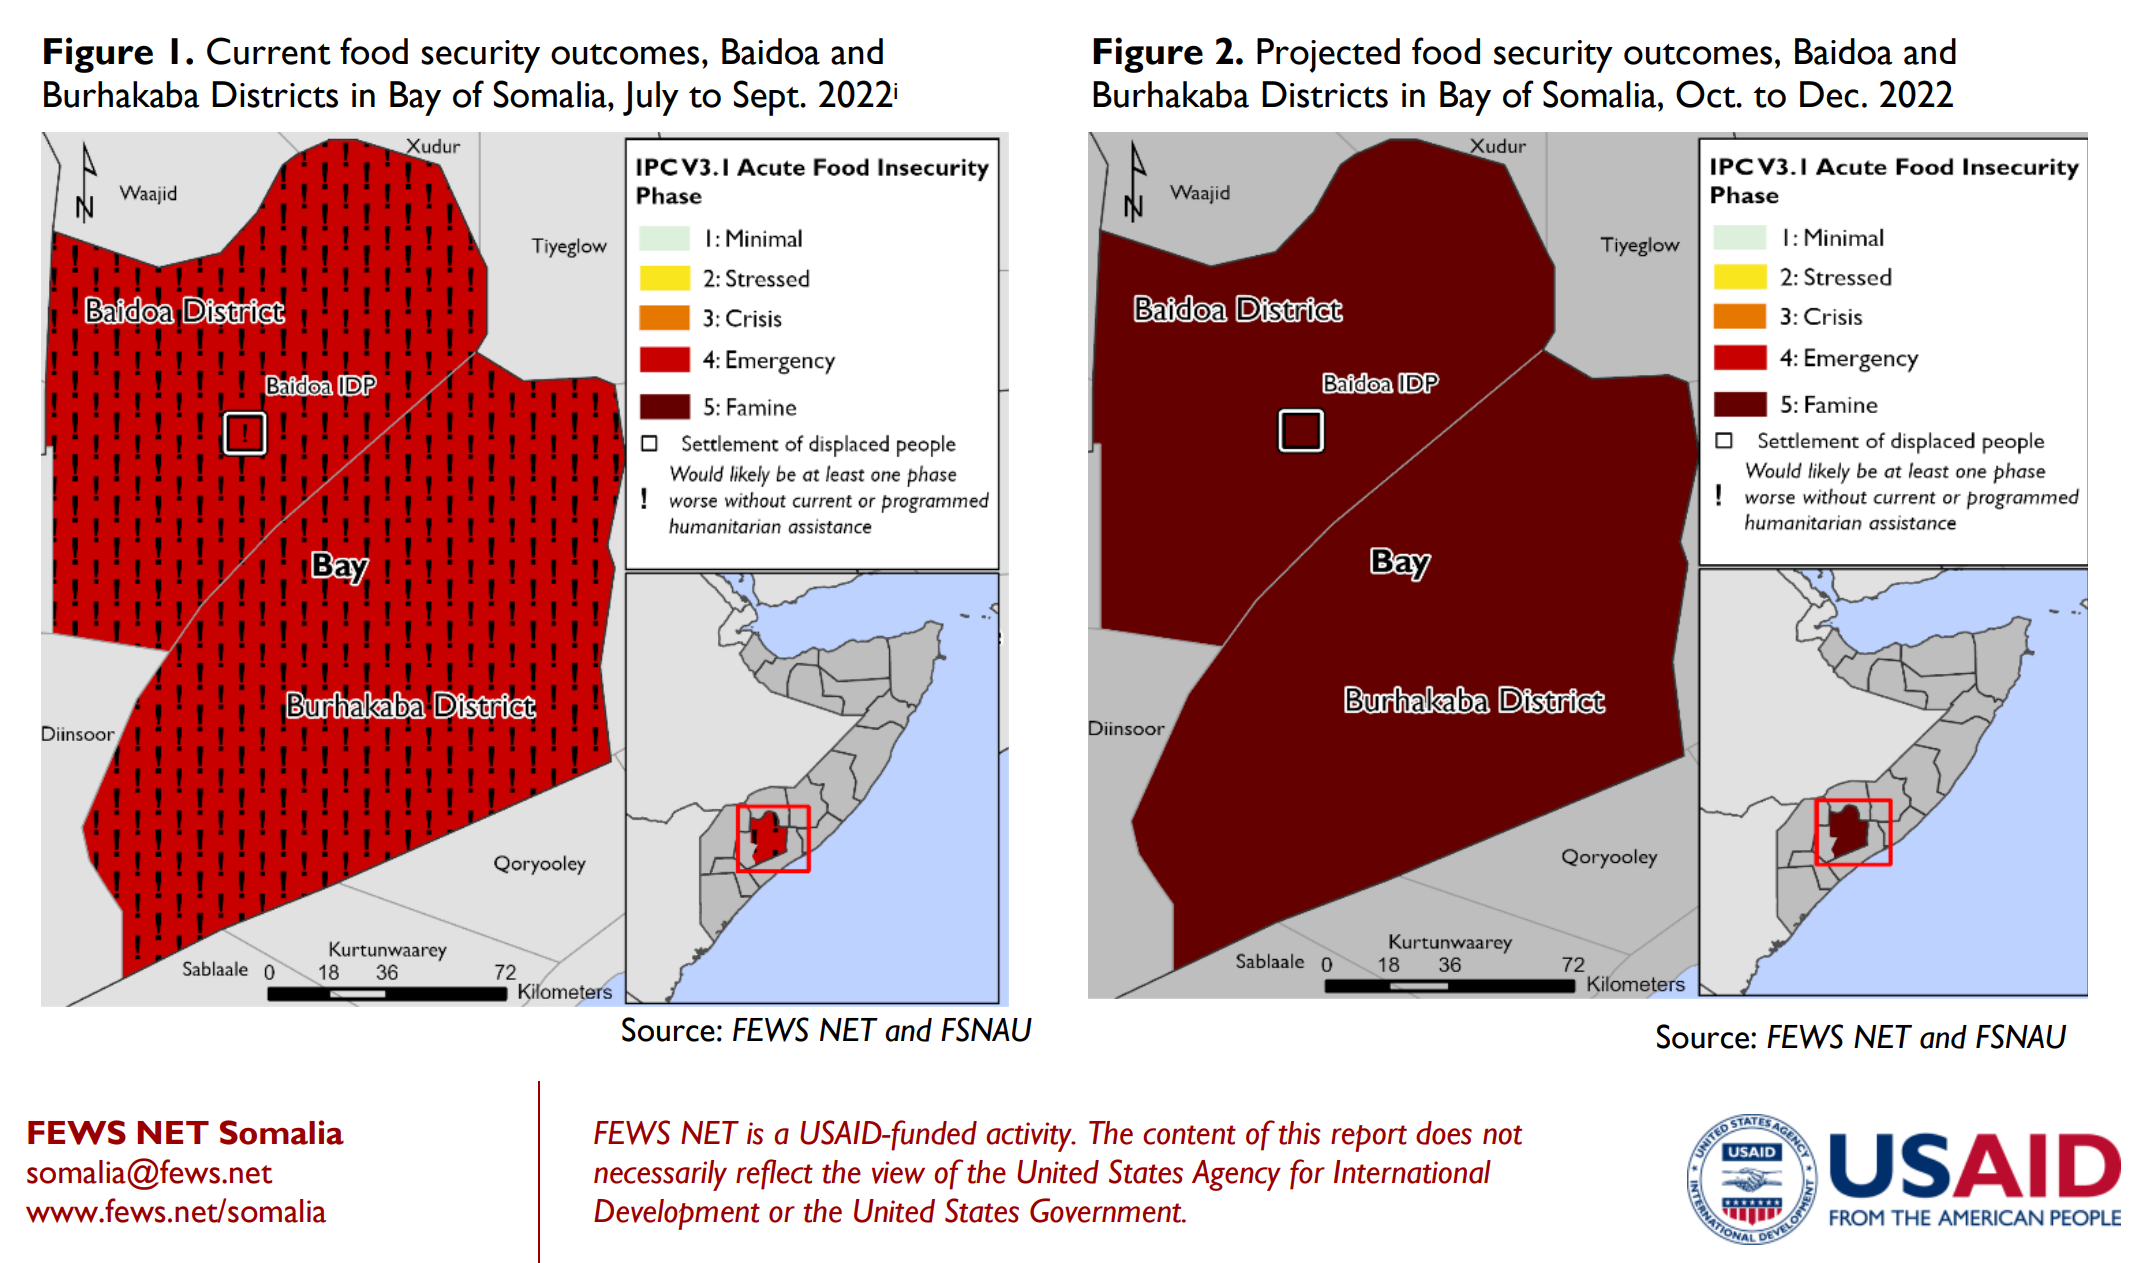
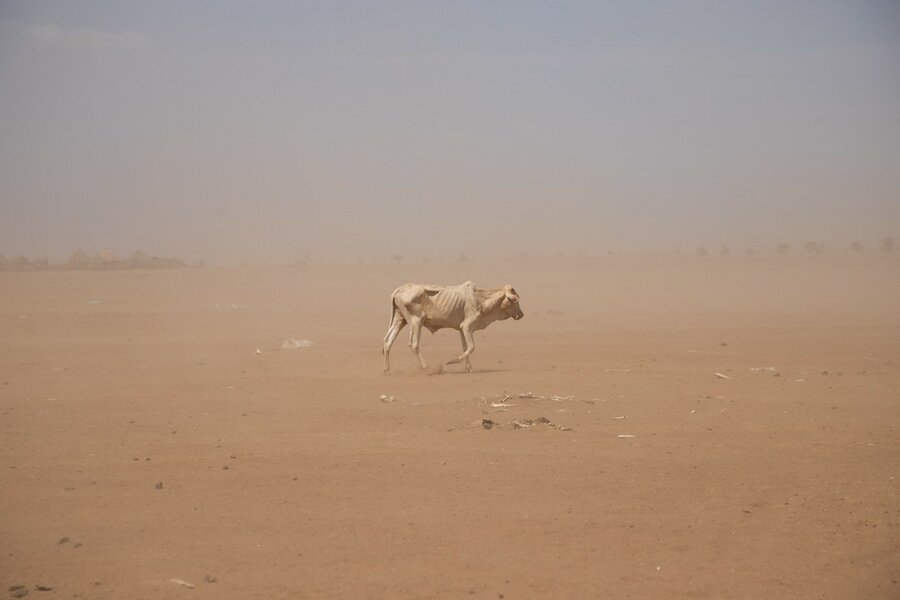
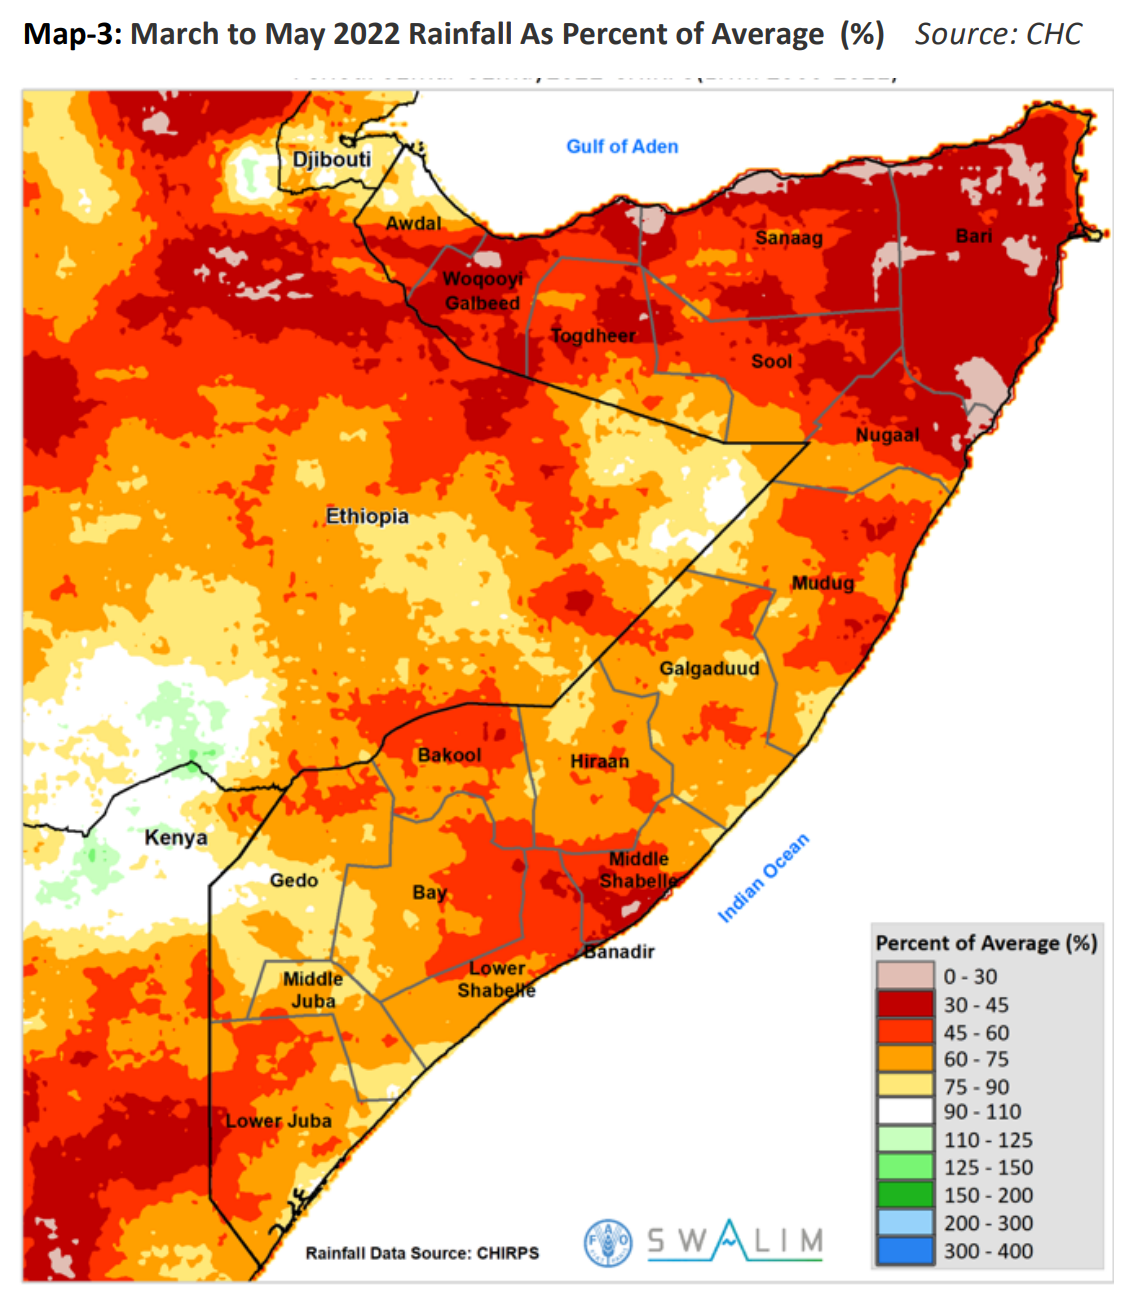
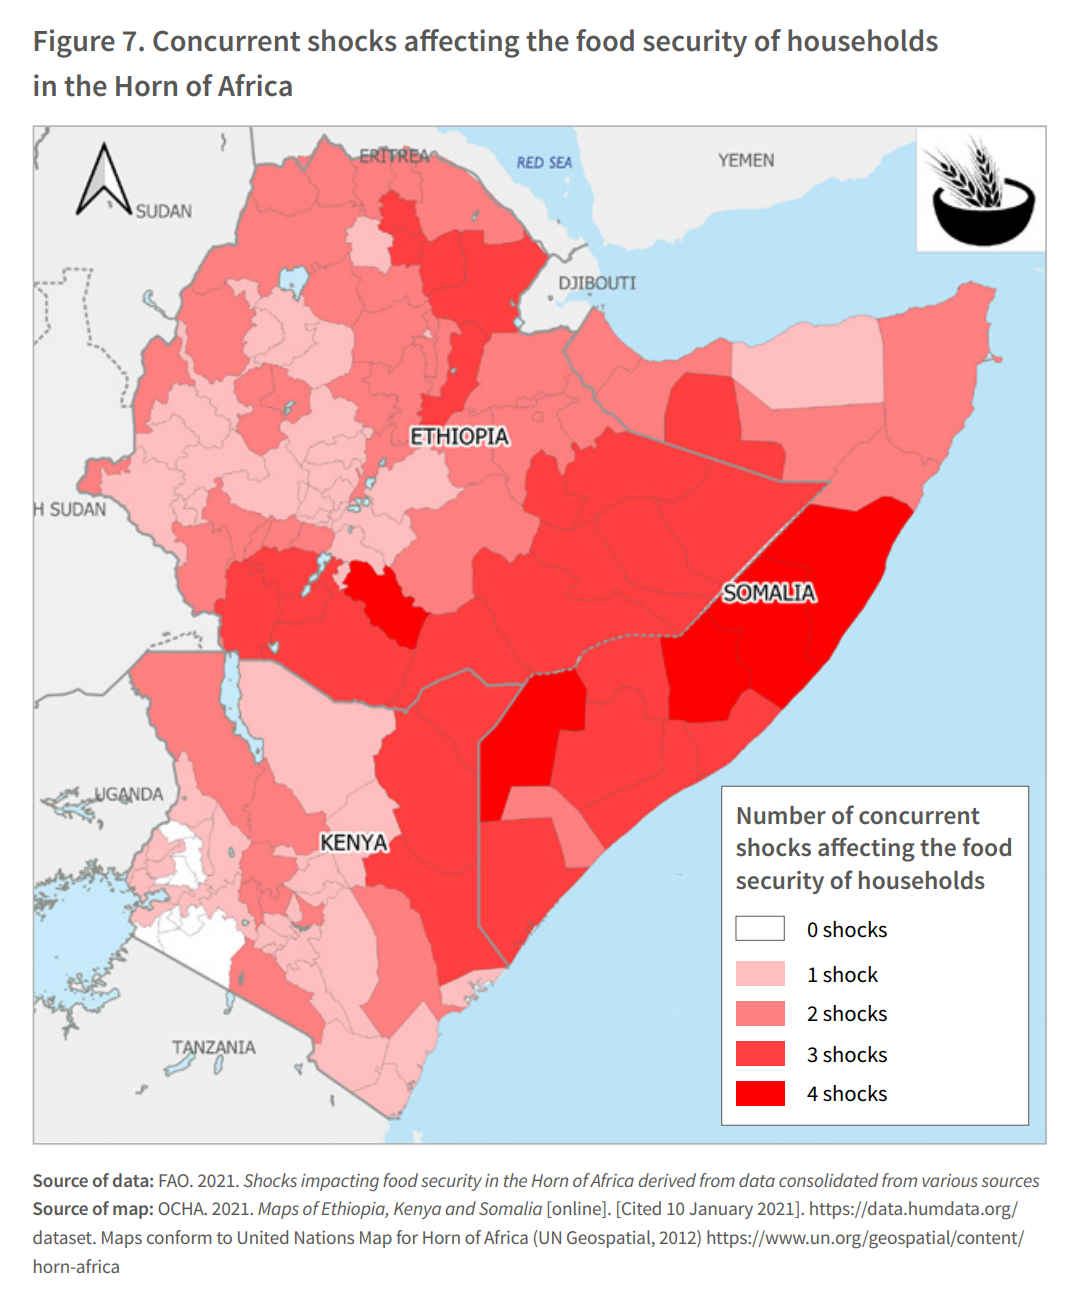
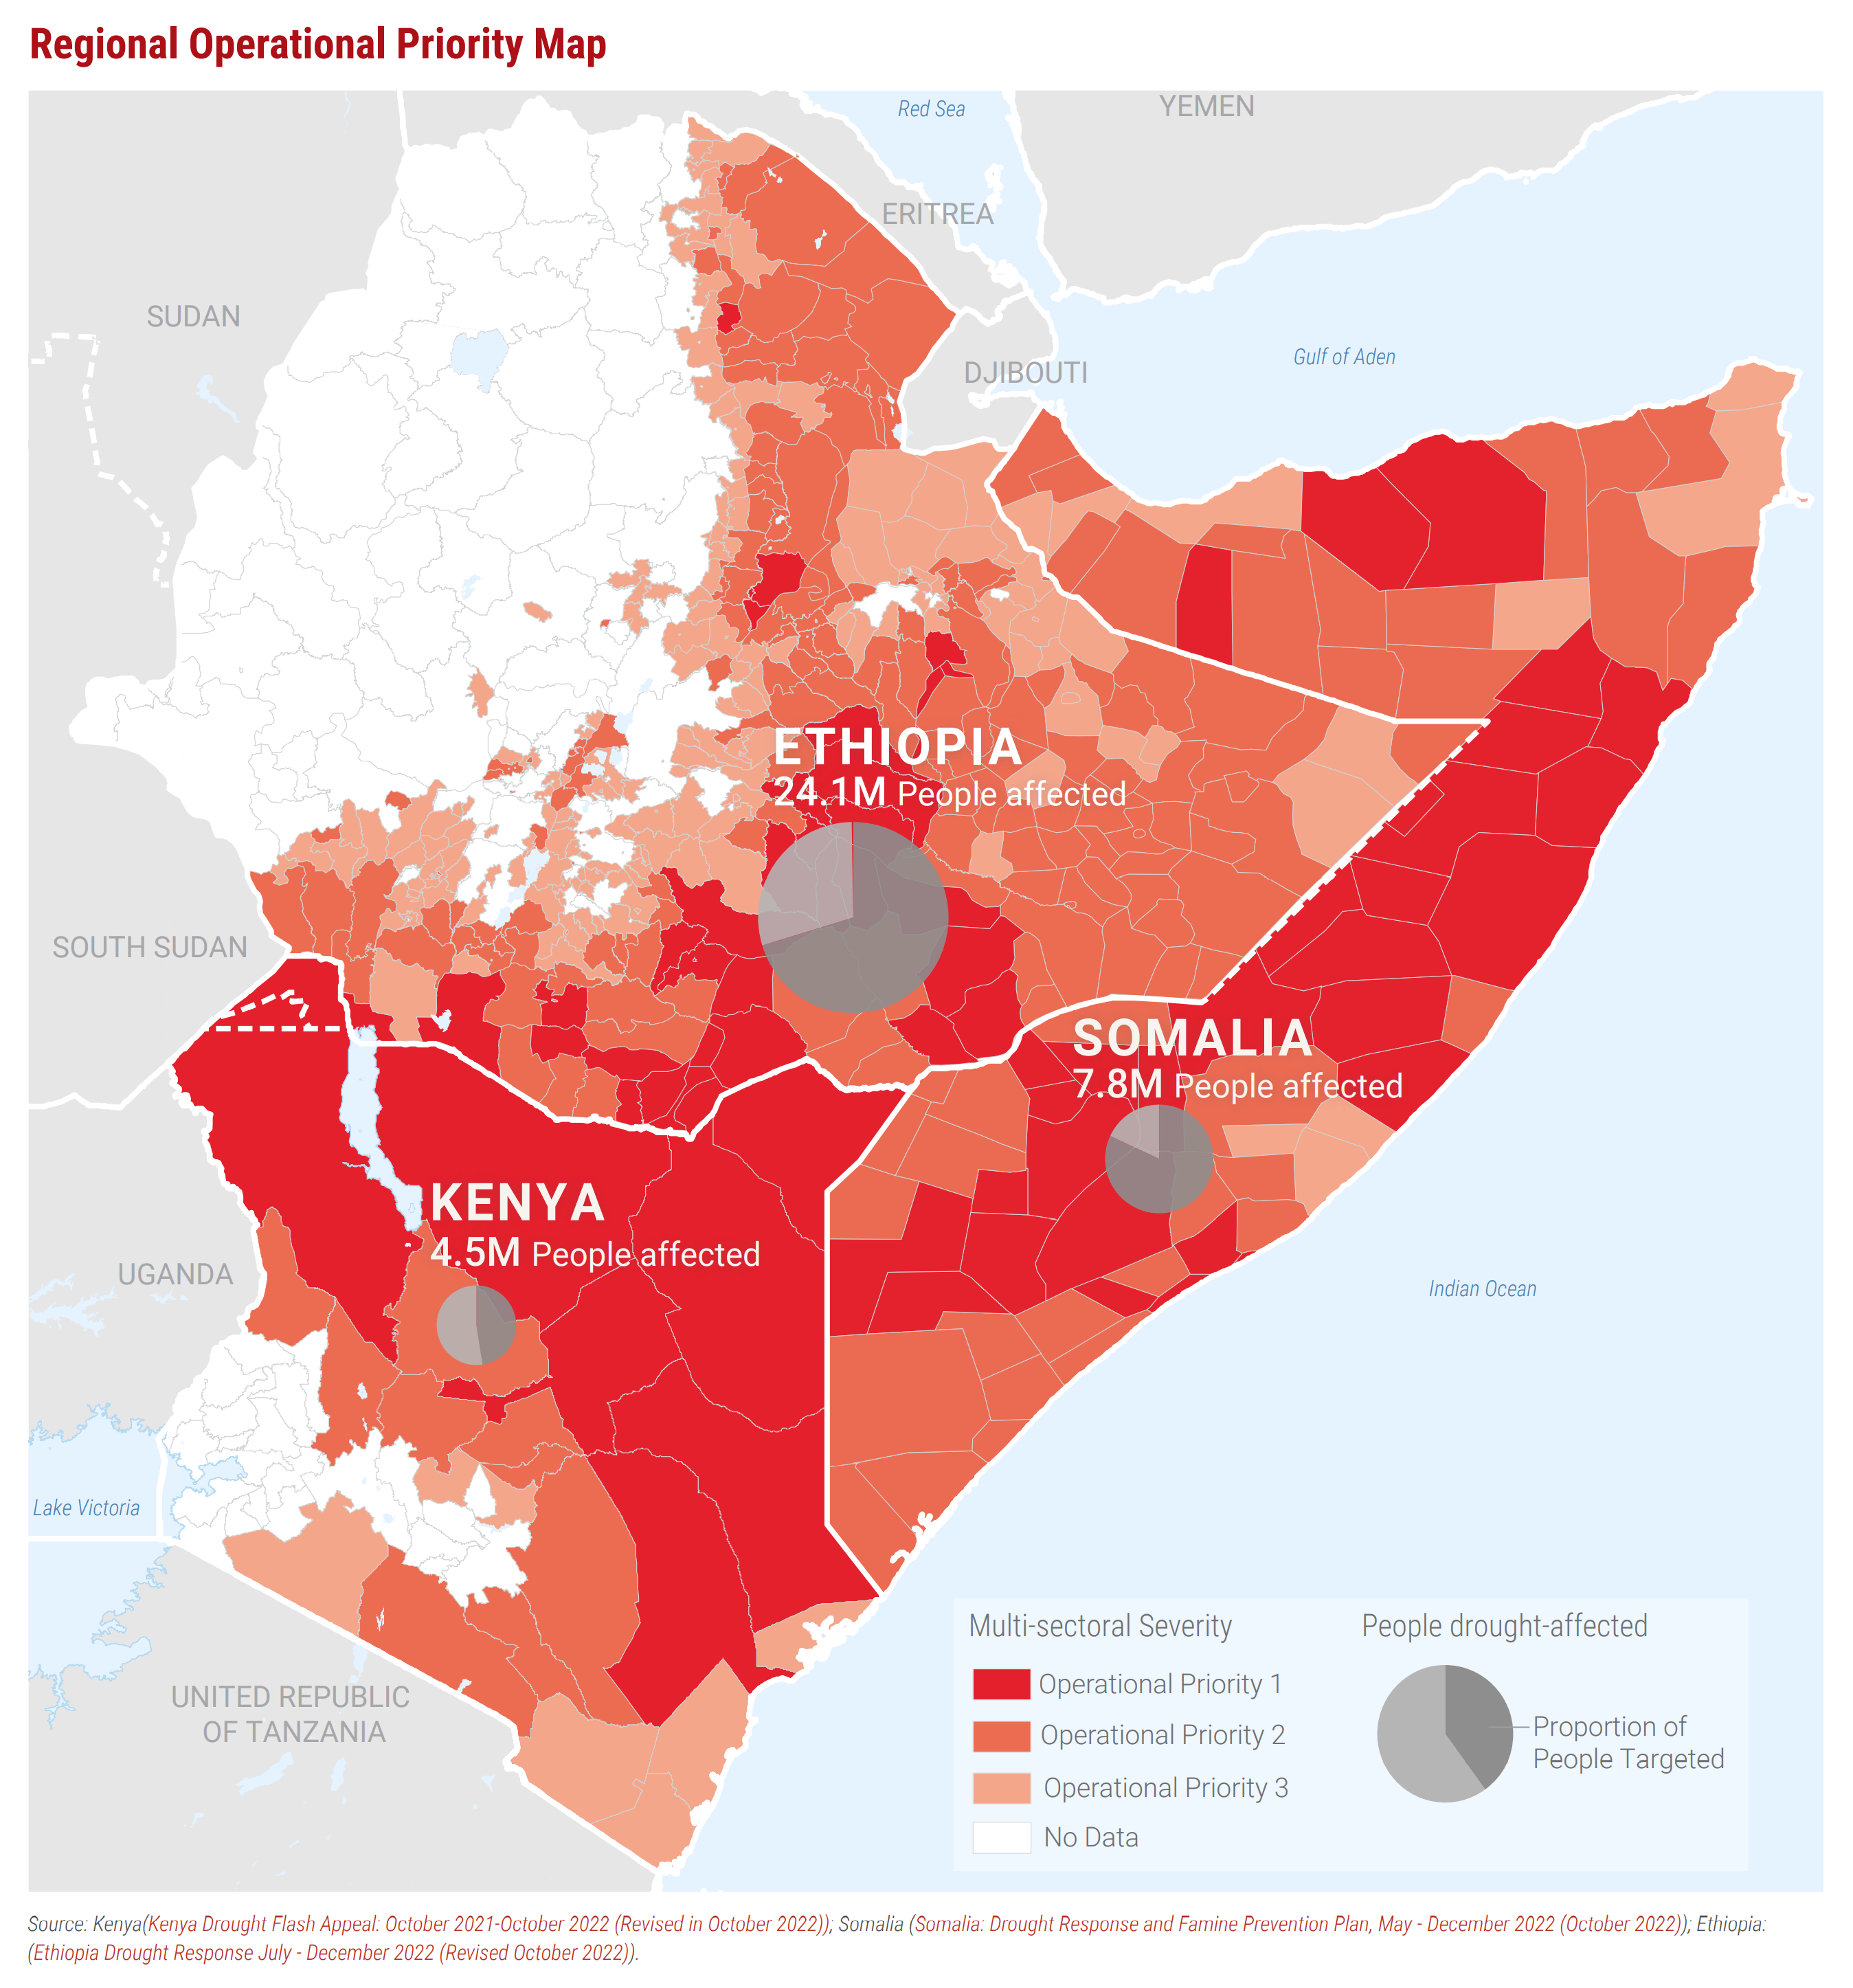
Probably the single most devastating climate disaster is the ongoing drought in the Horn of Africa, where four consecutive rainy seasons have failed, and the fifth has underperformed. By December 2022, around 20.2 million children faced the threat of severe hunger, thirst, and disease, compared with 10 million in July 2022.
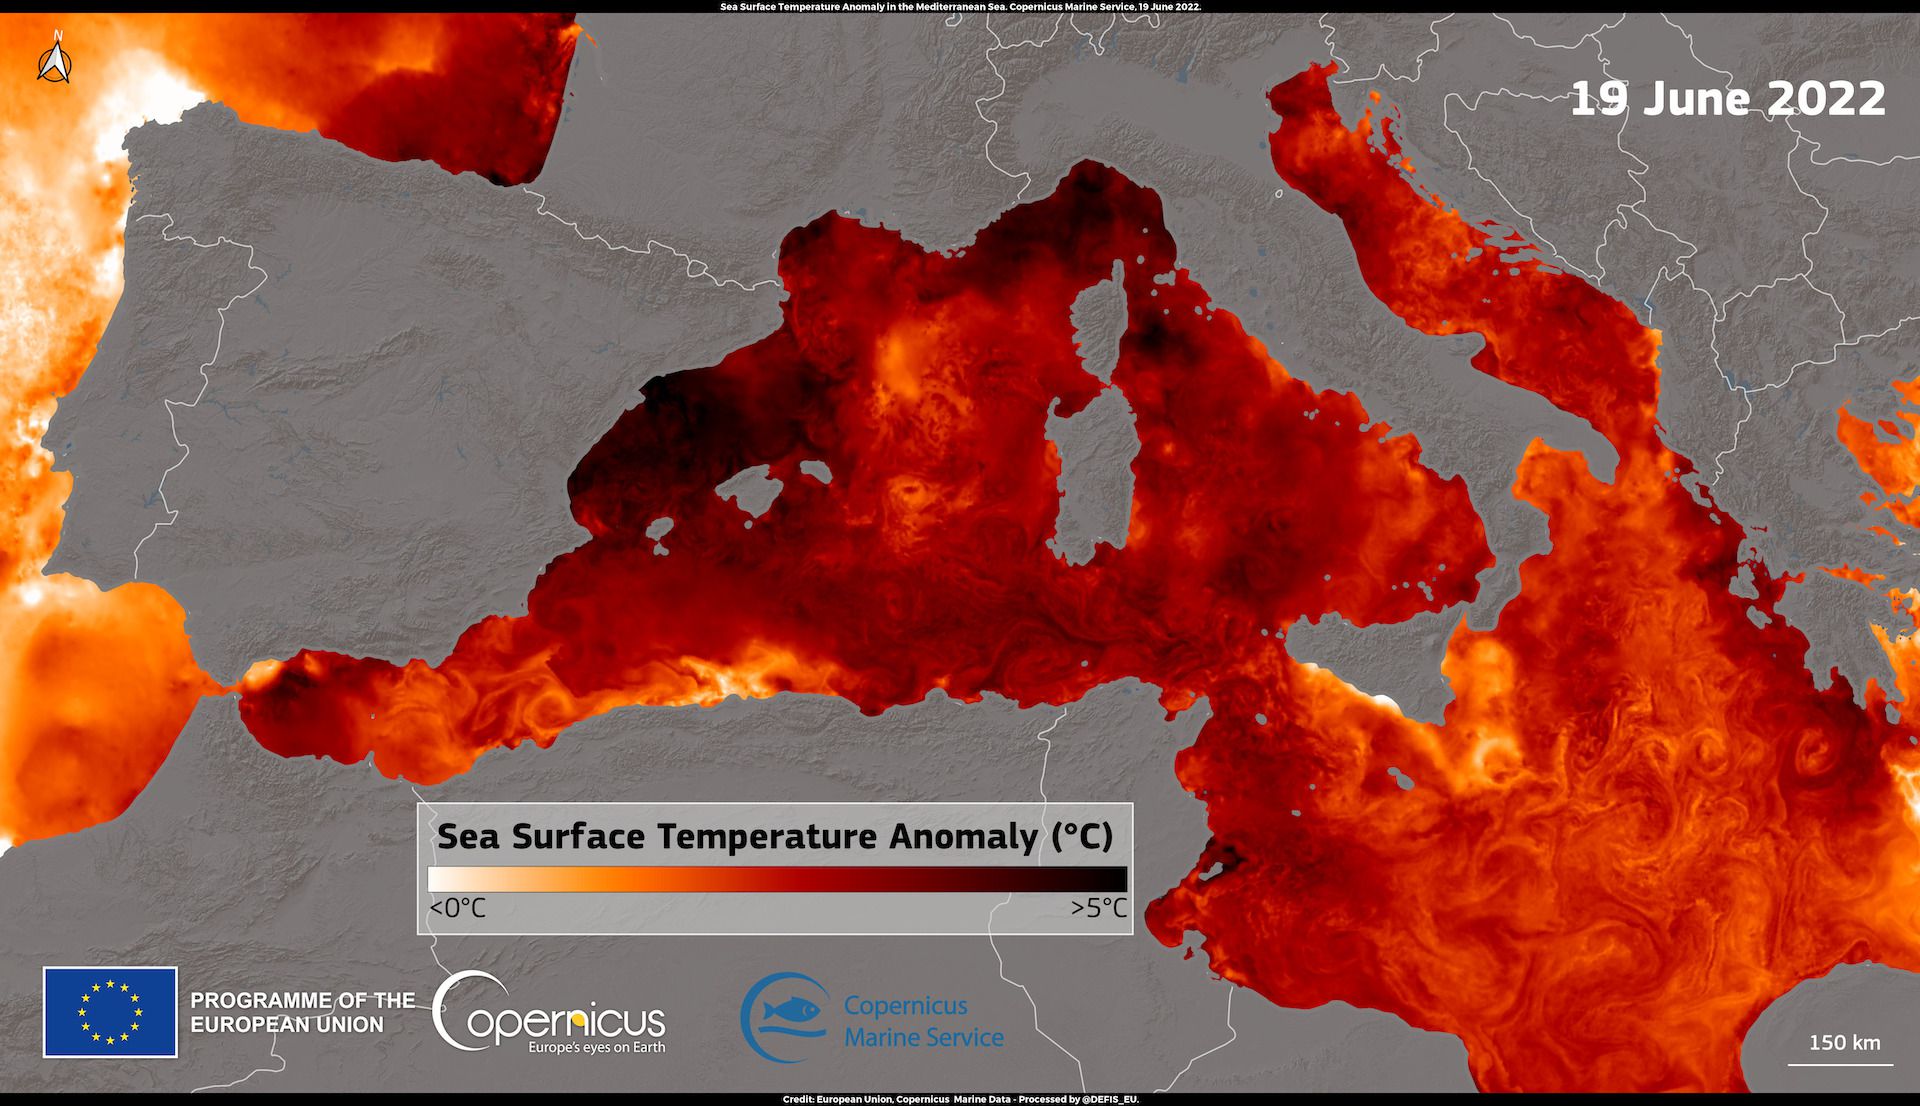
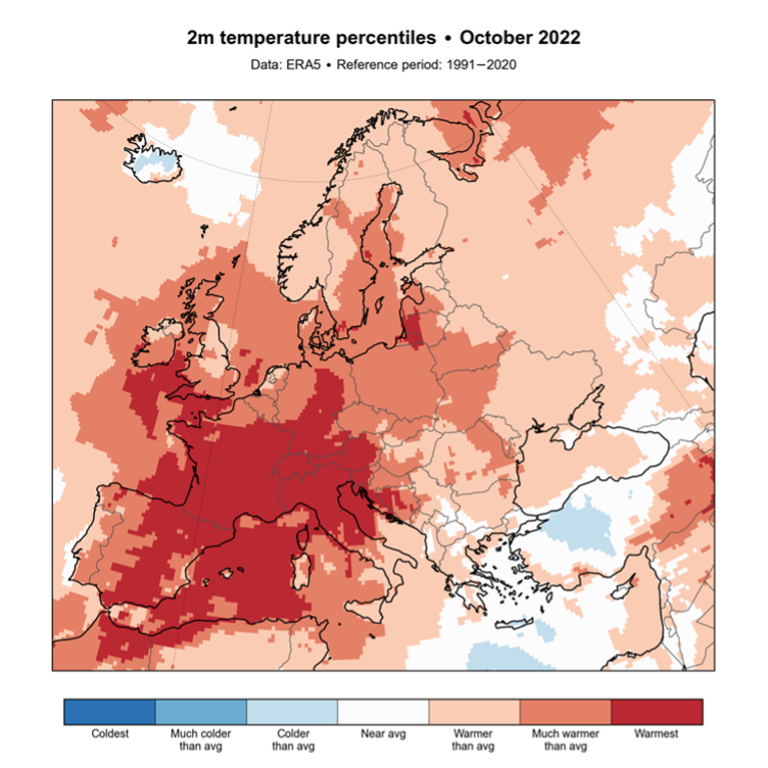
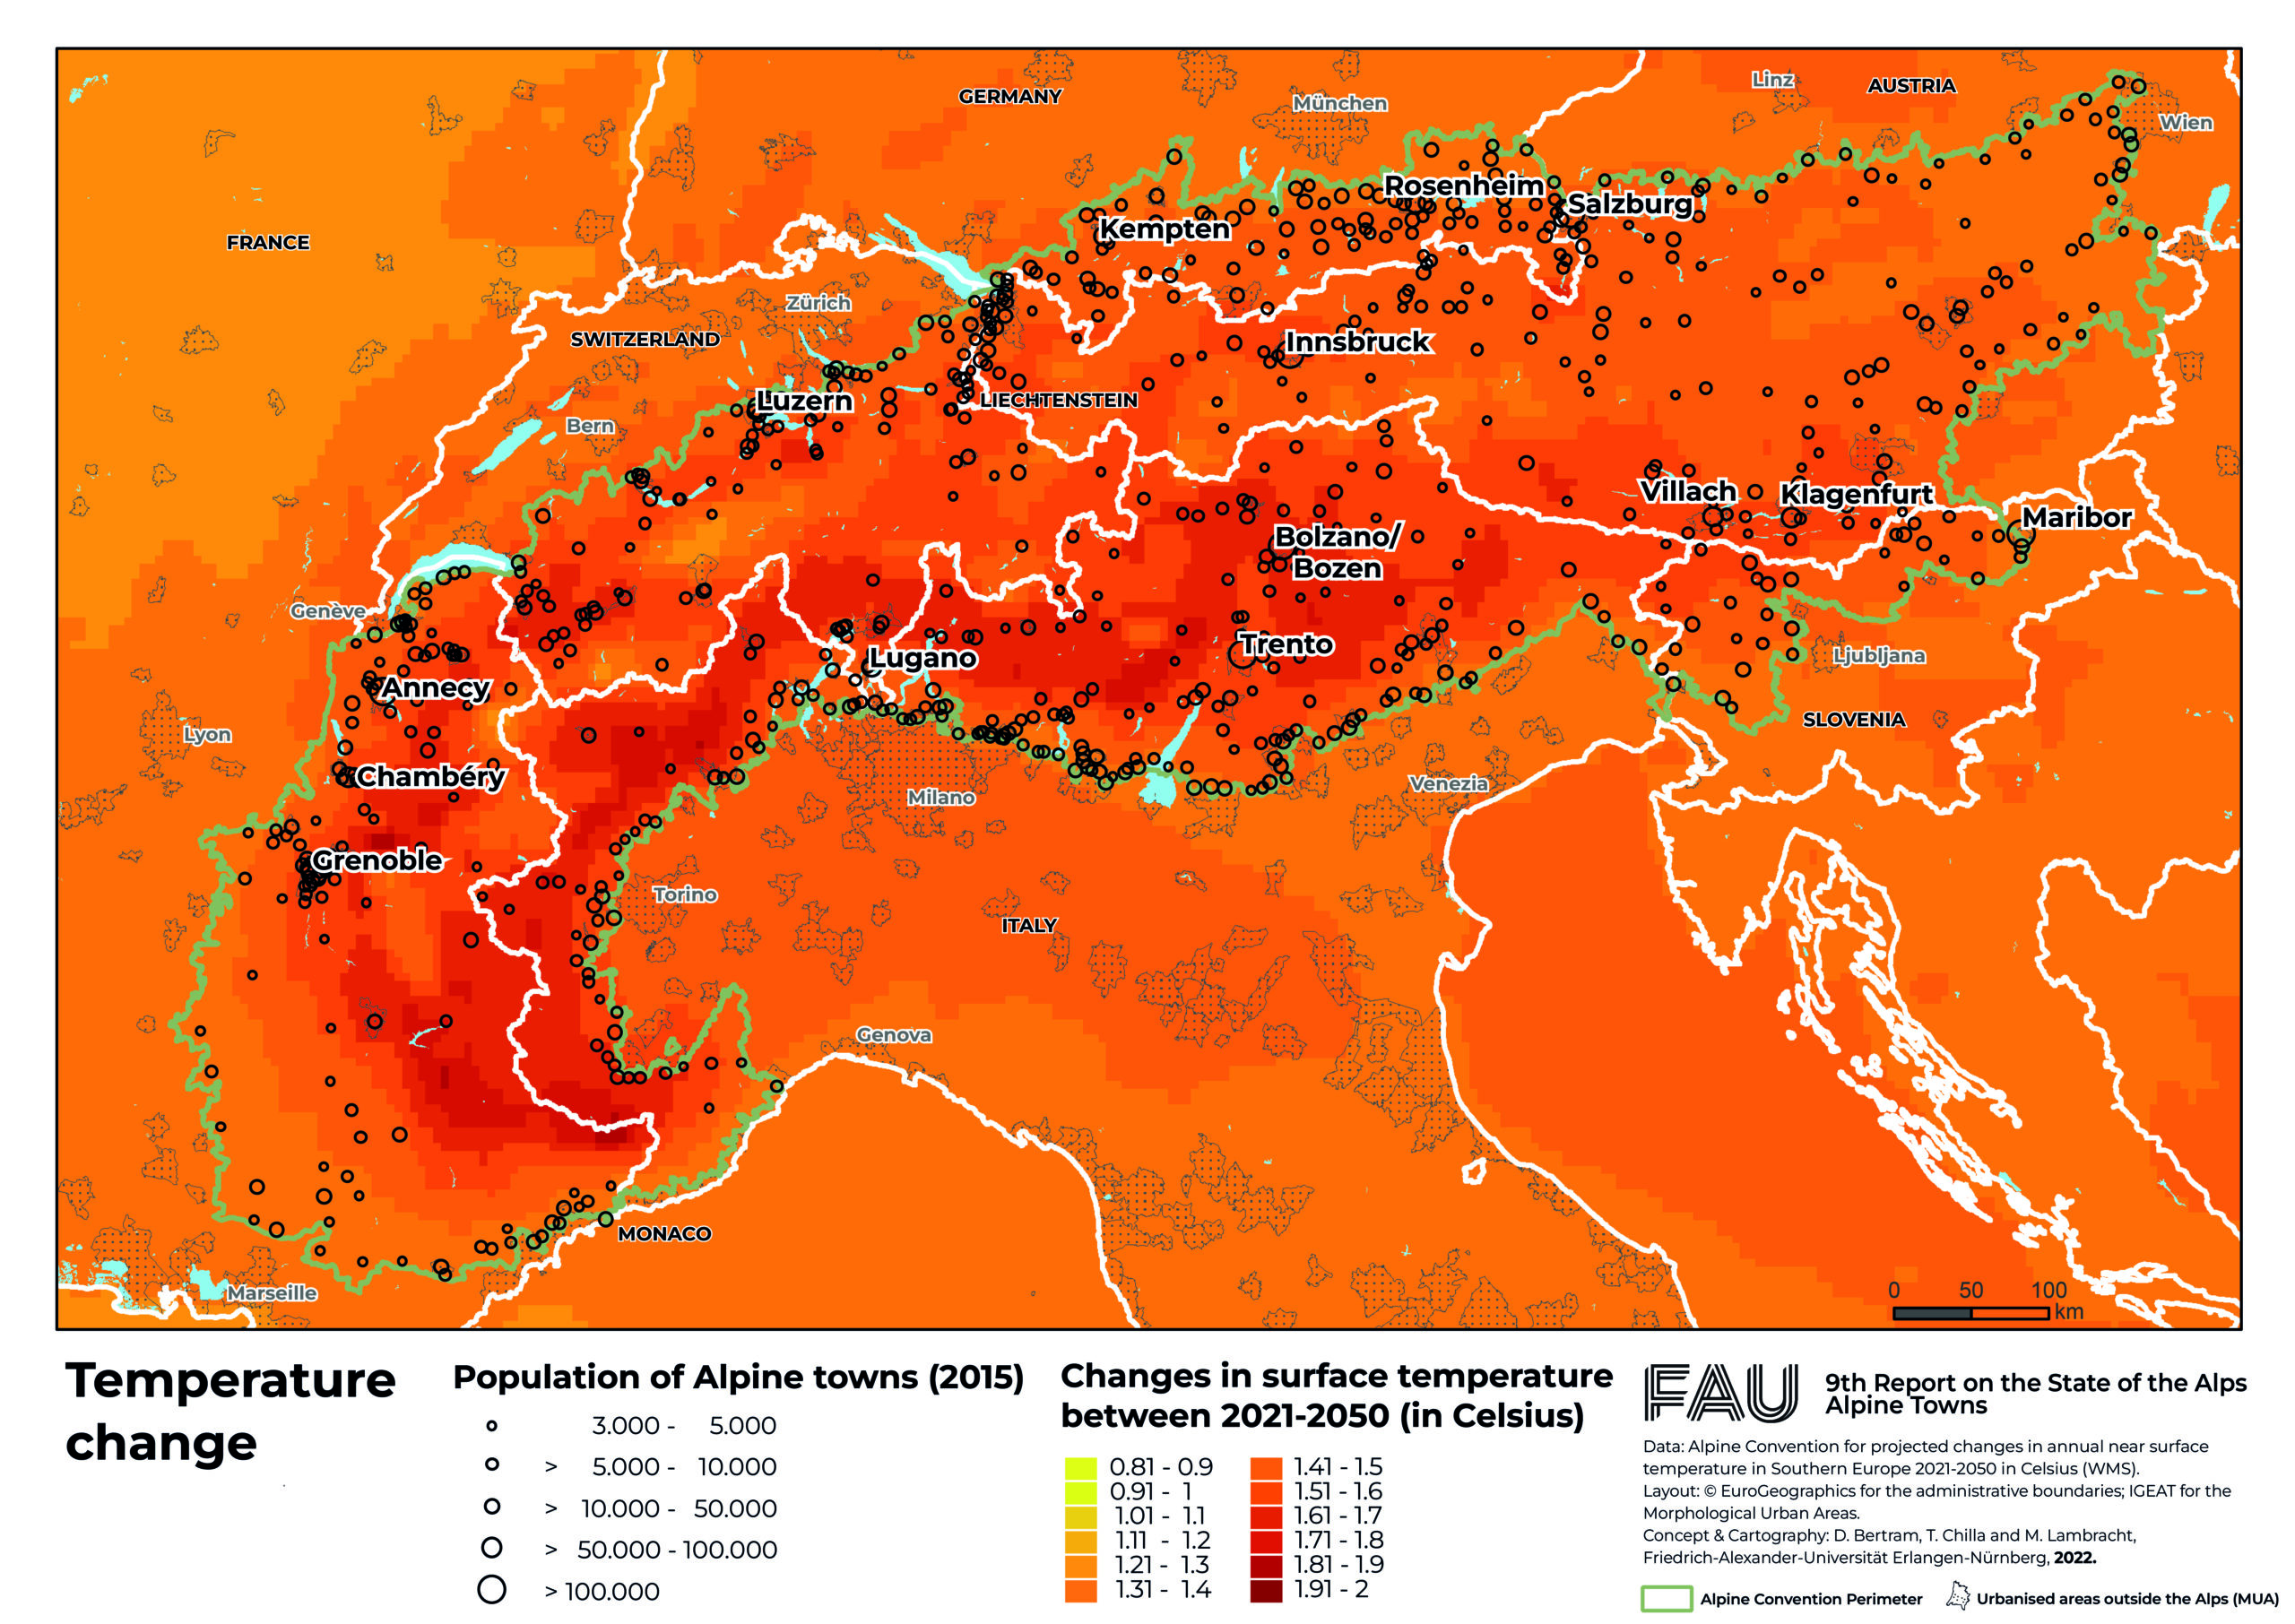
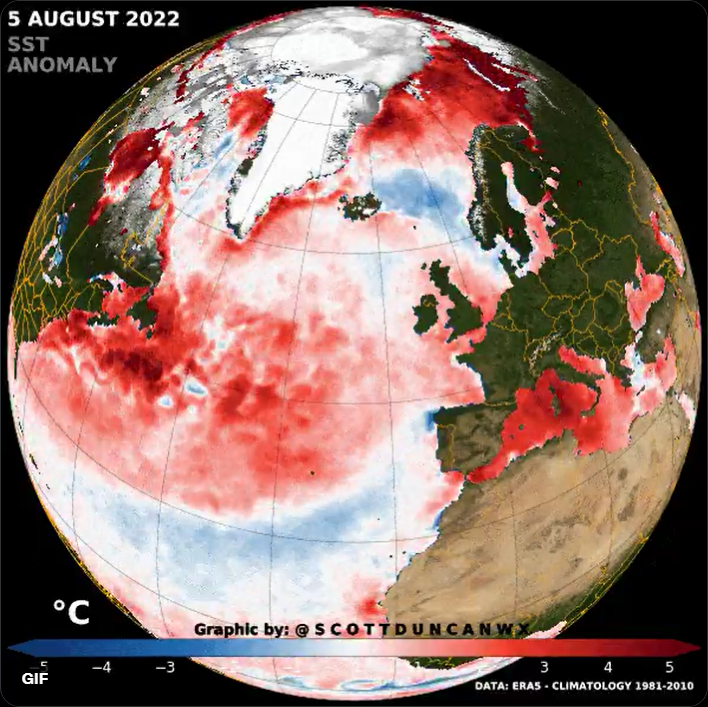
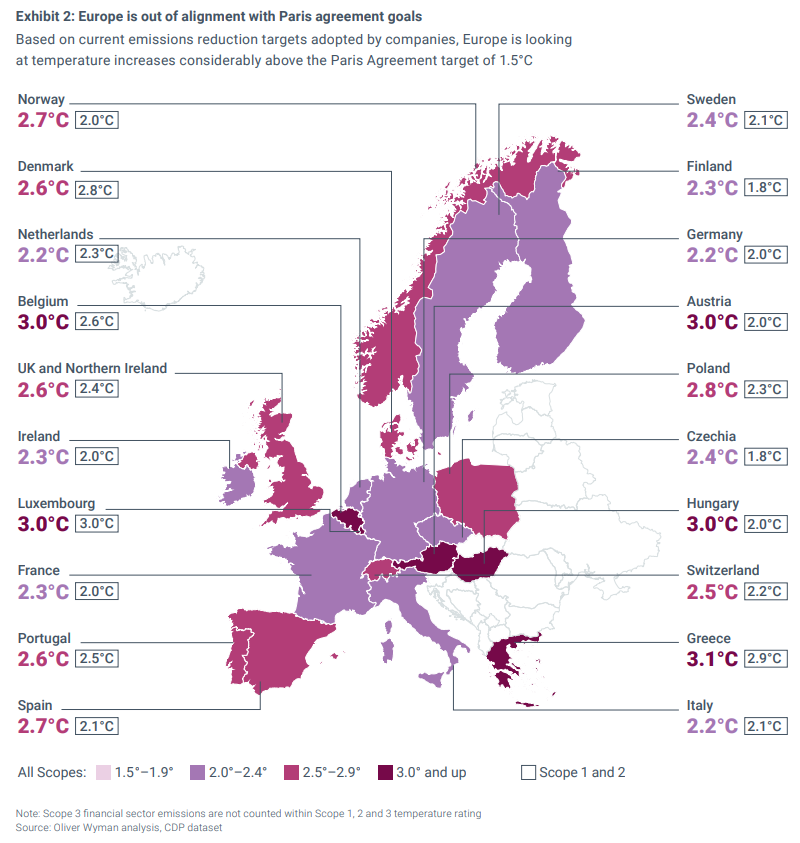
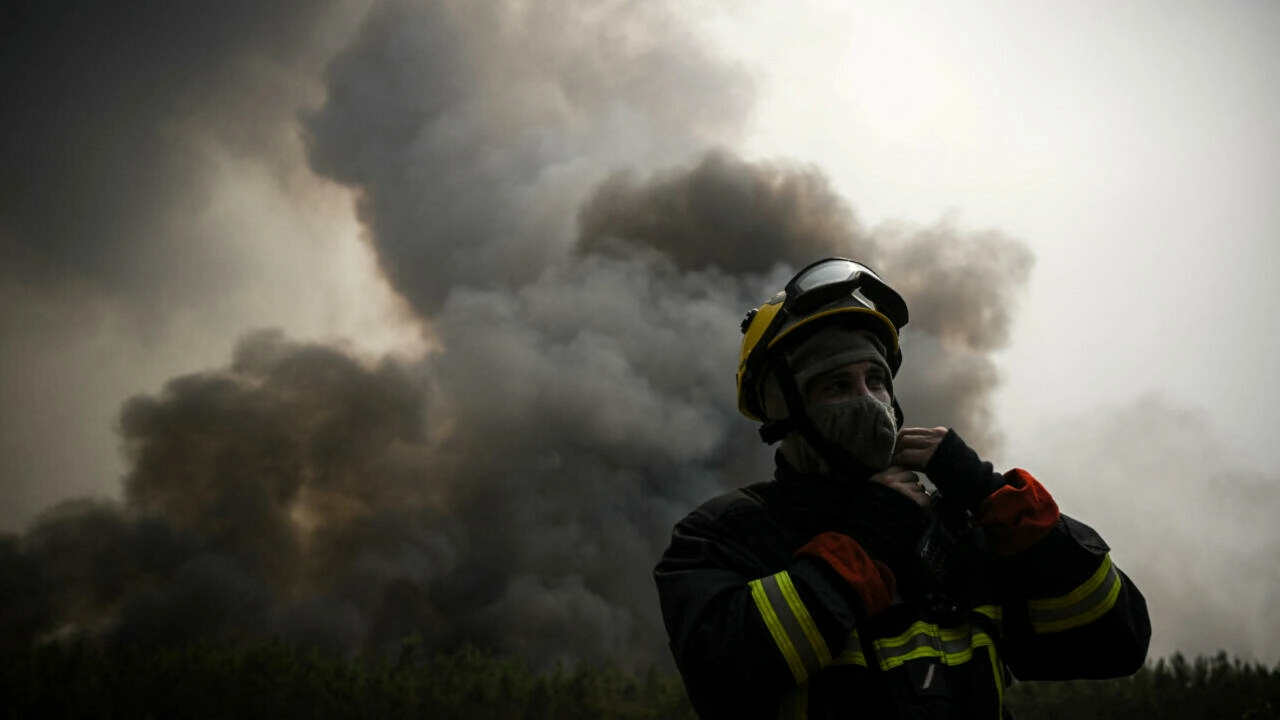
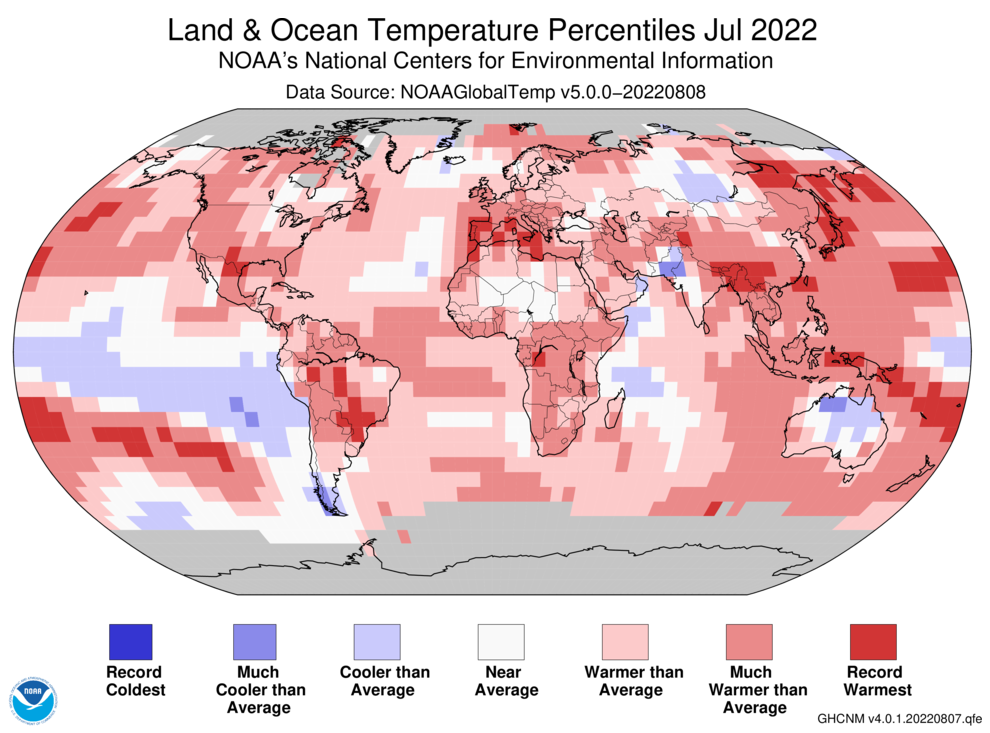
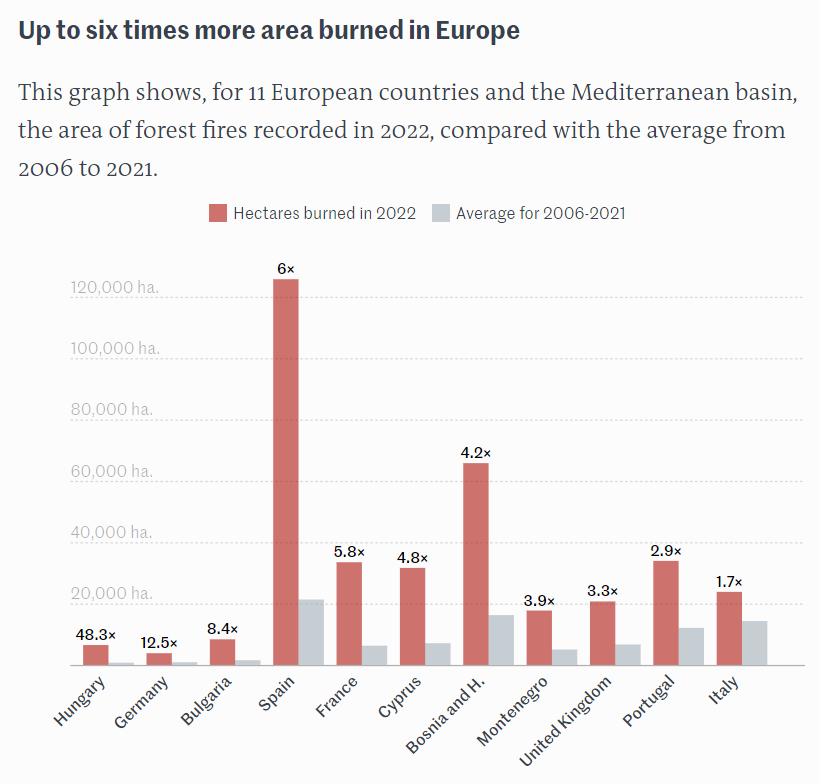
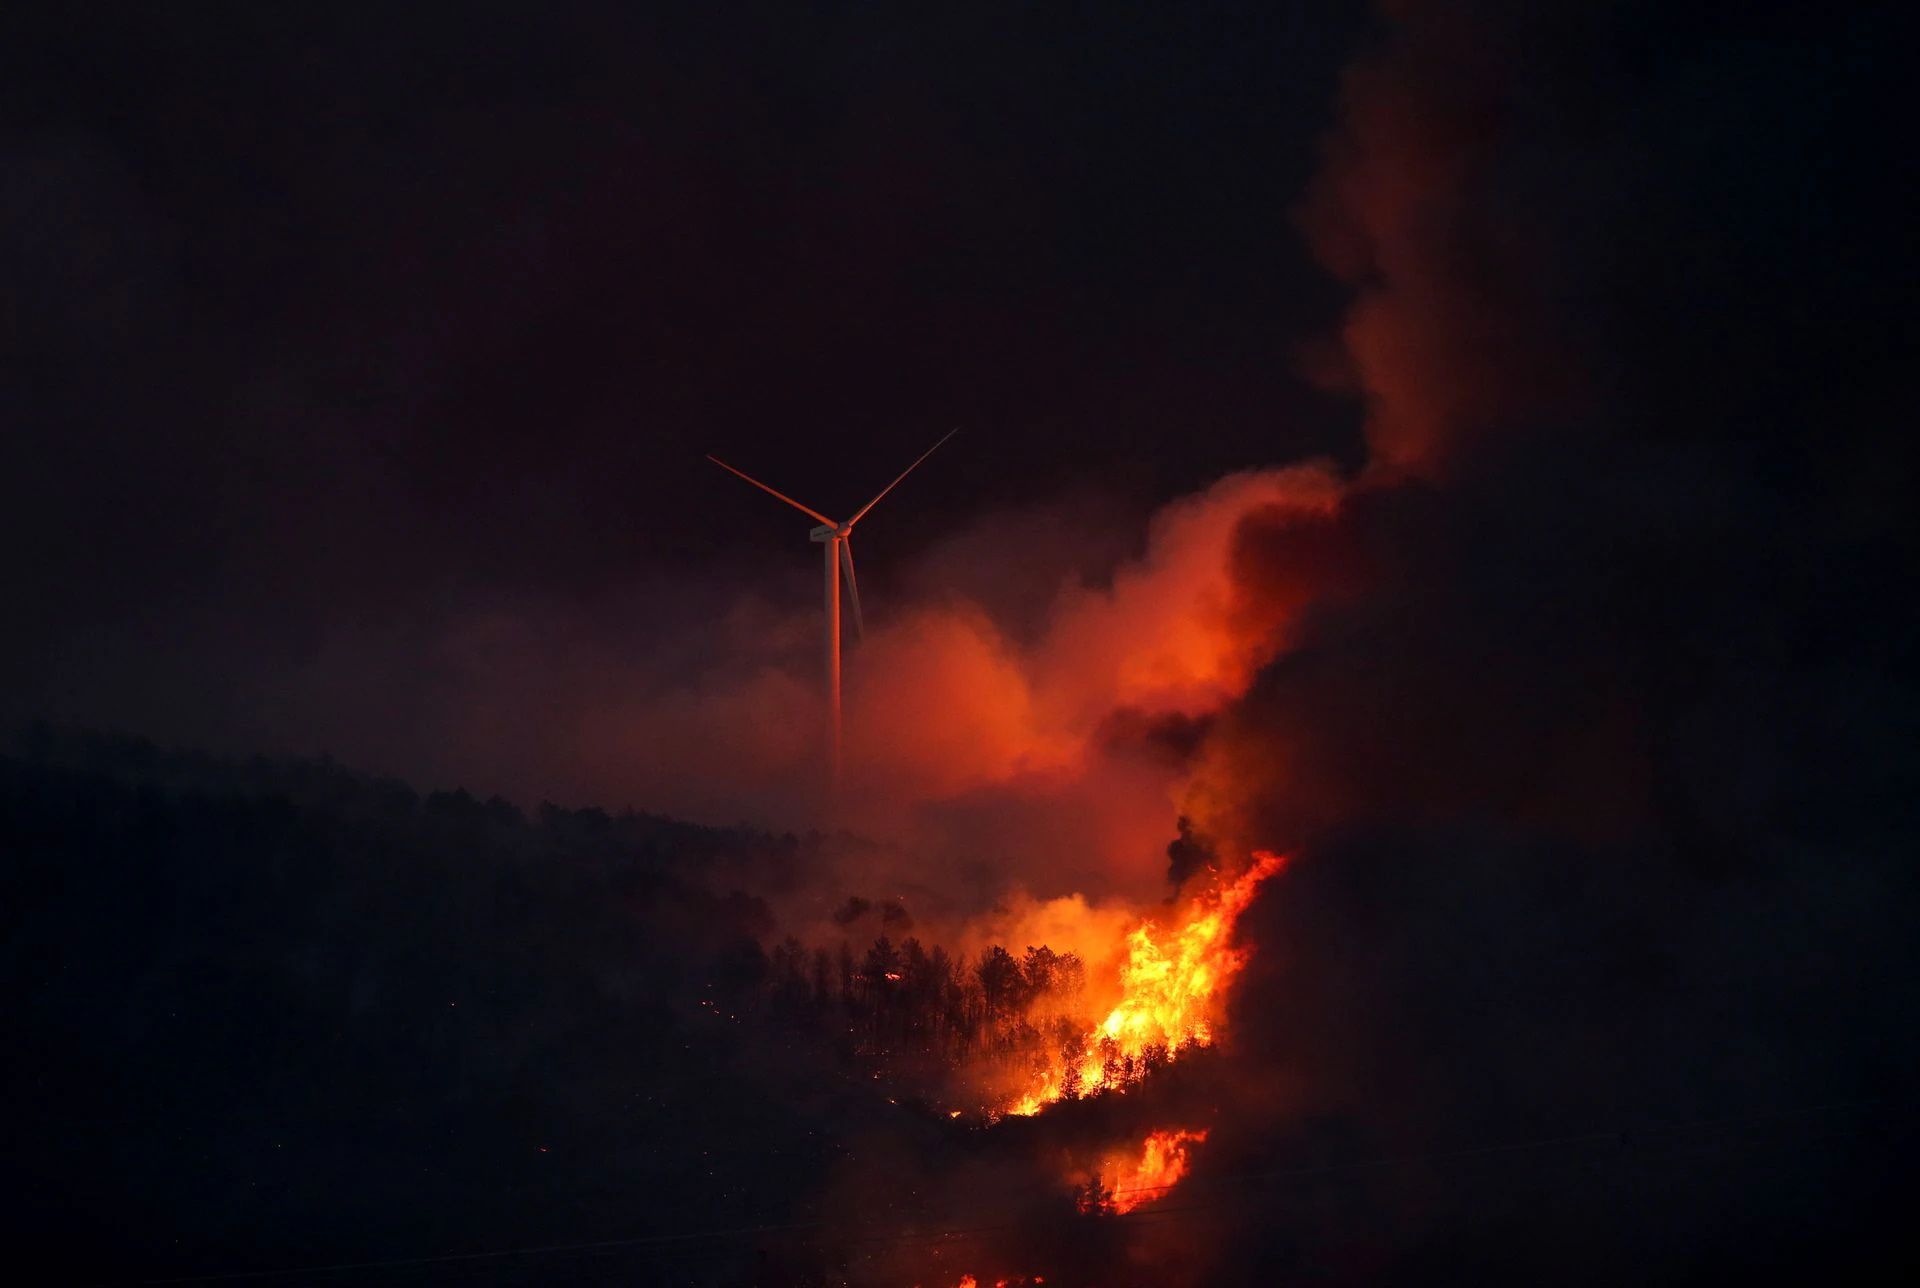
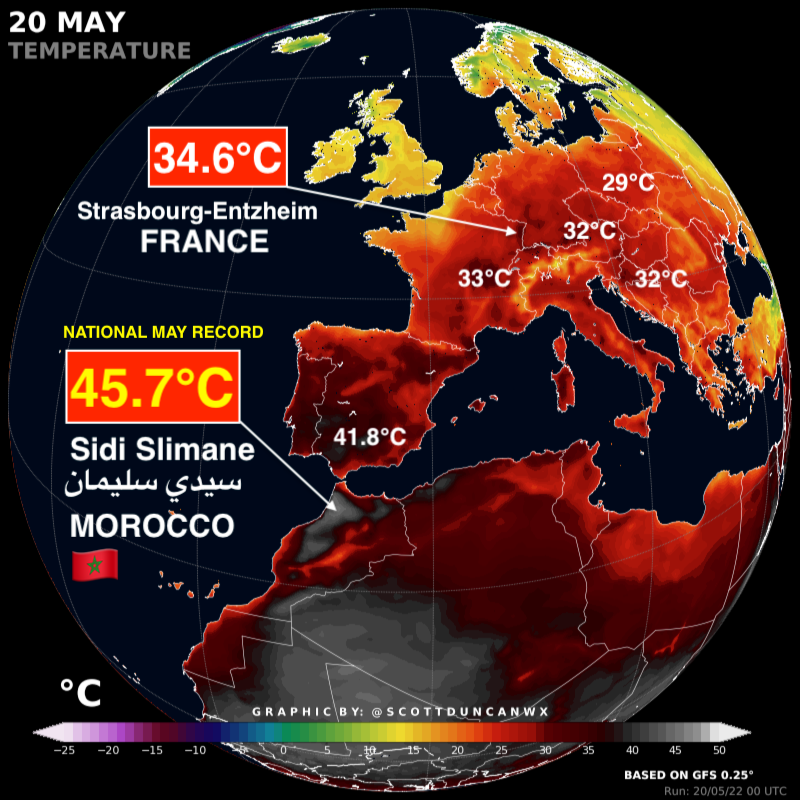
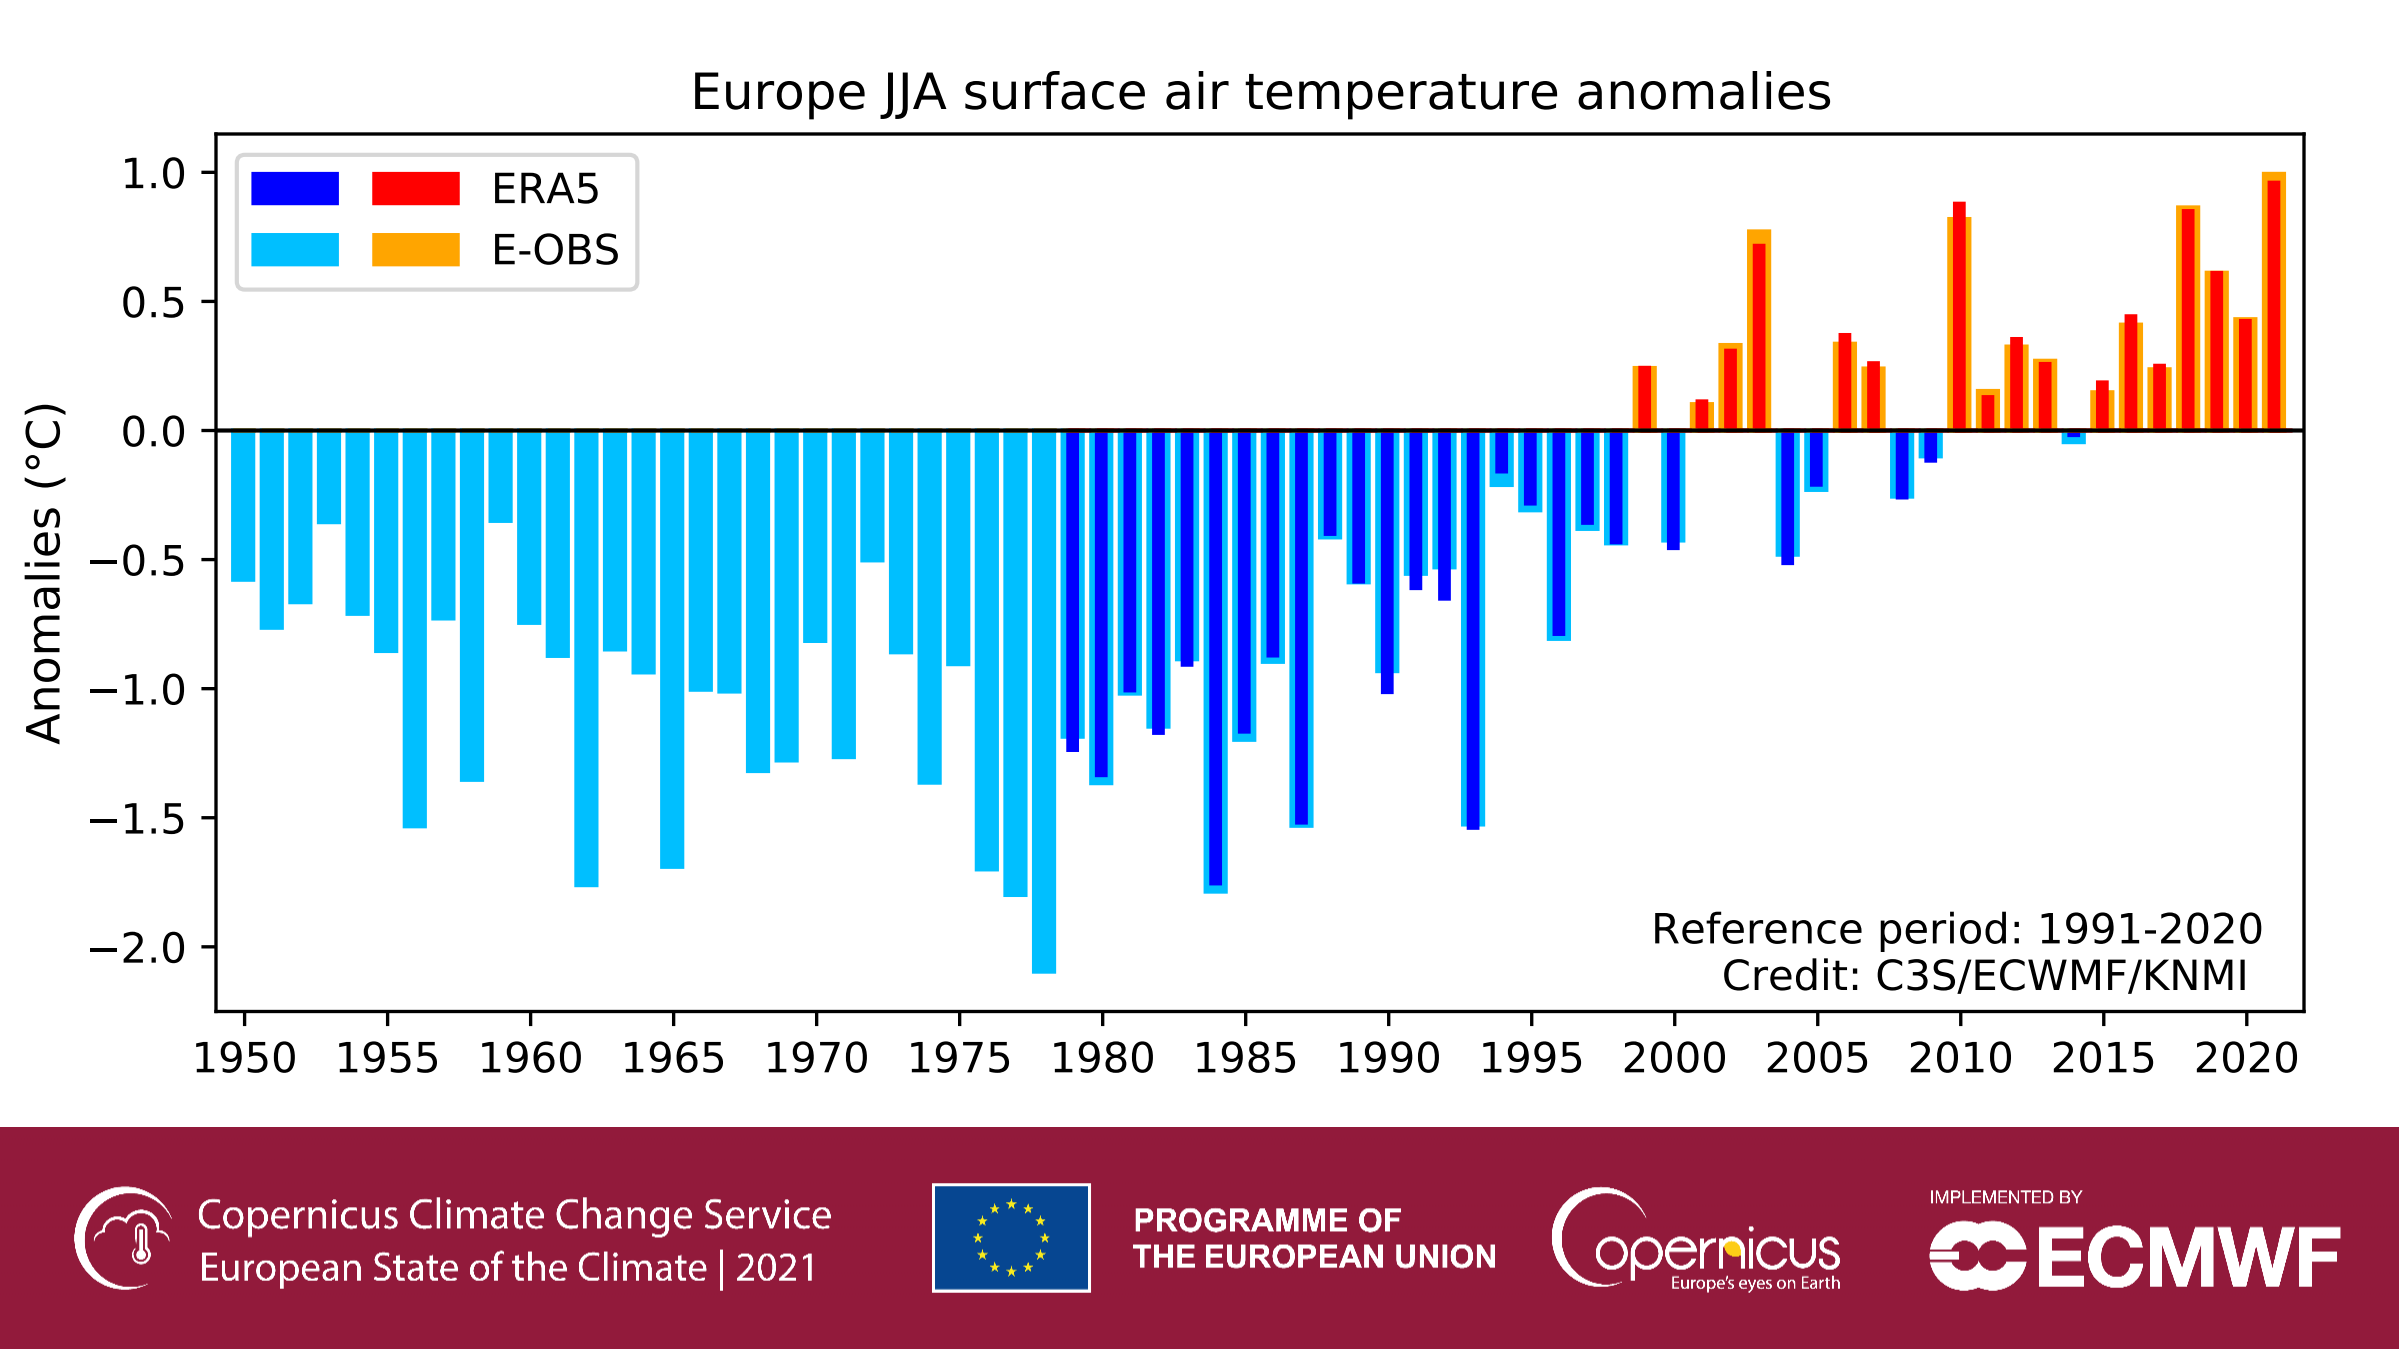
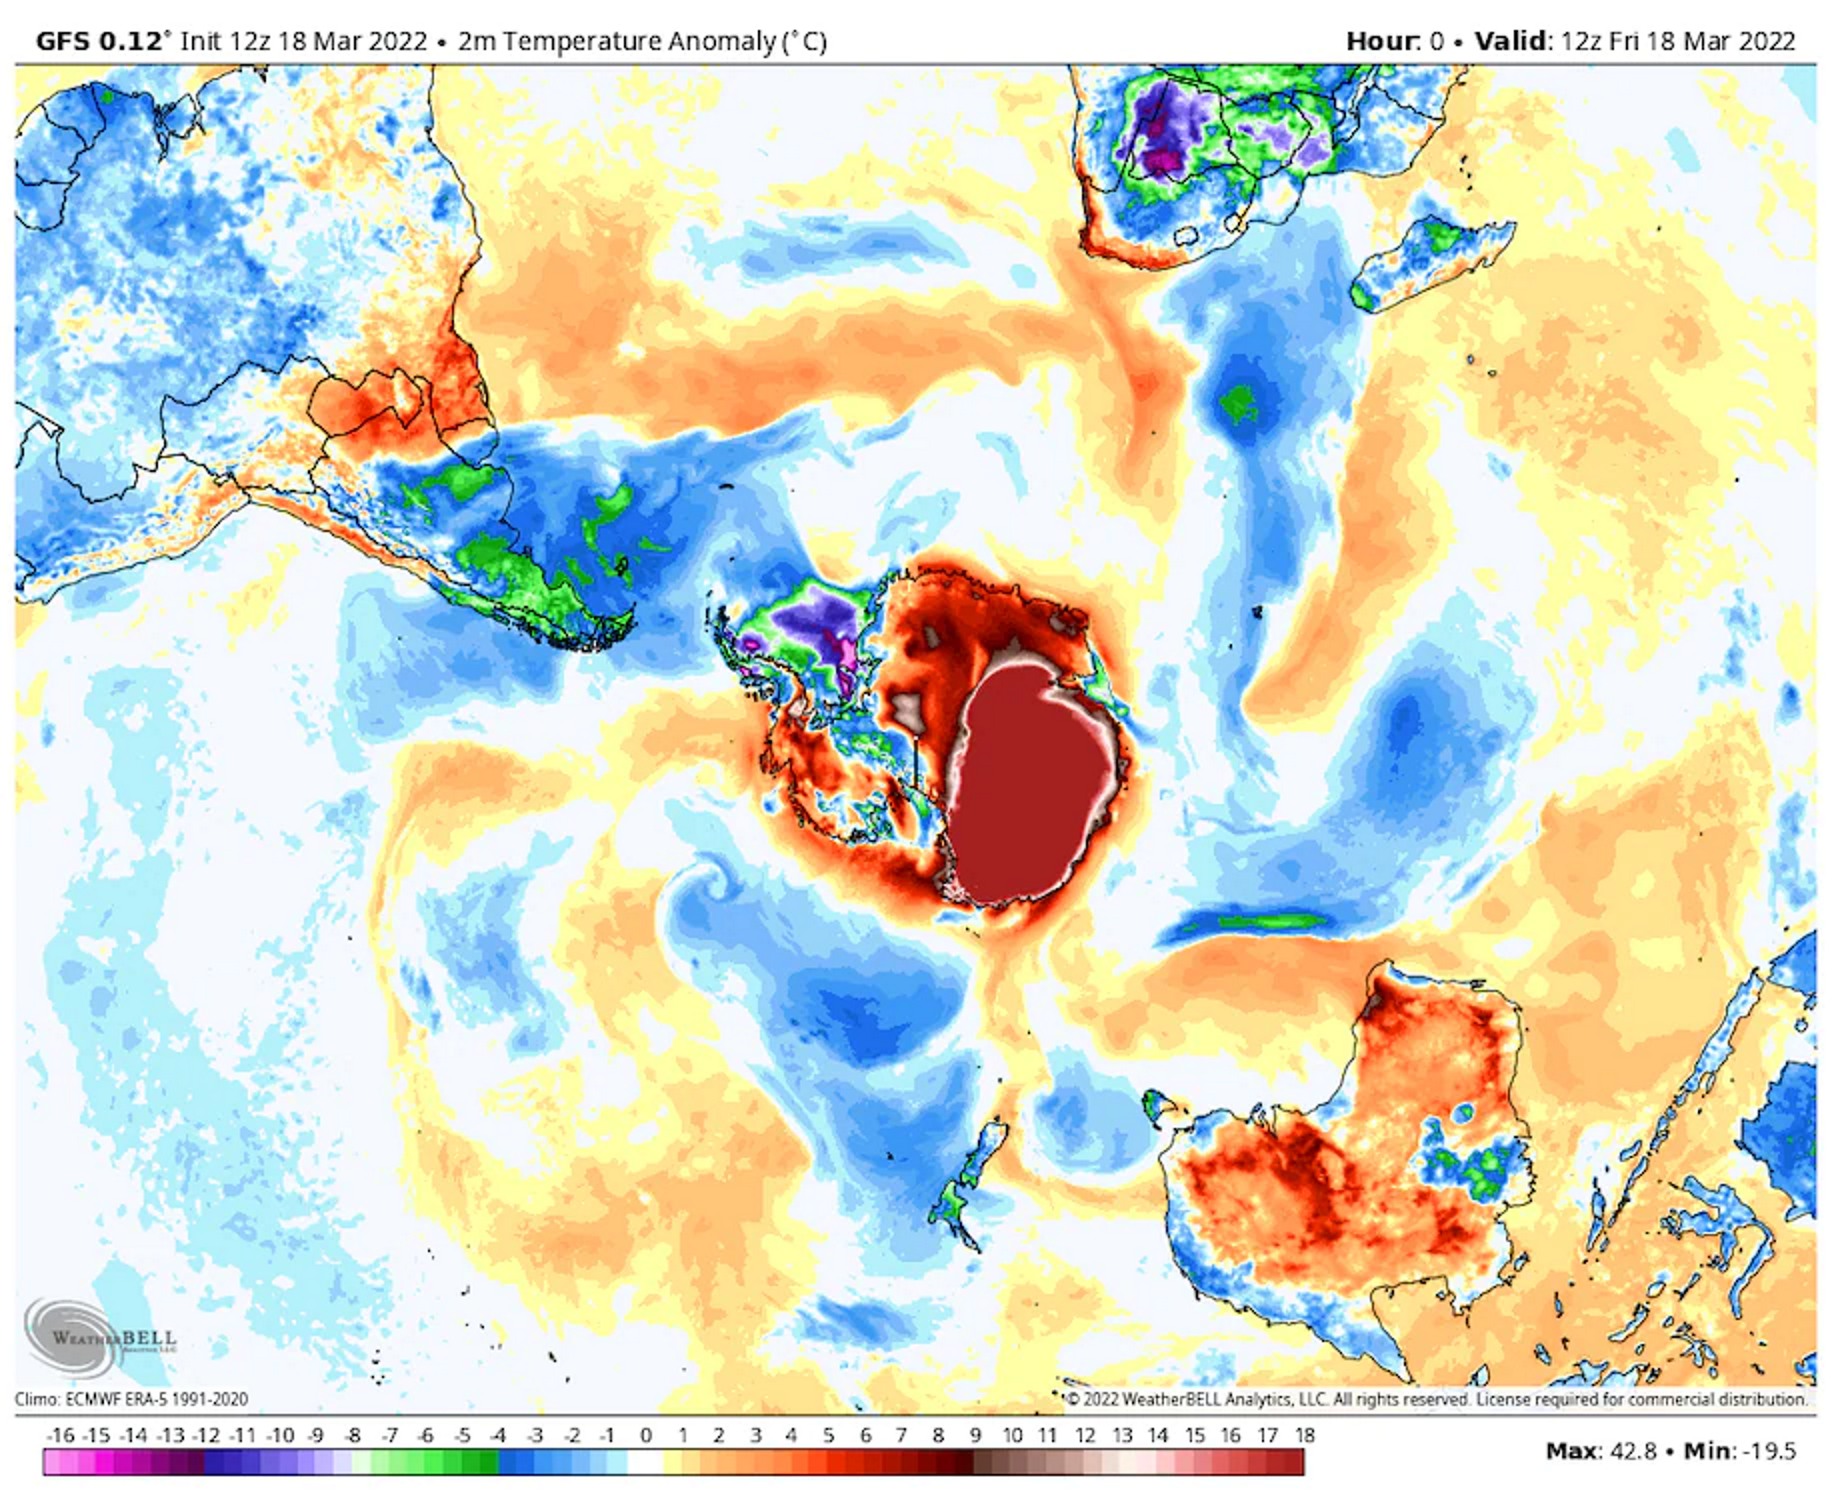
Other unprecedented climate disasters struck parts of the world that had been spared so far. Perhaps the most startling was the desiccation of Europe, as the hottest summer on record cooked off surface water and left rivers dry throughout the continent.
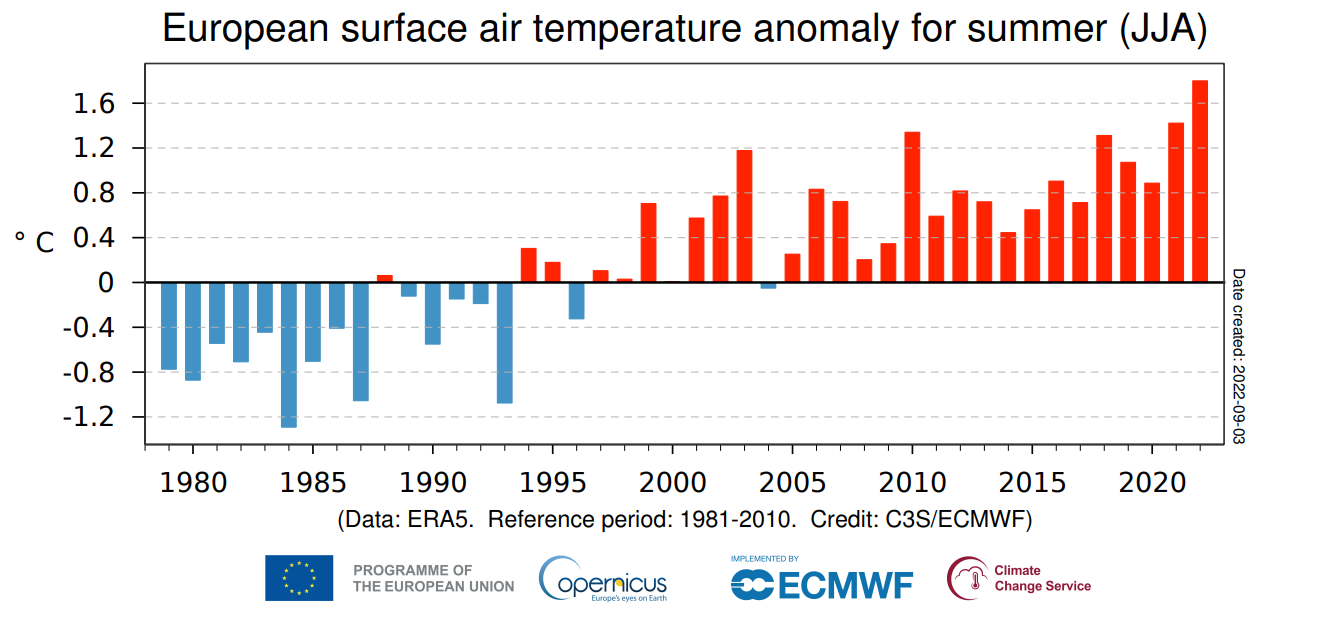
Freja Vamborg, a senior scientist with the Copernicus Climate Change Service said, “An intense series of heatwaves across Europe paired with unusually dry conditions, have led to a summer of extremes with records in terms of temperature, drought and fire activity in many parts of Europe, affecting society and nature in various ways. The data shows that we’ve not only had record August temperatures for Europe but also for summer, with the previous summer record only being one year old.”
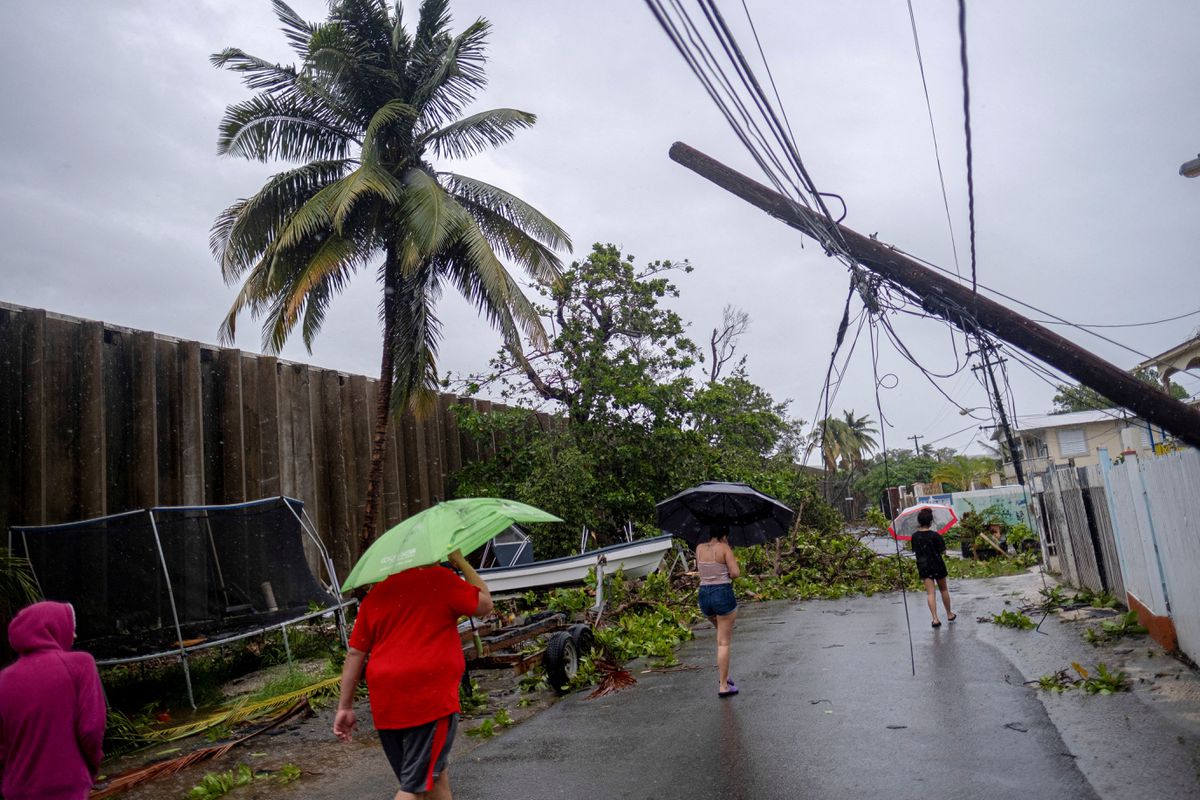
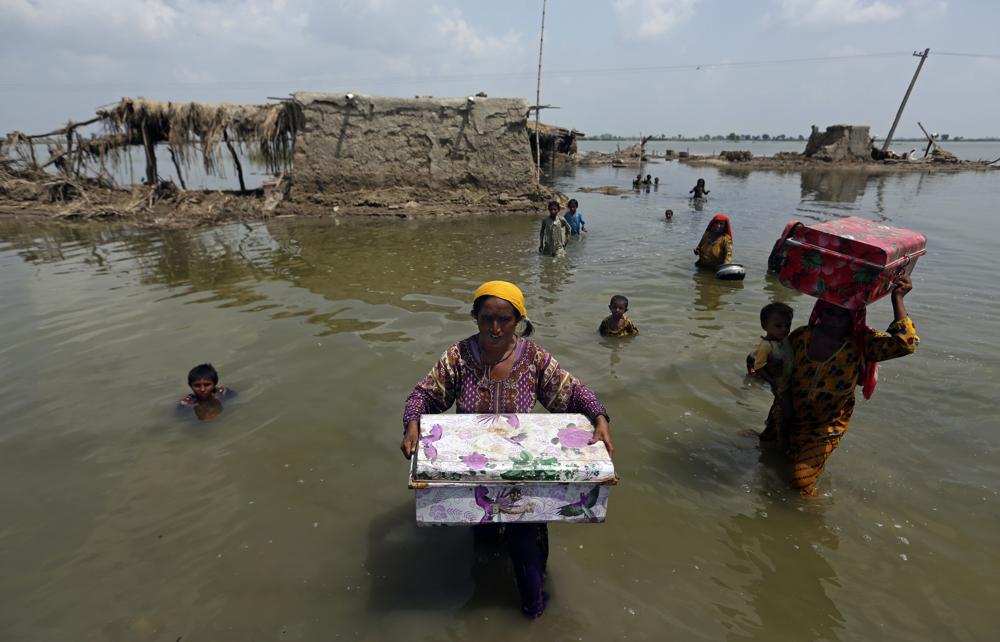
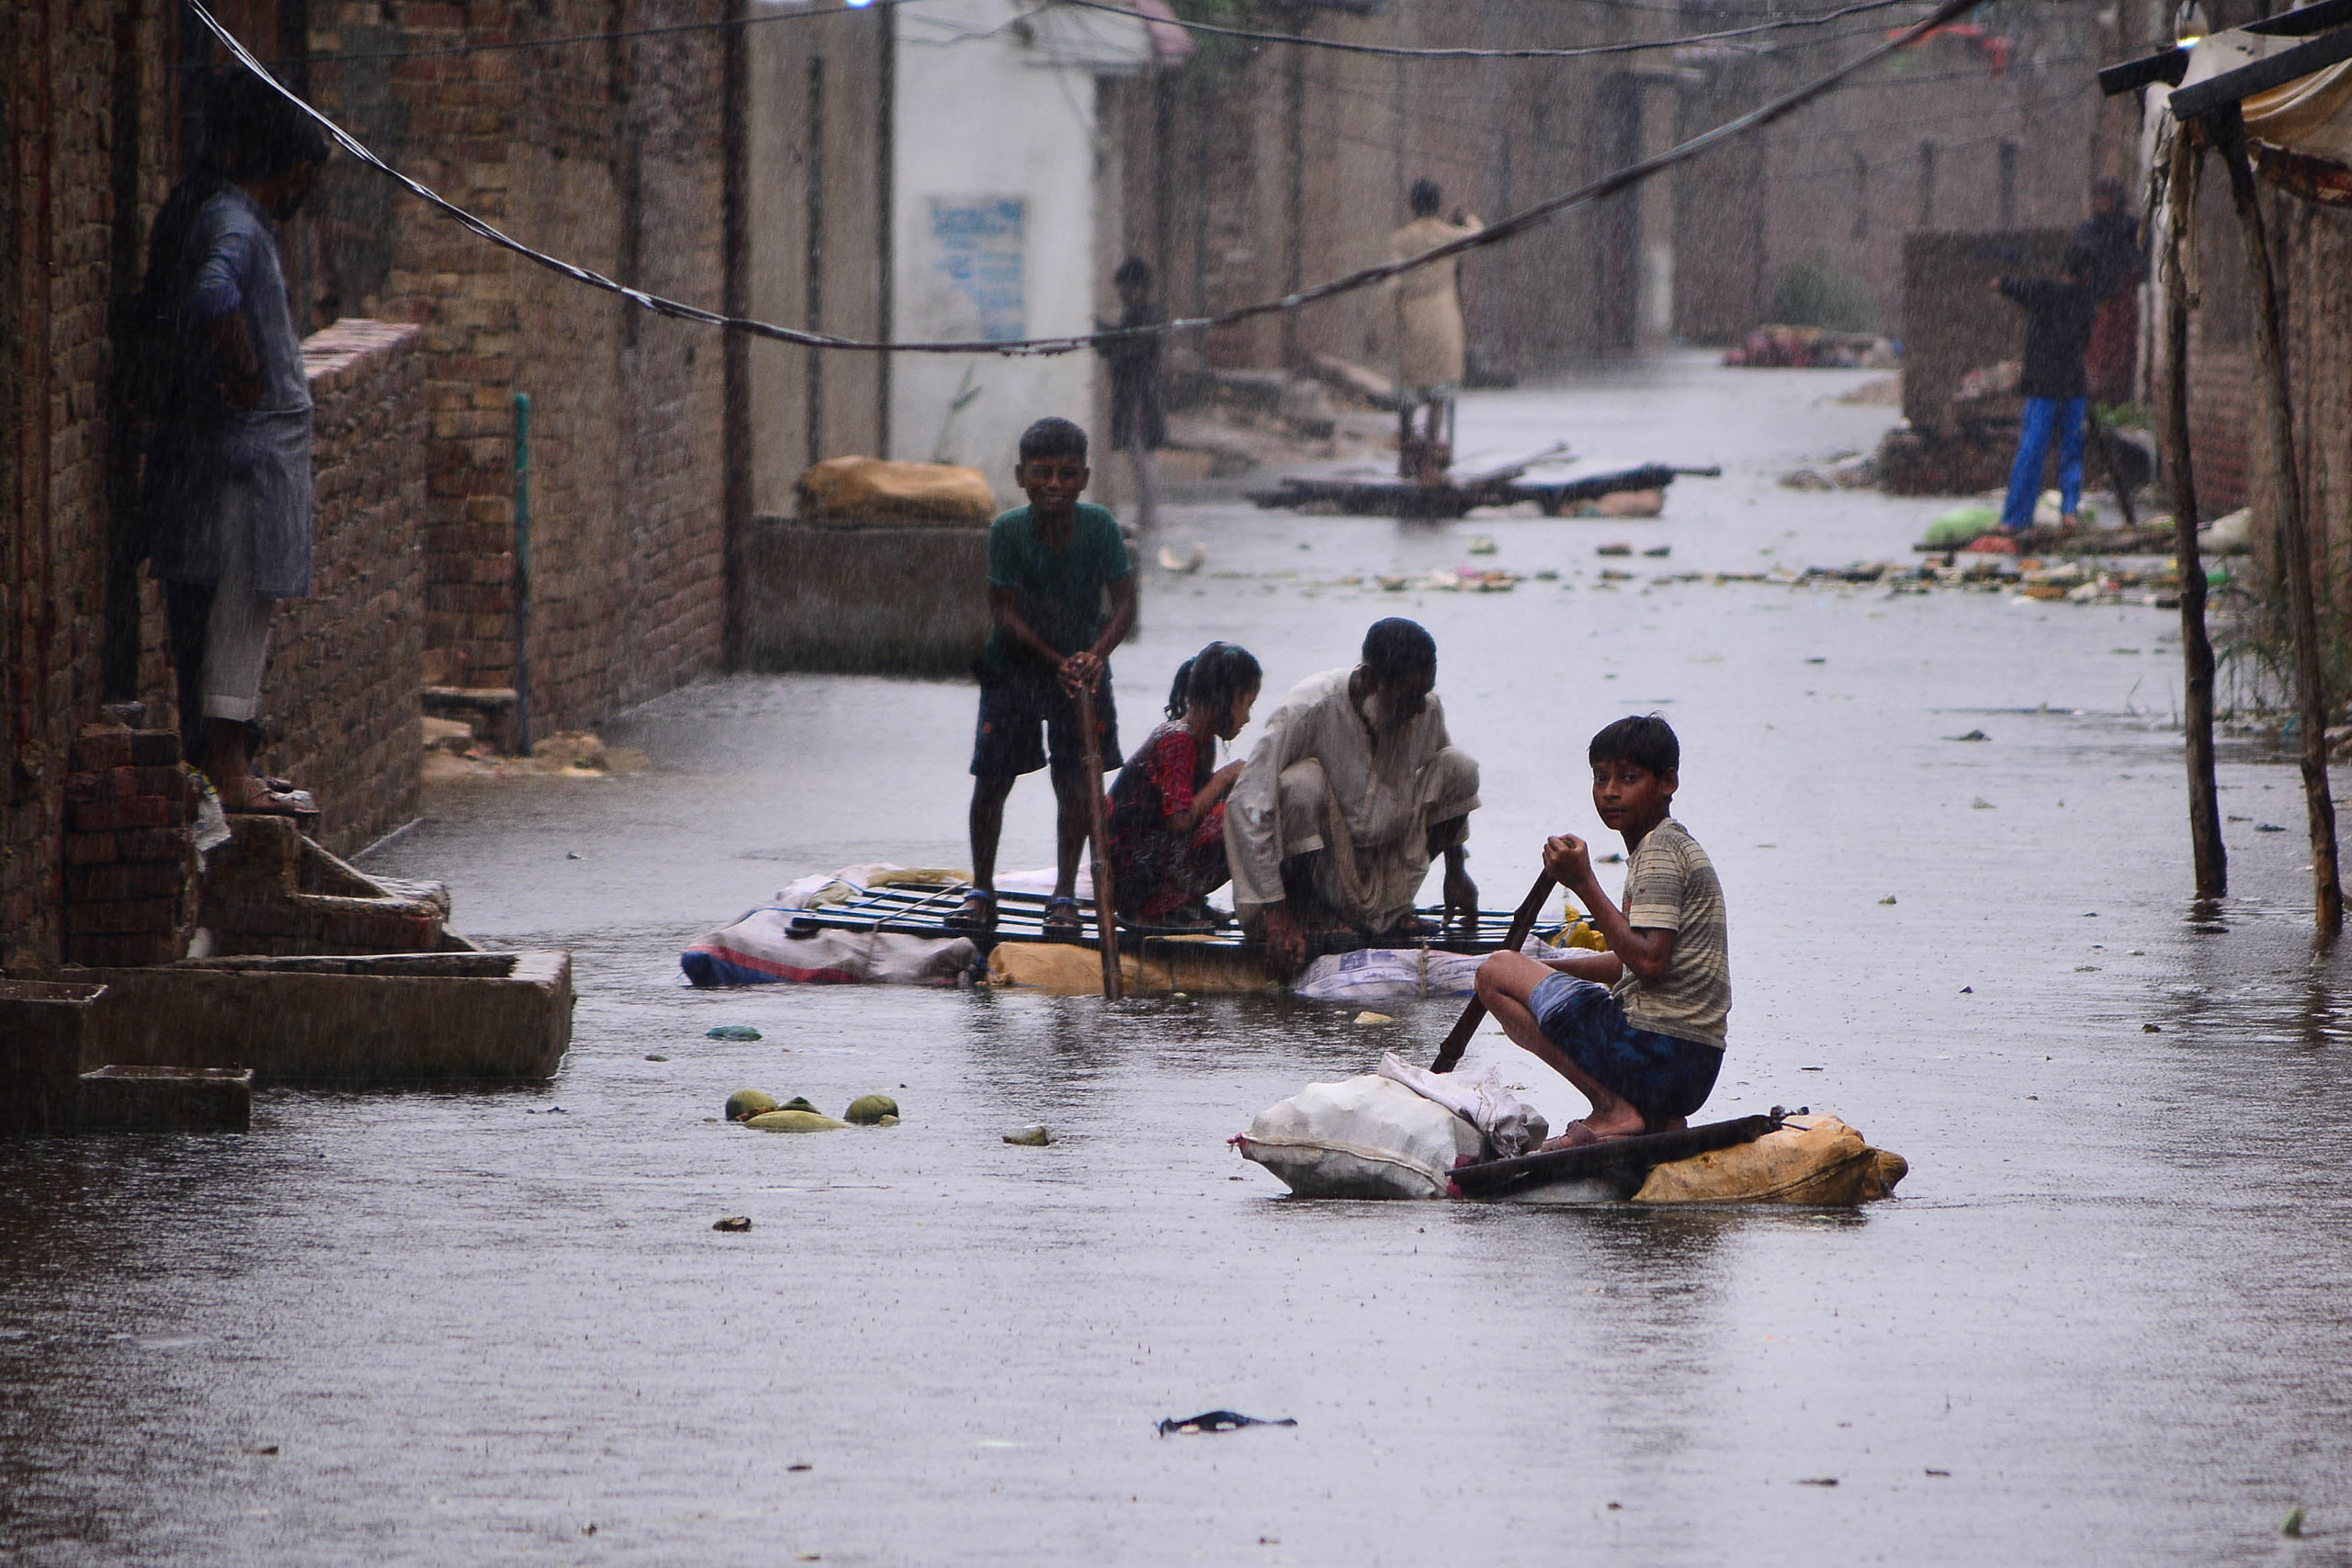
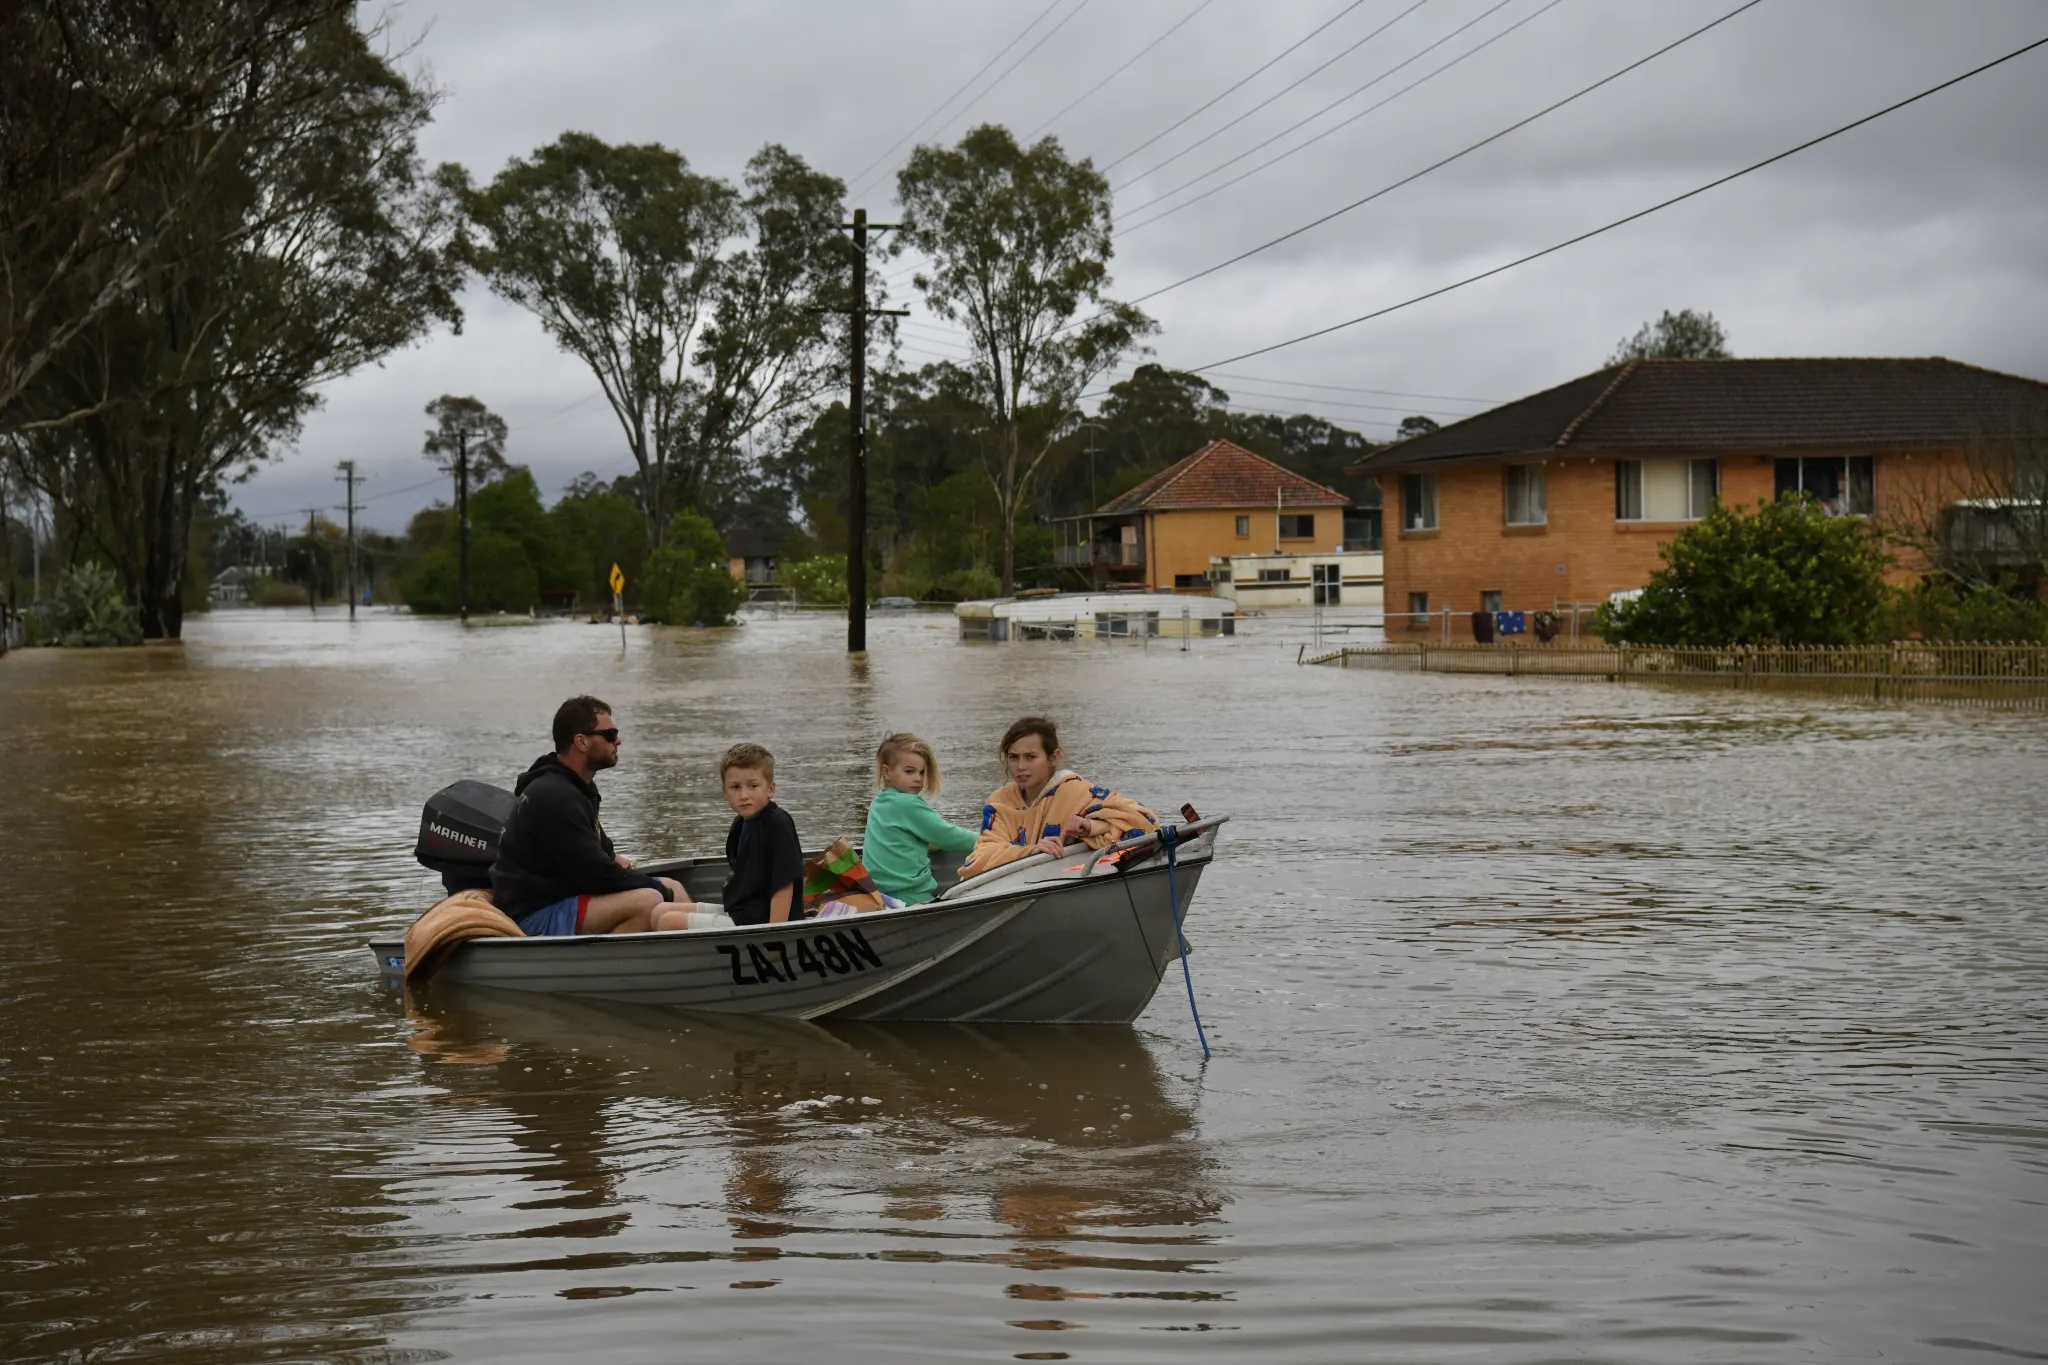
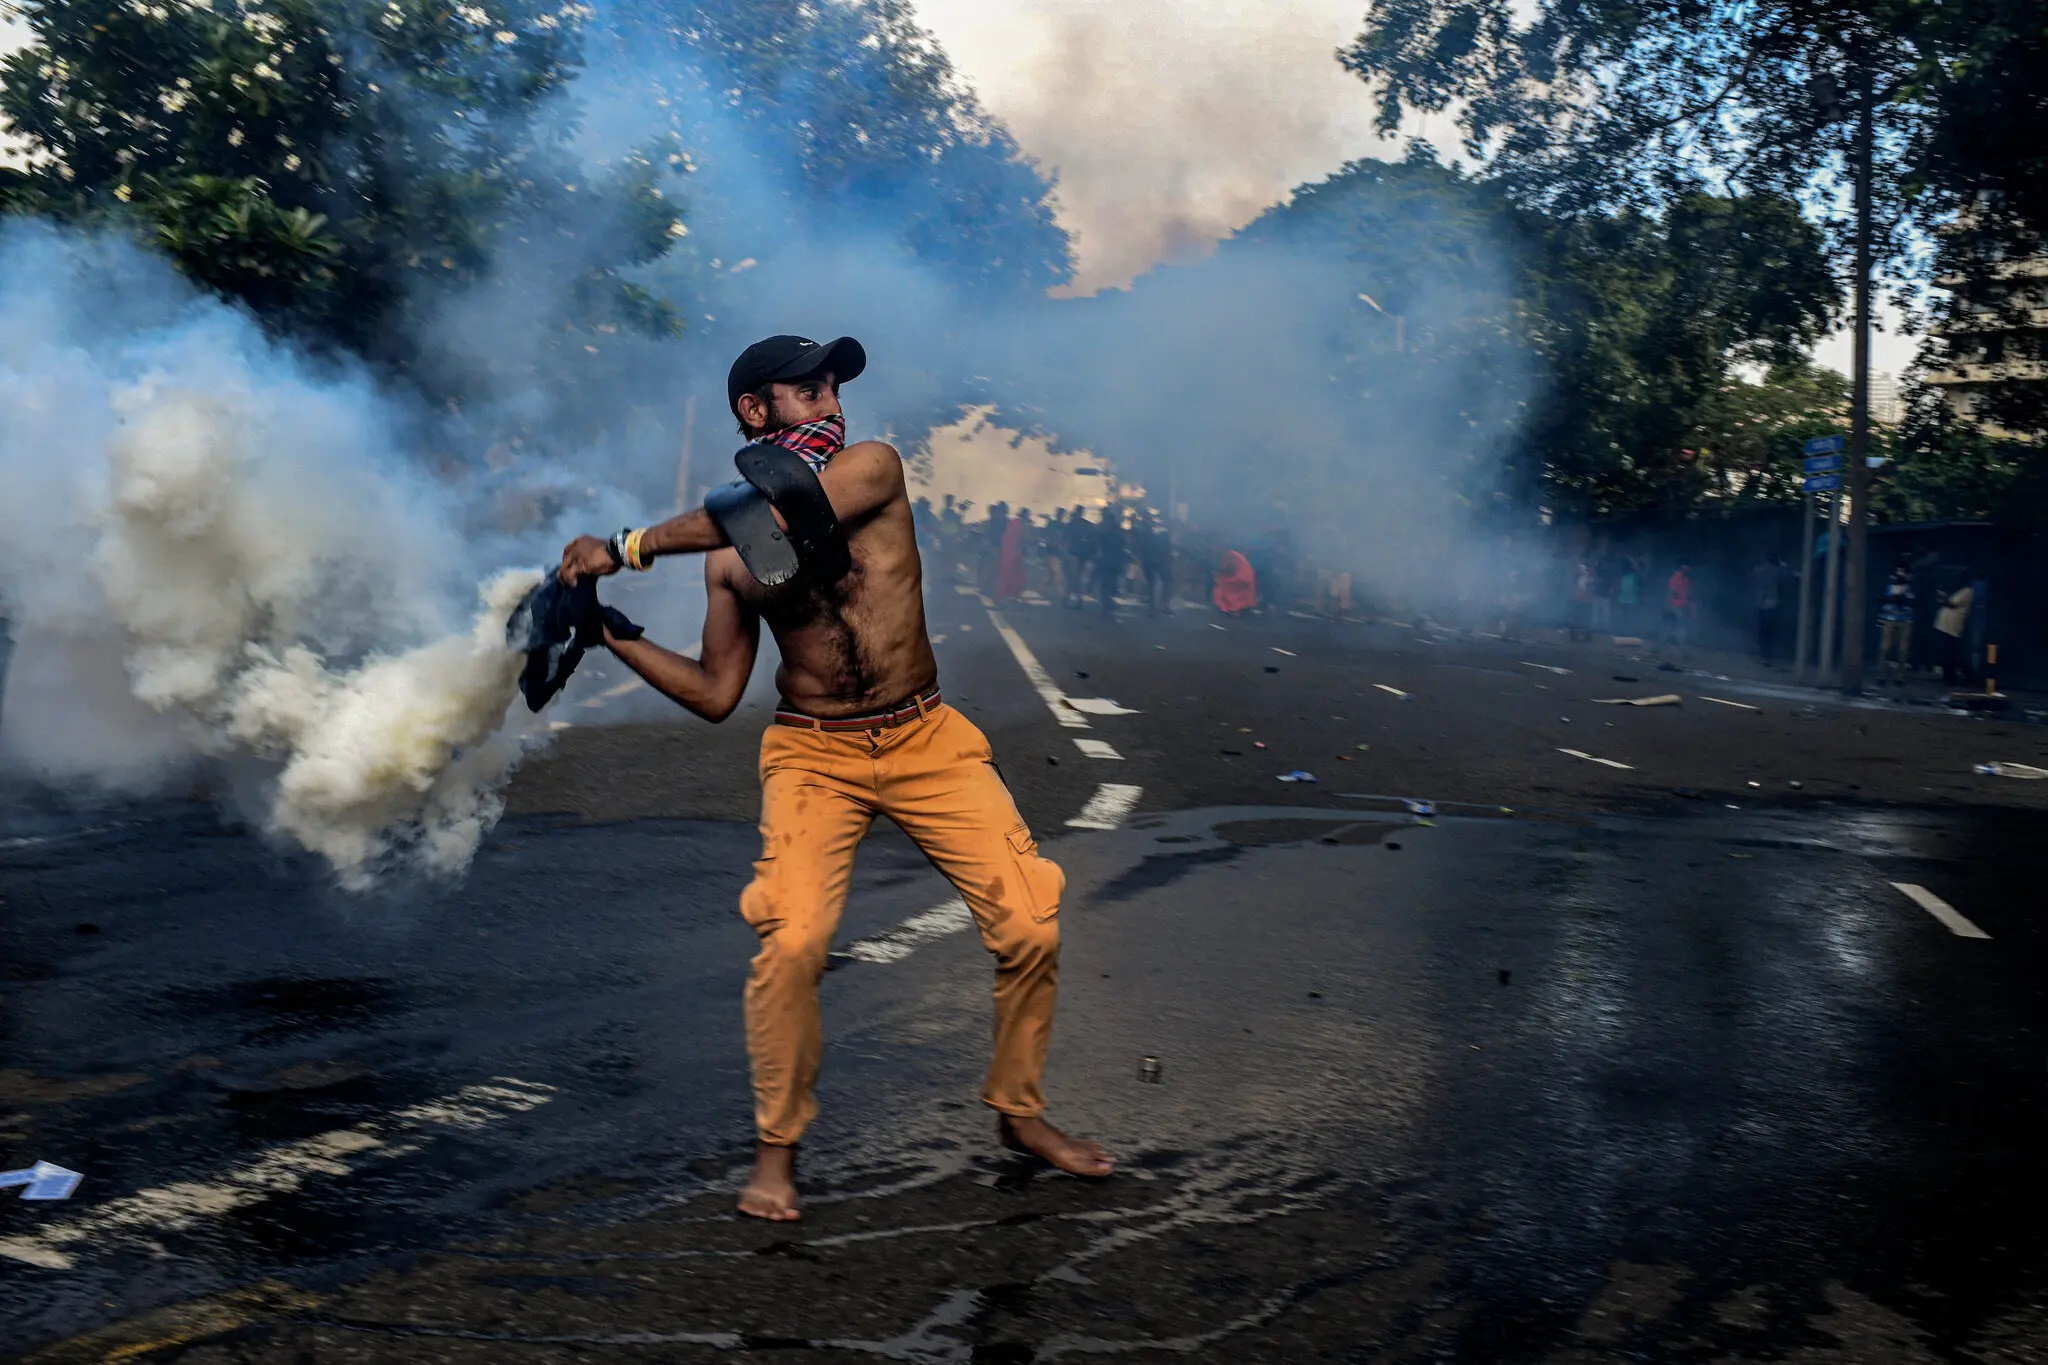
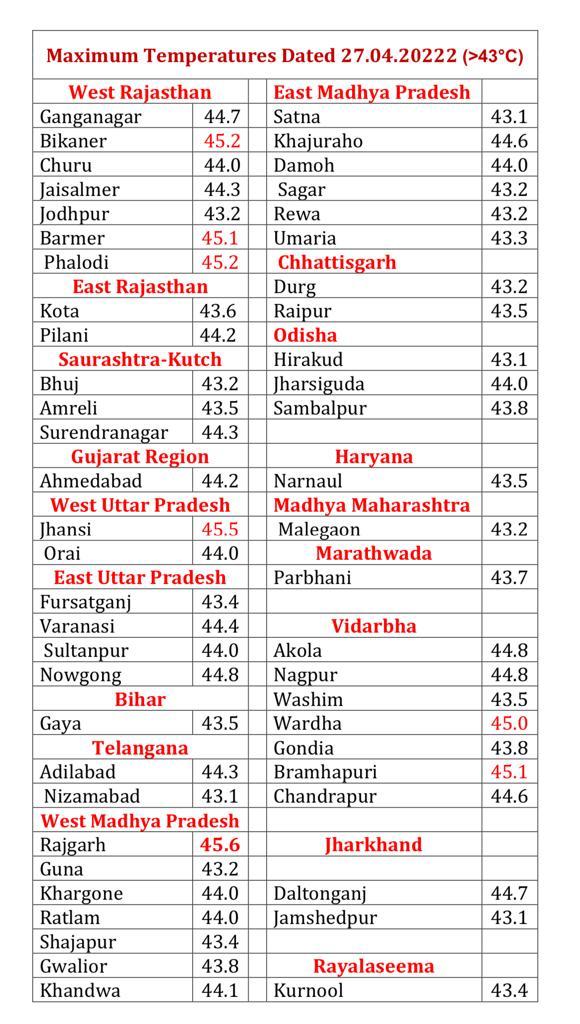
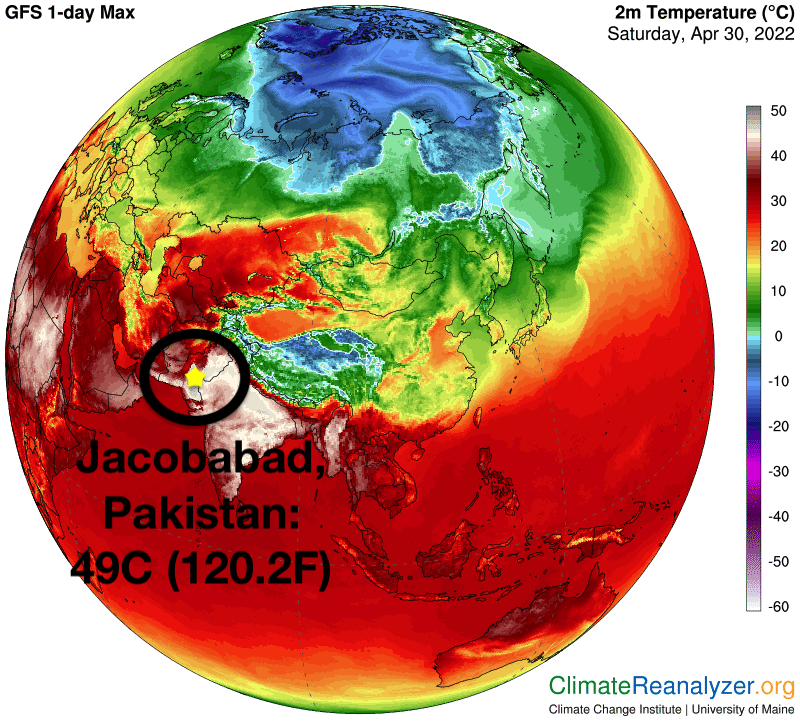
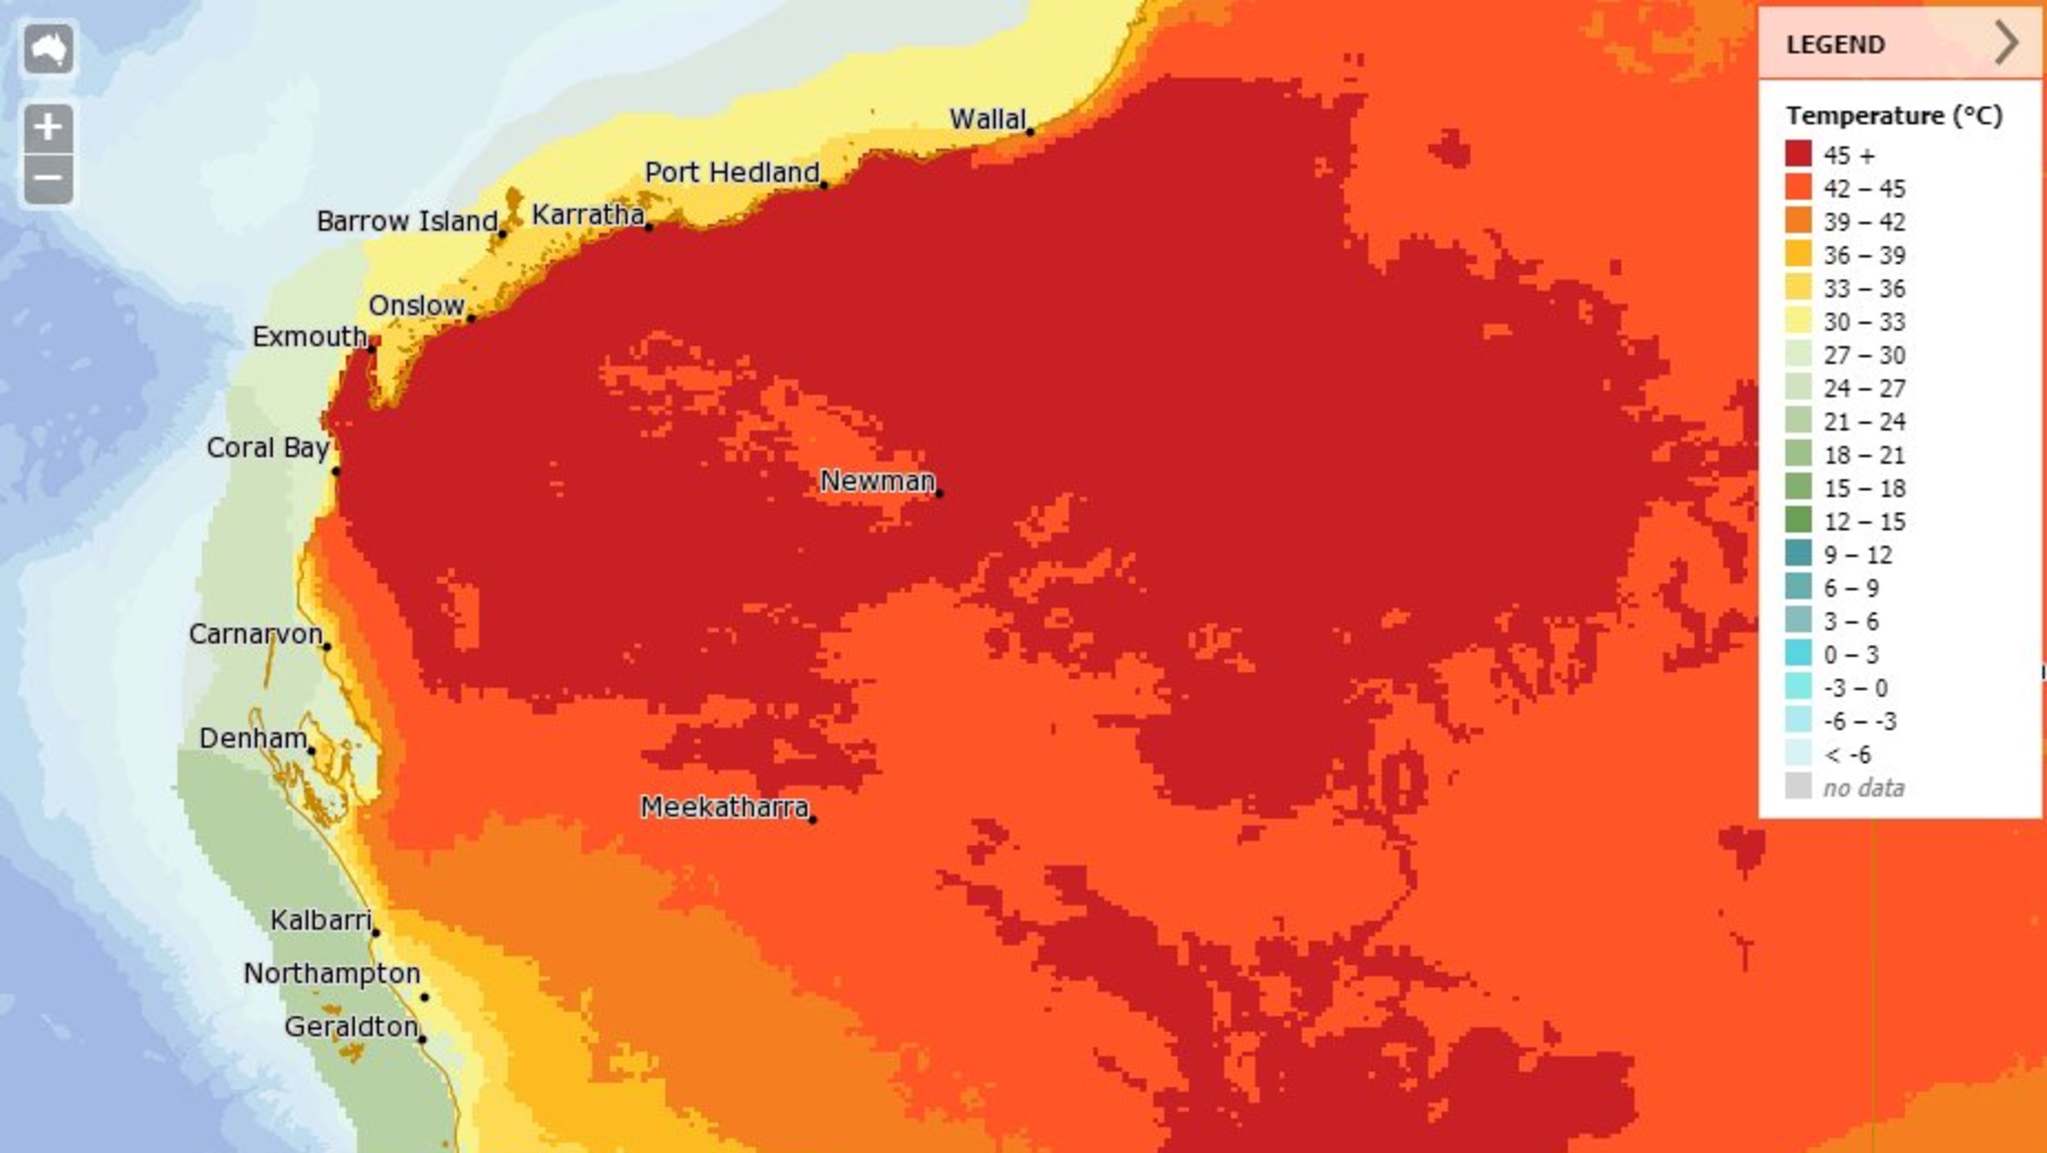
On the other side of the planet, Australia experienced two record-breaking flooding events, in March and October. But the most catastrophic flooding happened in Pakistan. After suffering through an unprecedented spring heatwave that saw weeks of temperatures repeatedly hitting nearly 50°C (122°F), record floods submerged one-third of the country in August 2022. By December, 20 million flood victims needed immediate aid to survive the looming harsh winter.

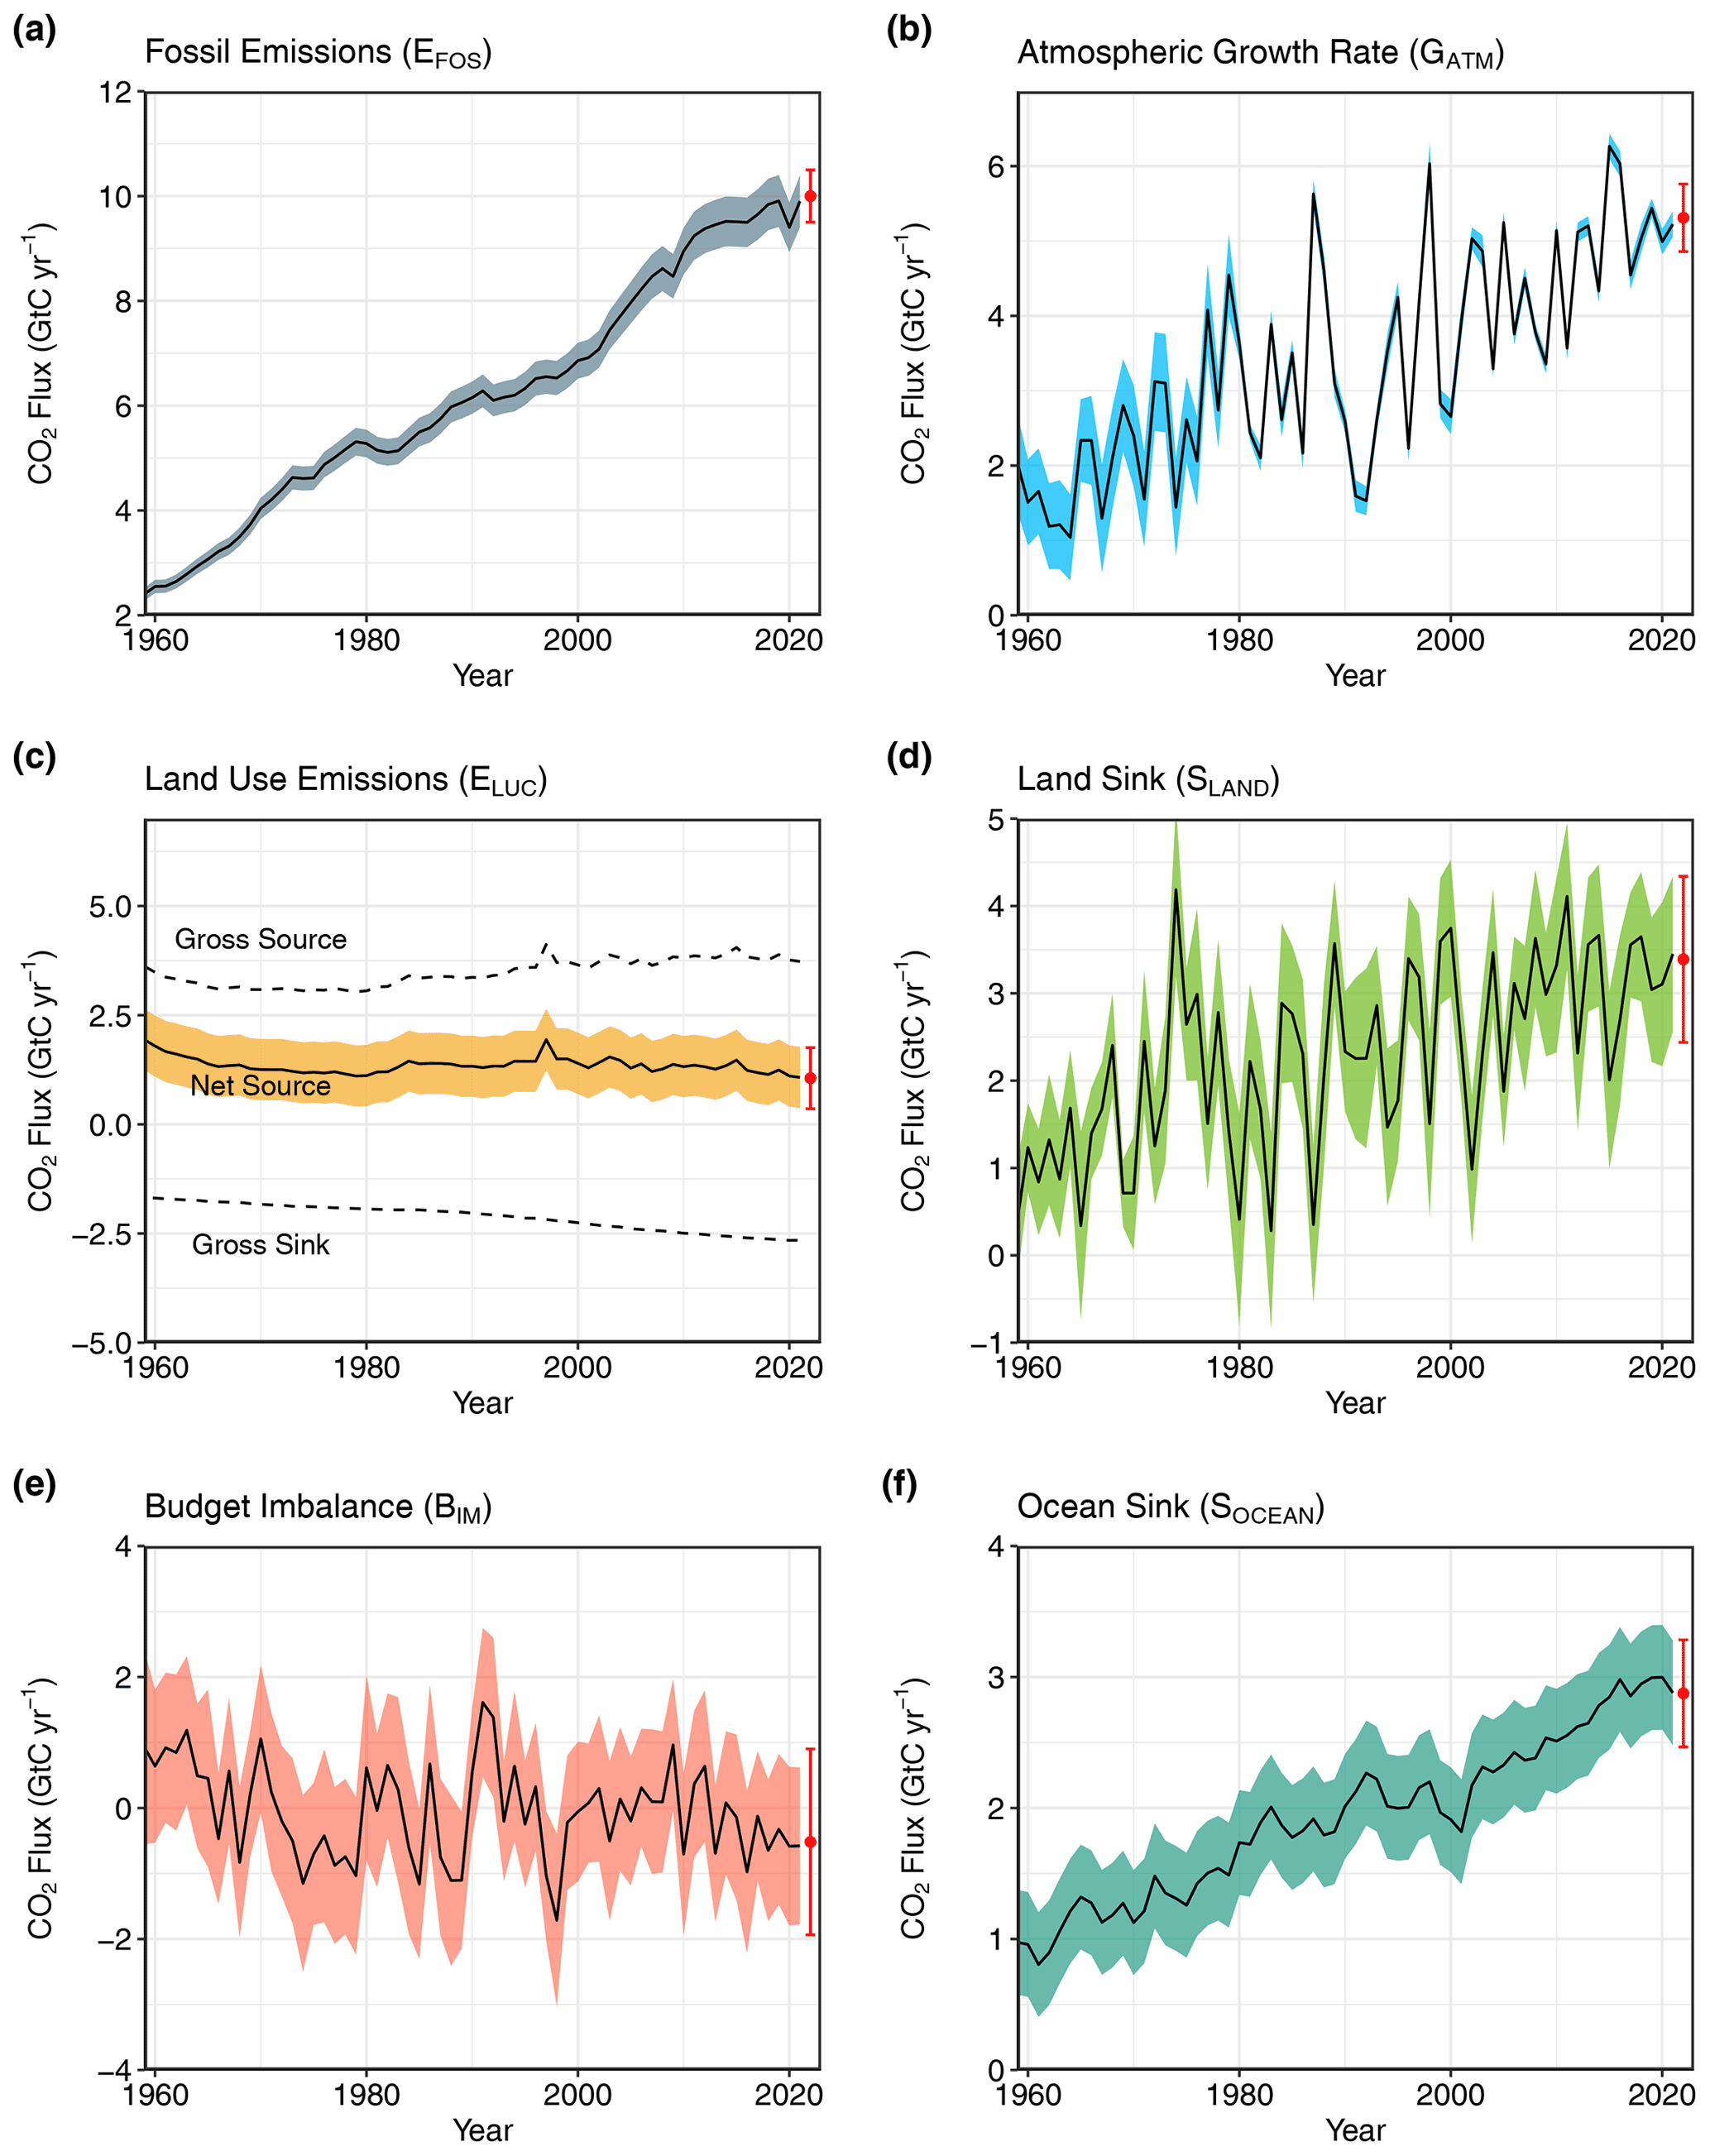
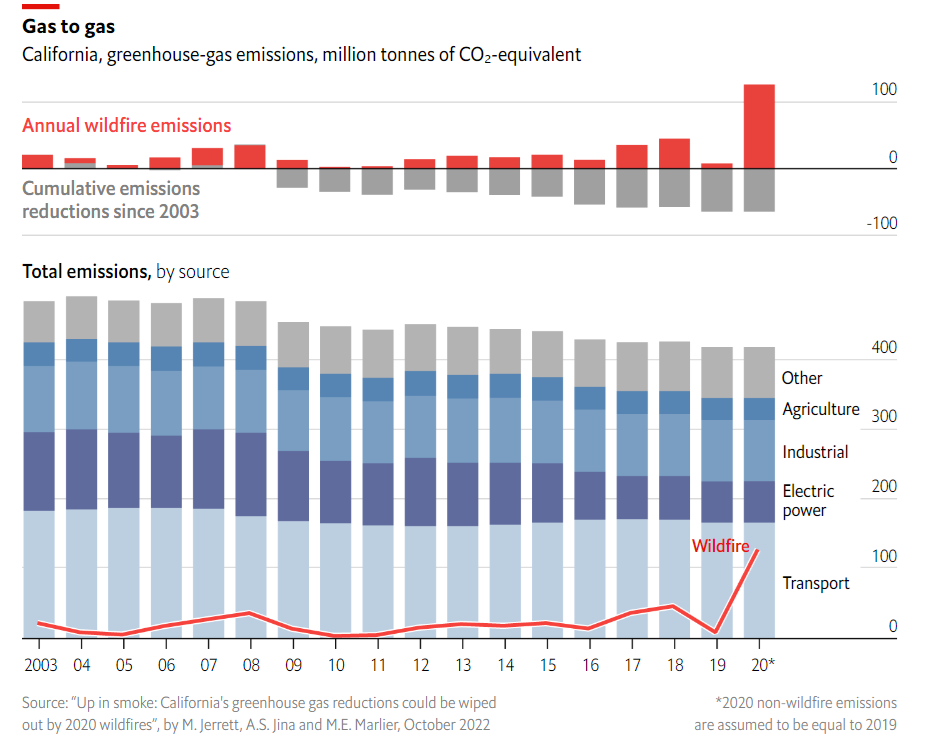
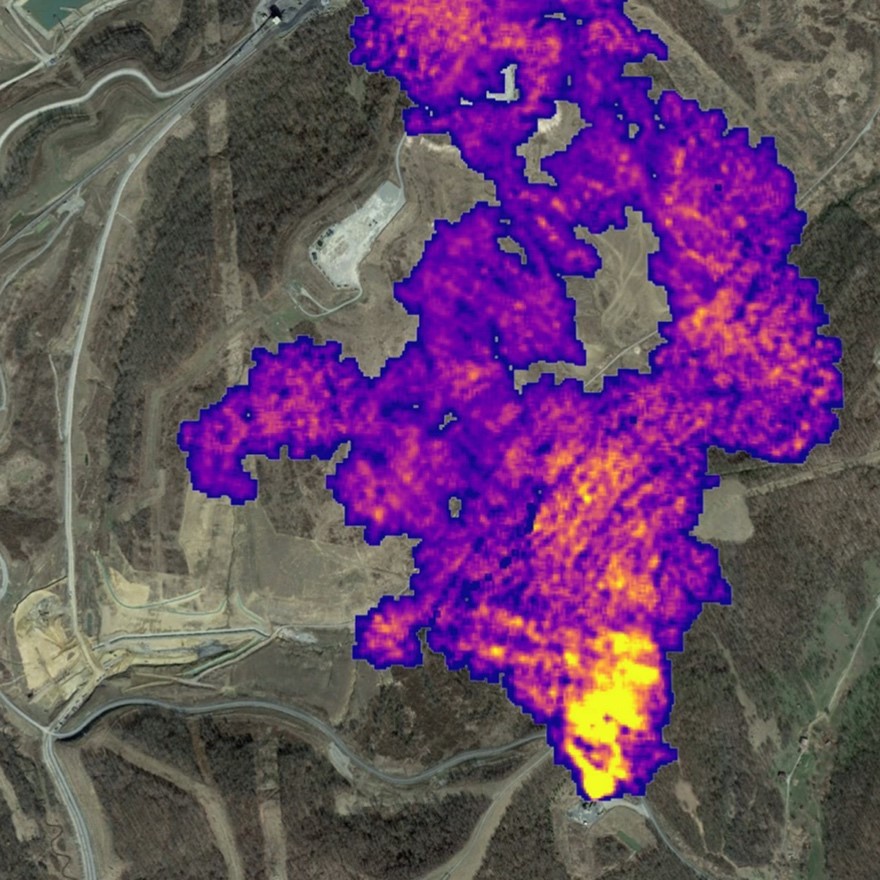
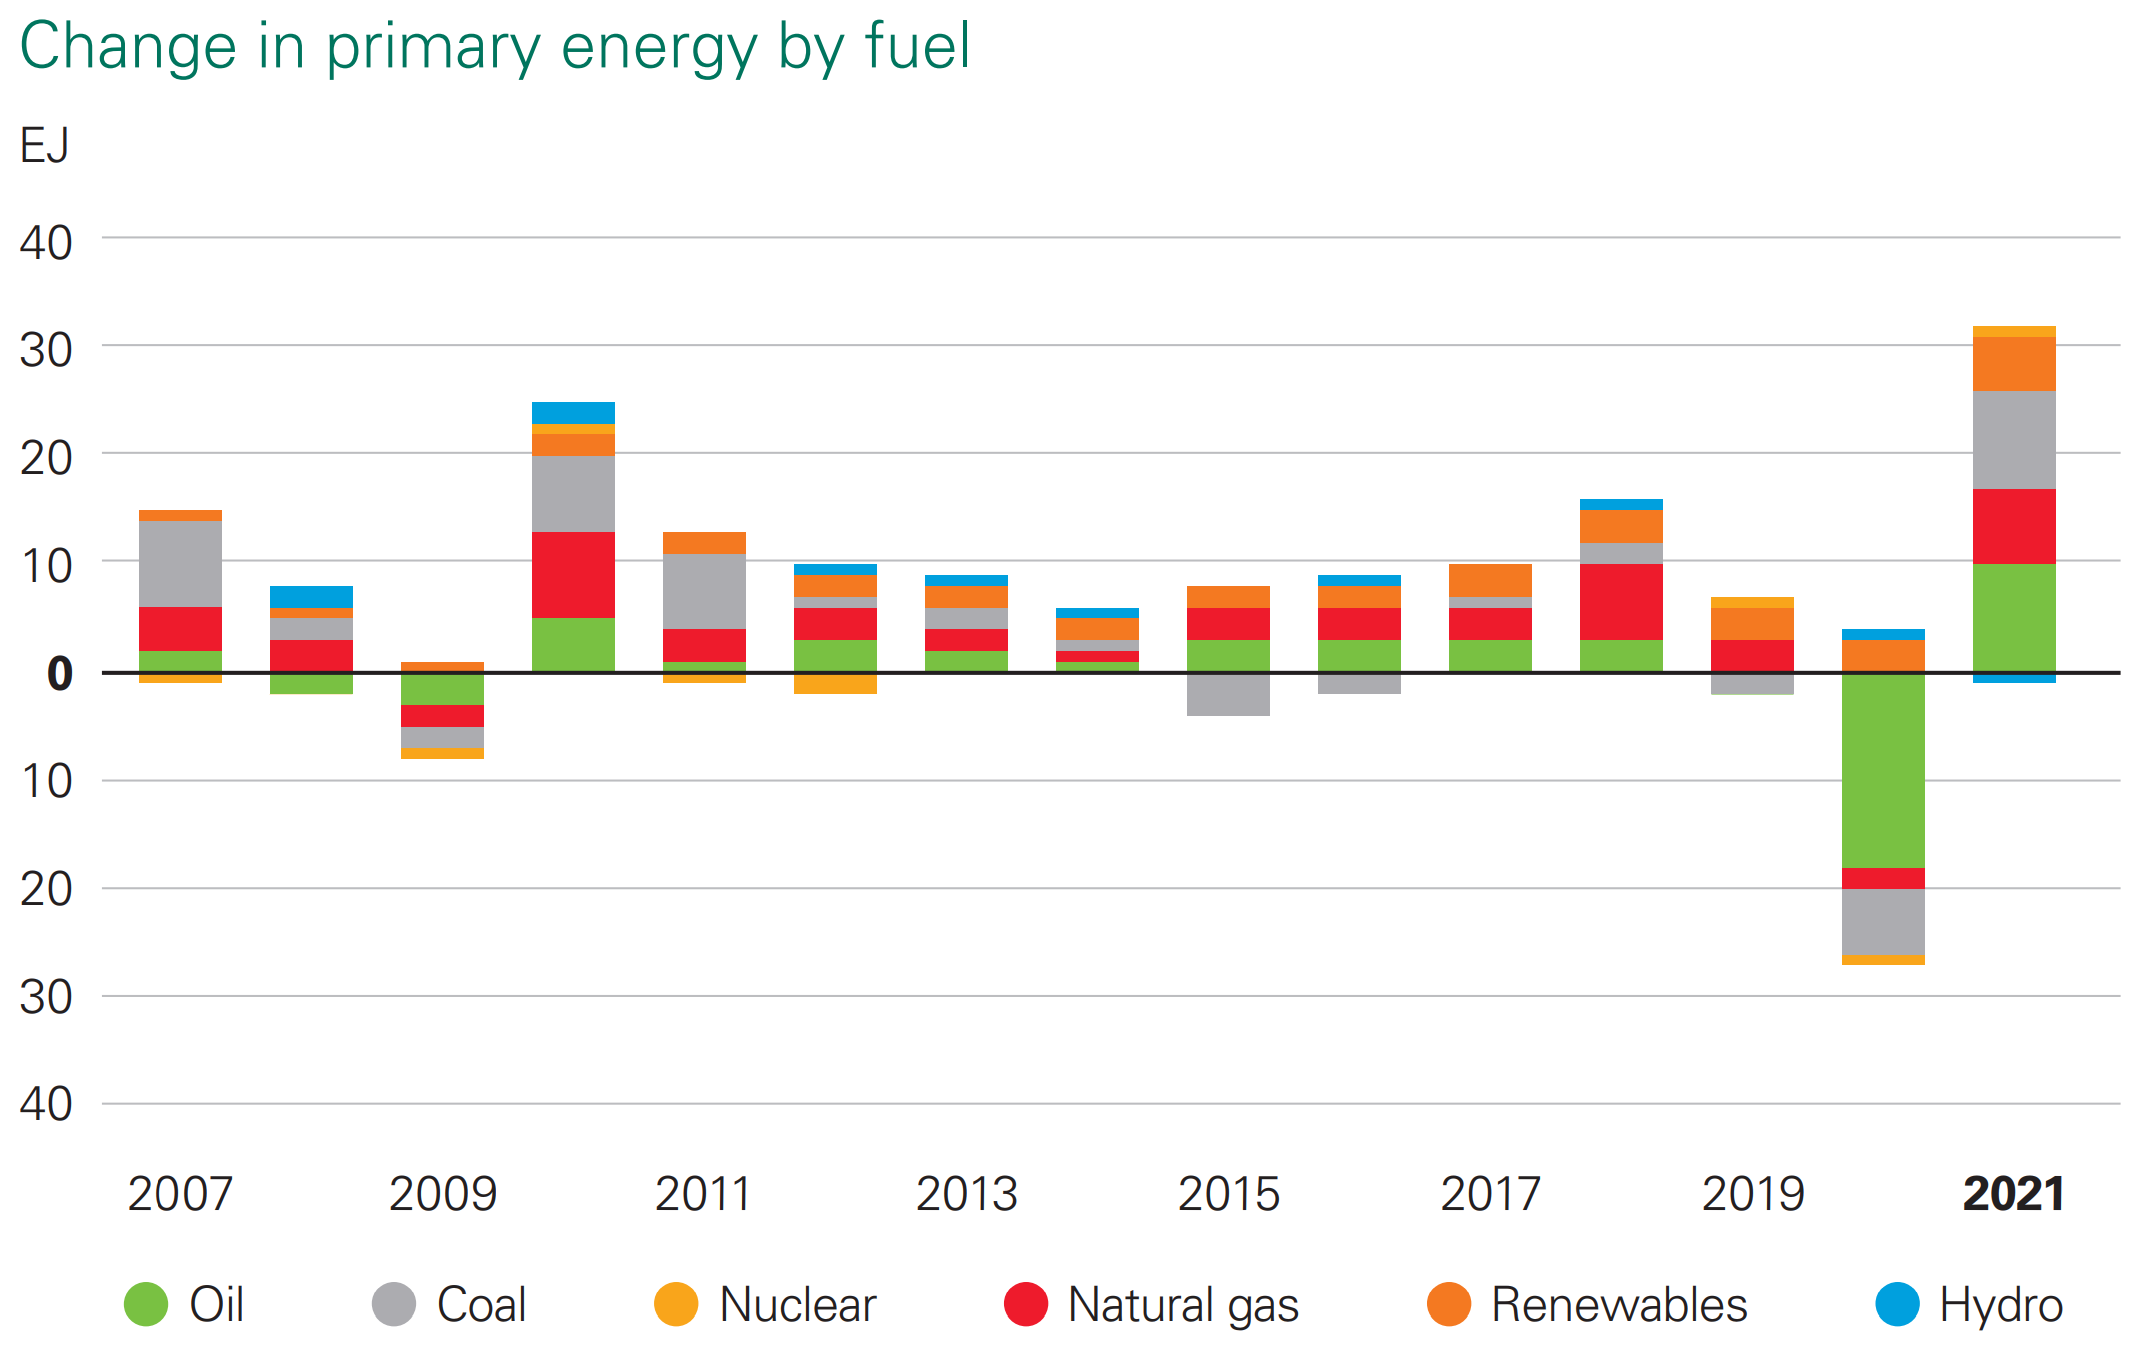
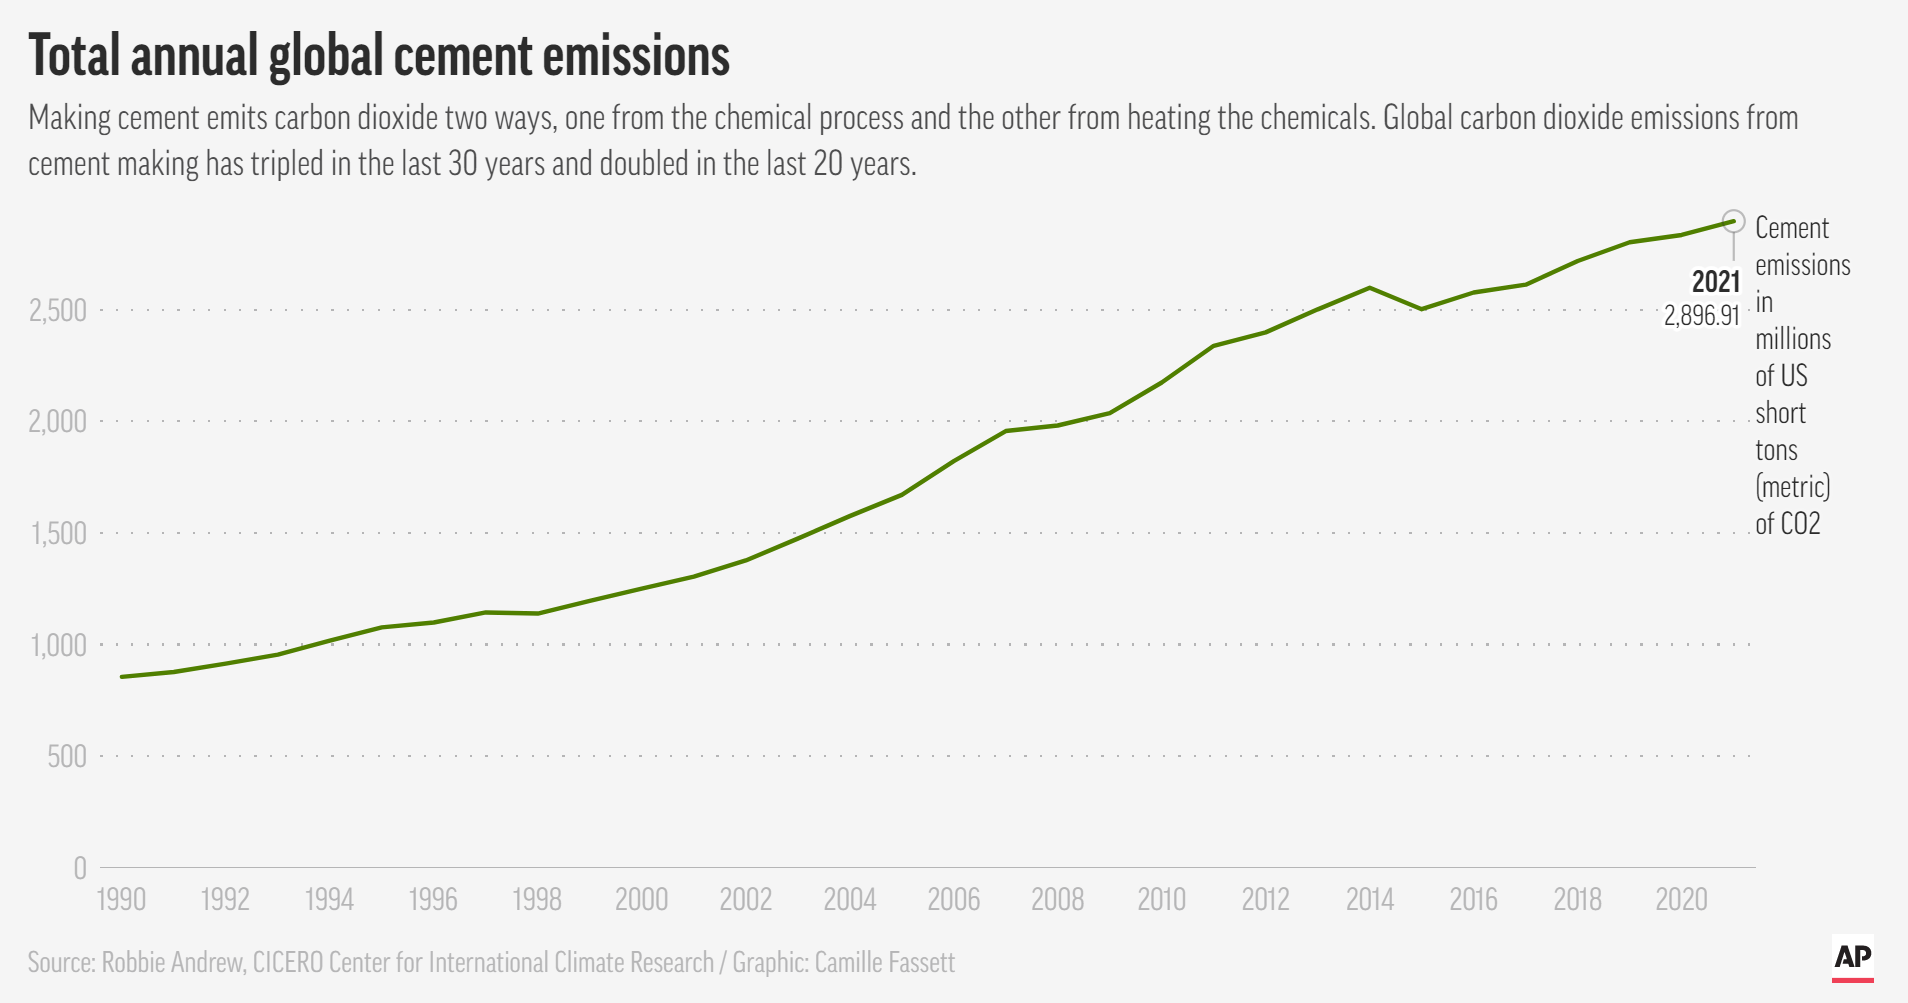
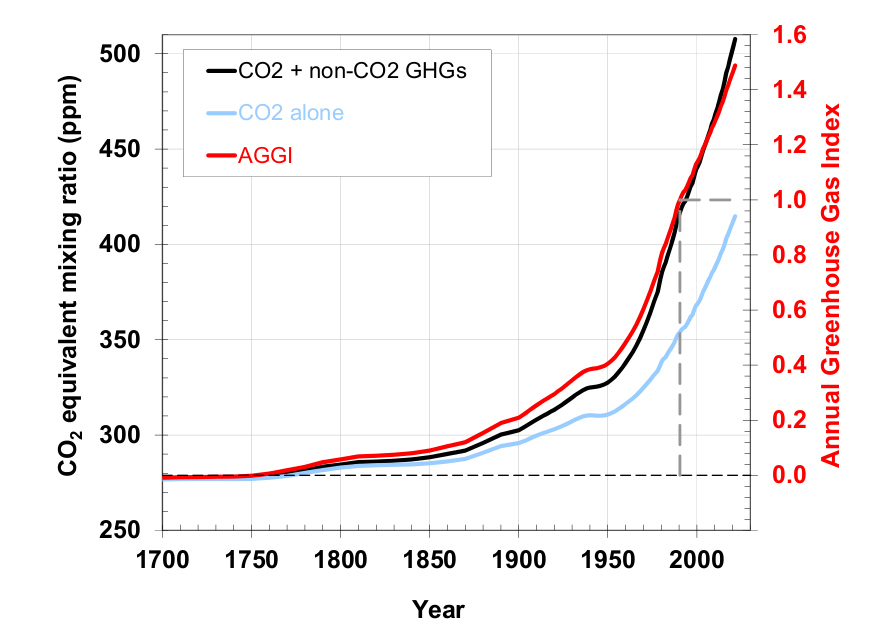
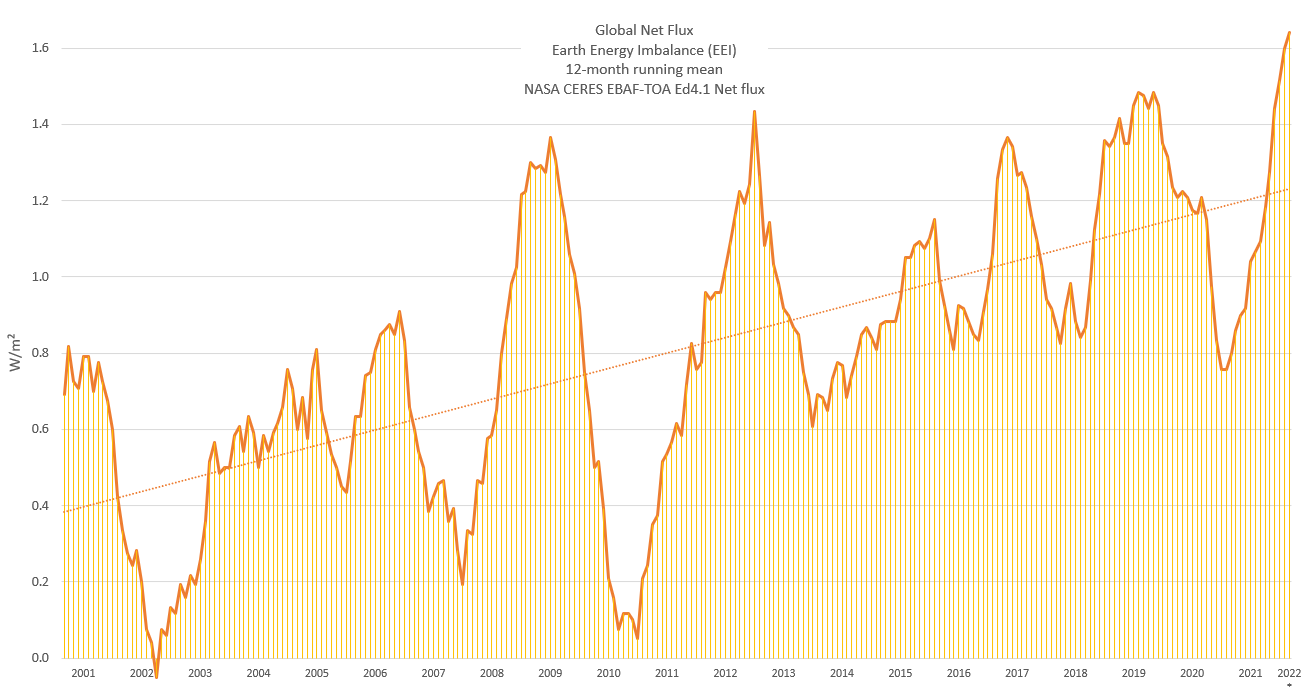
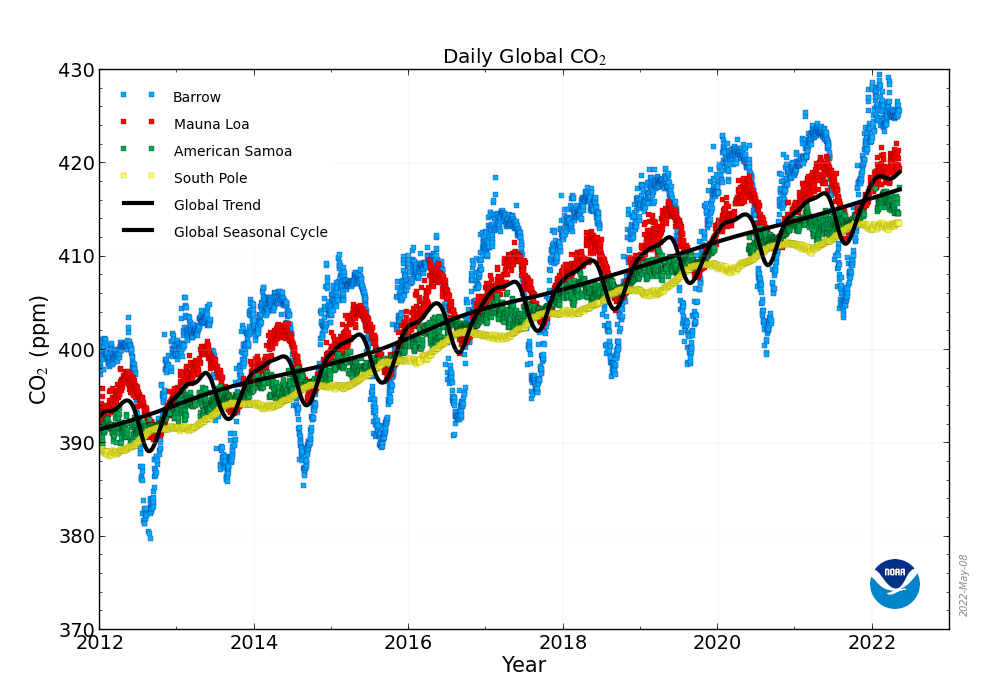
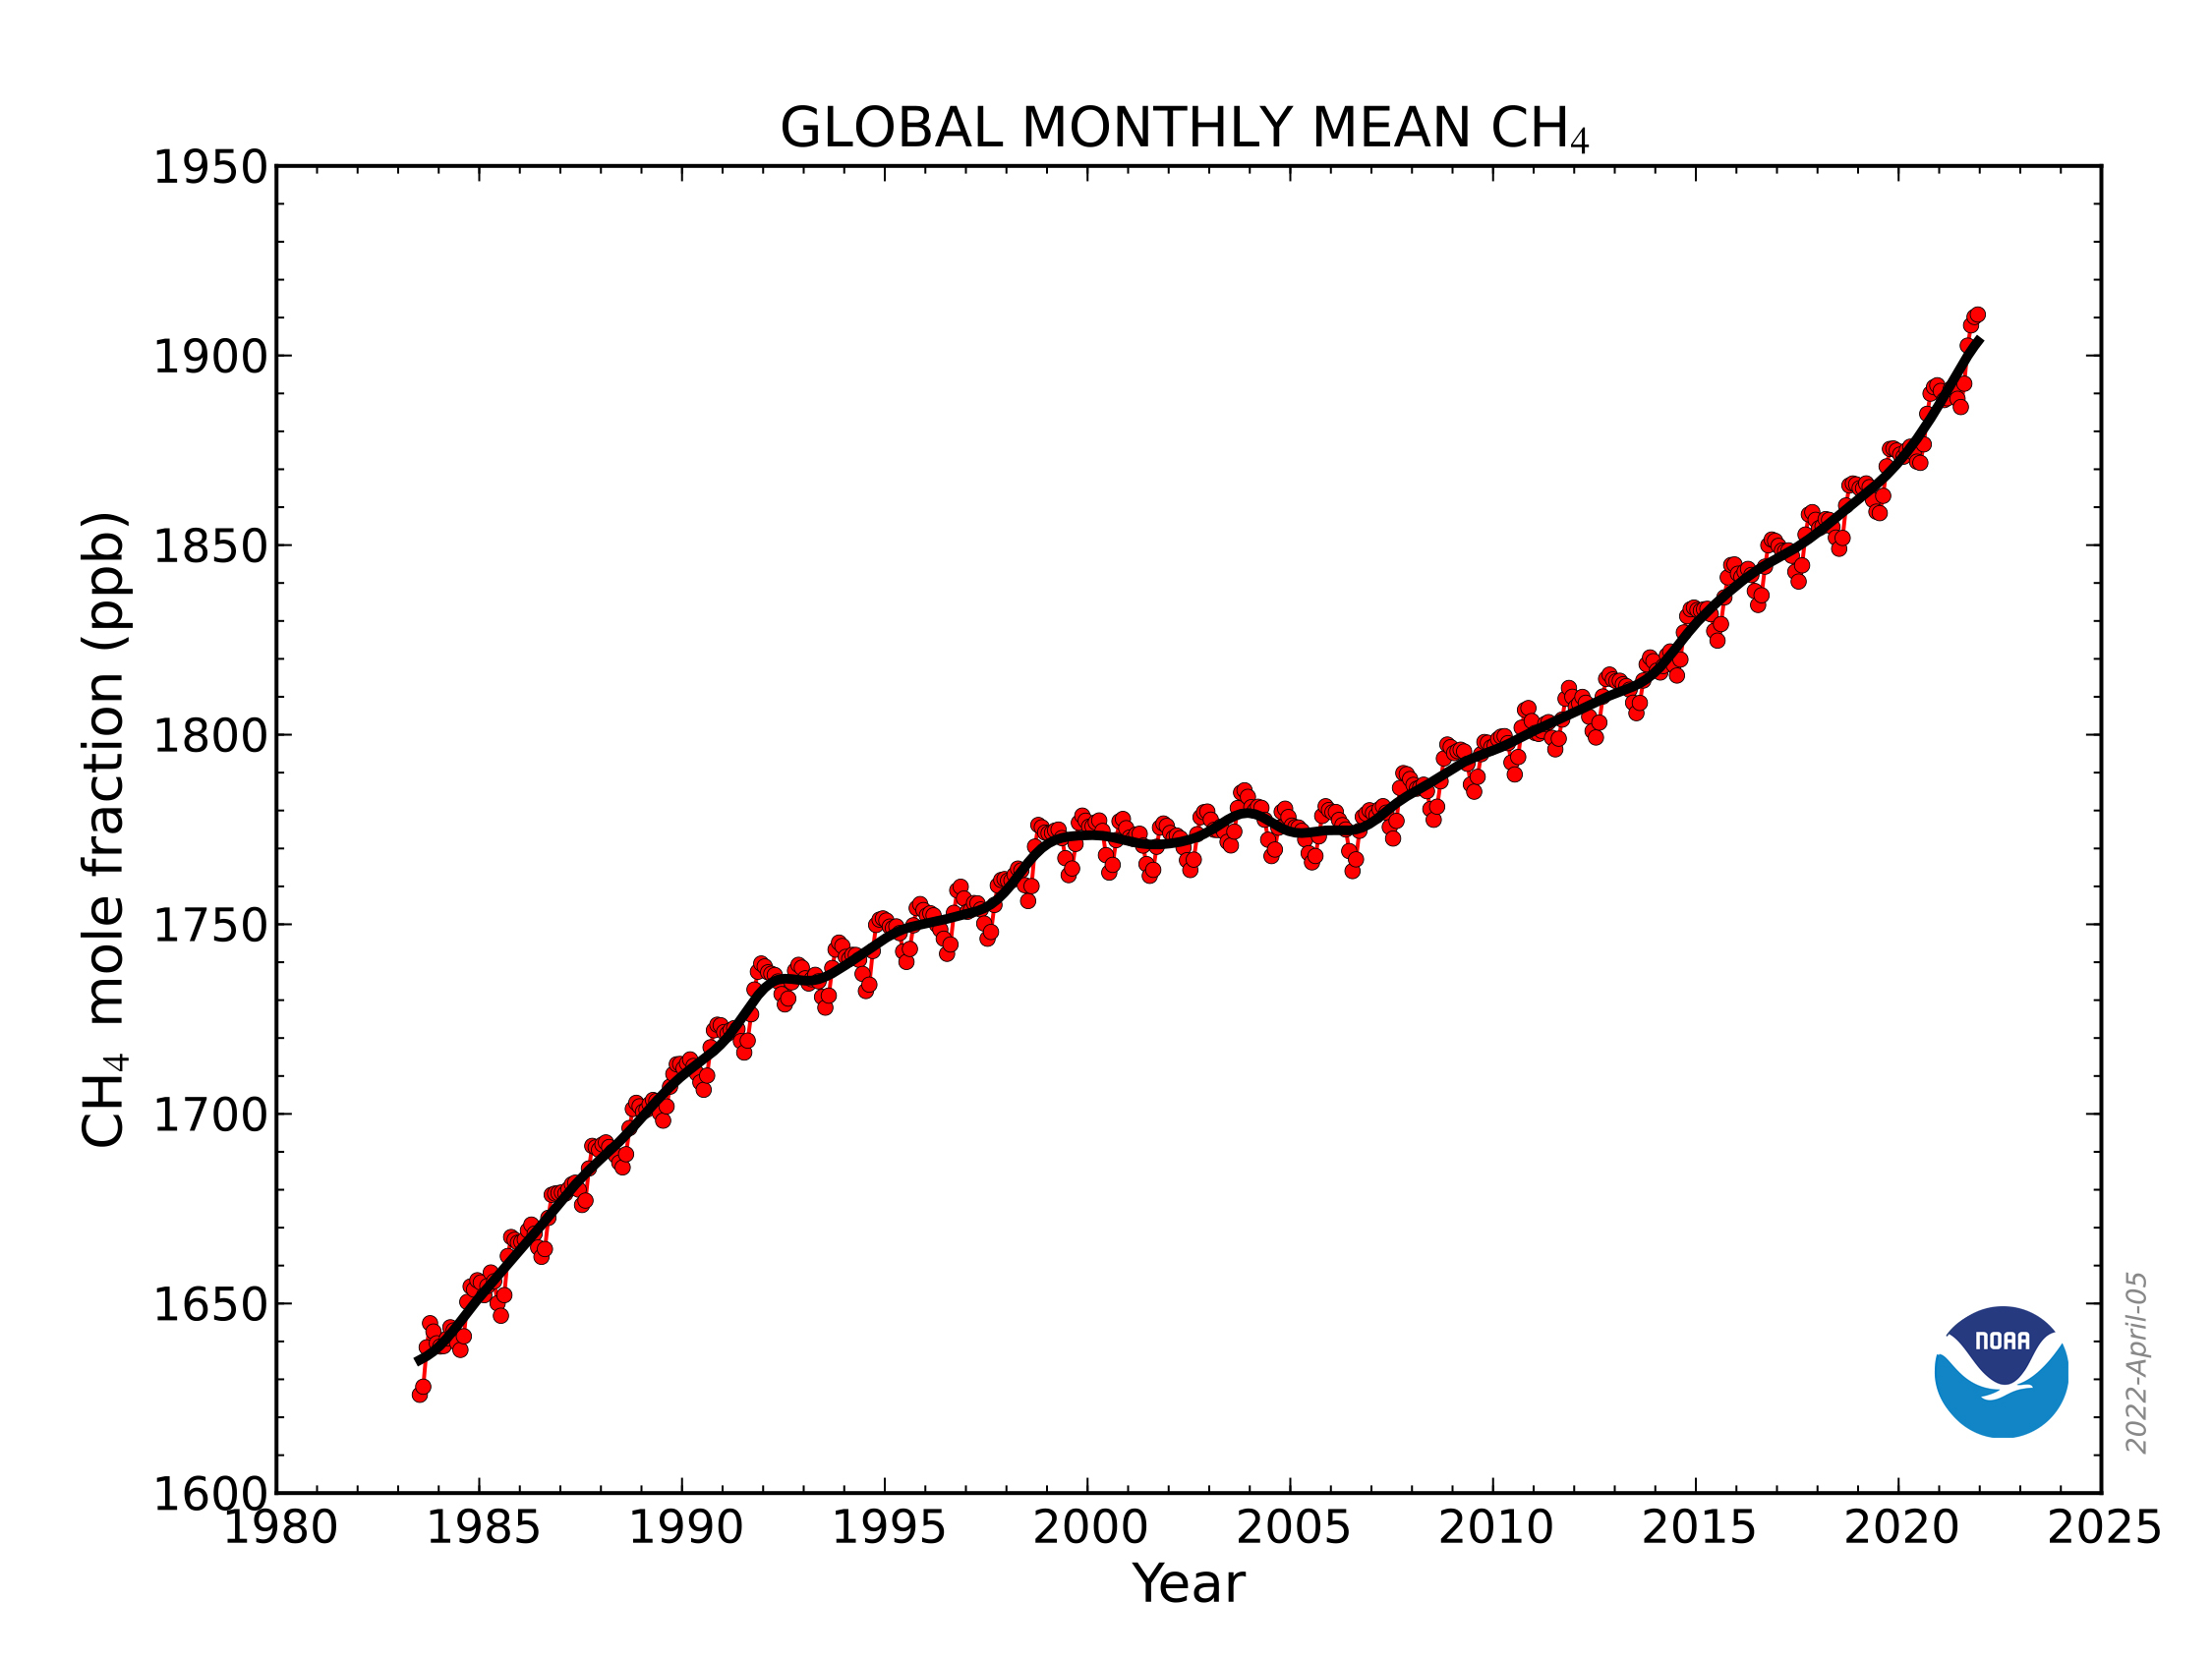
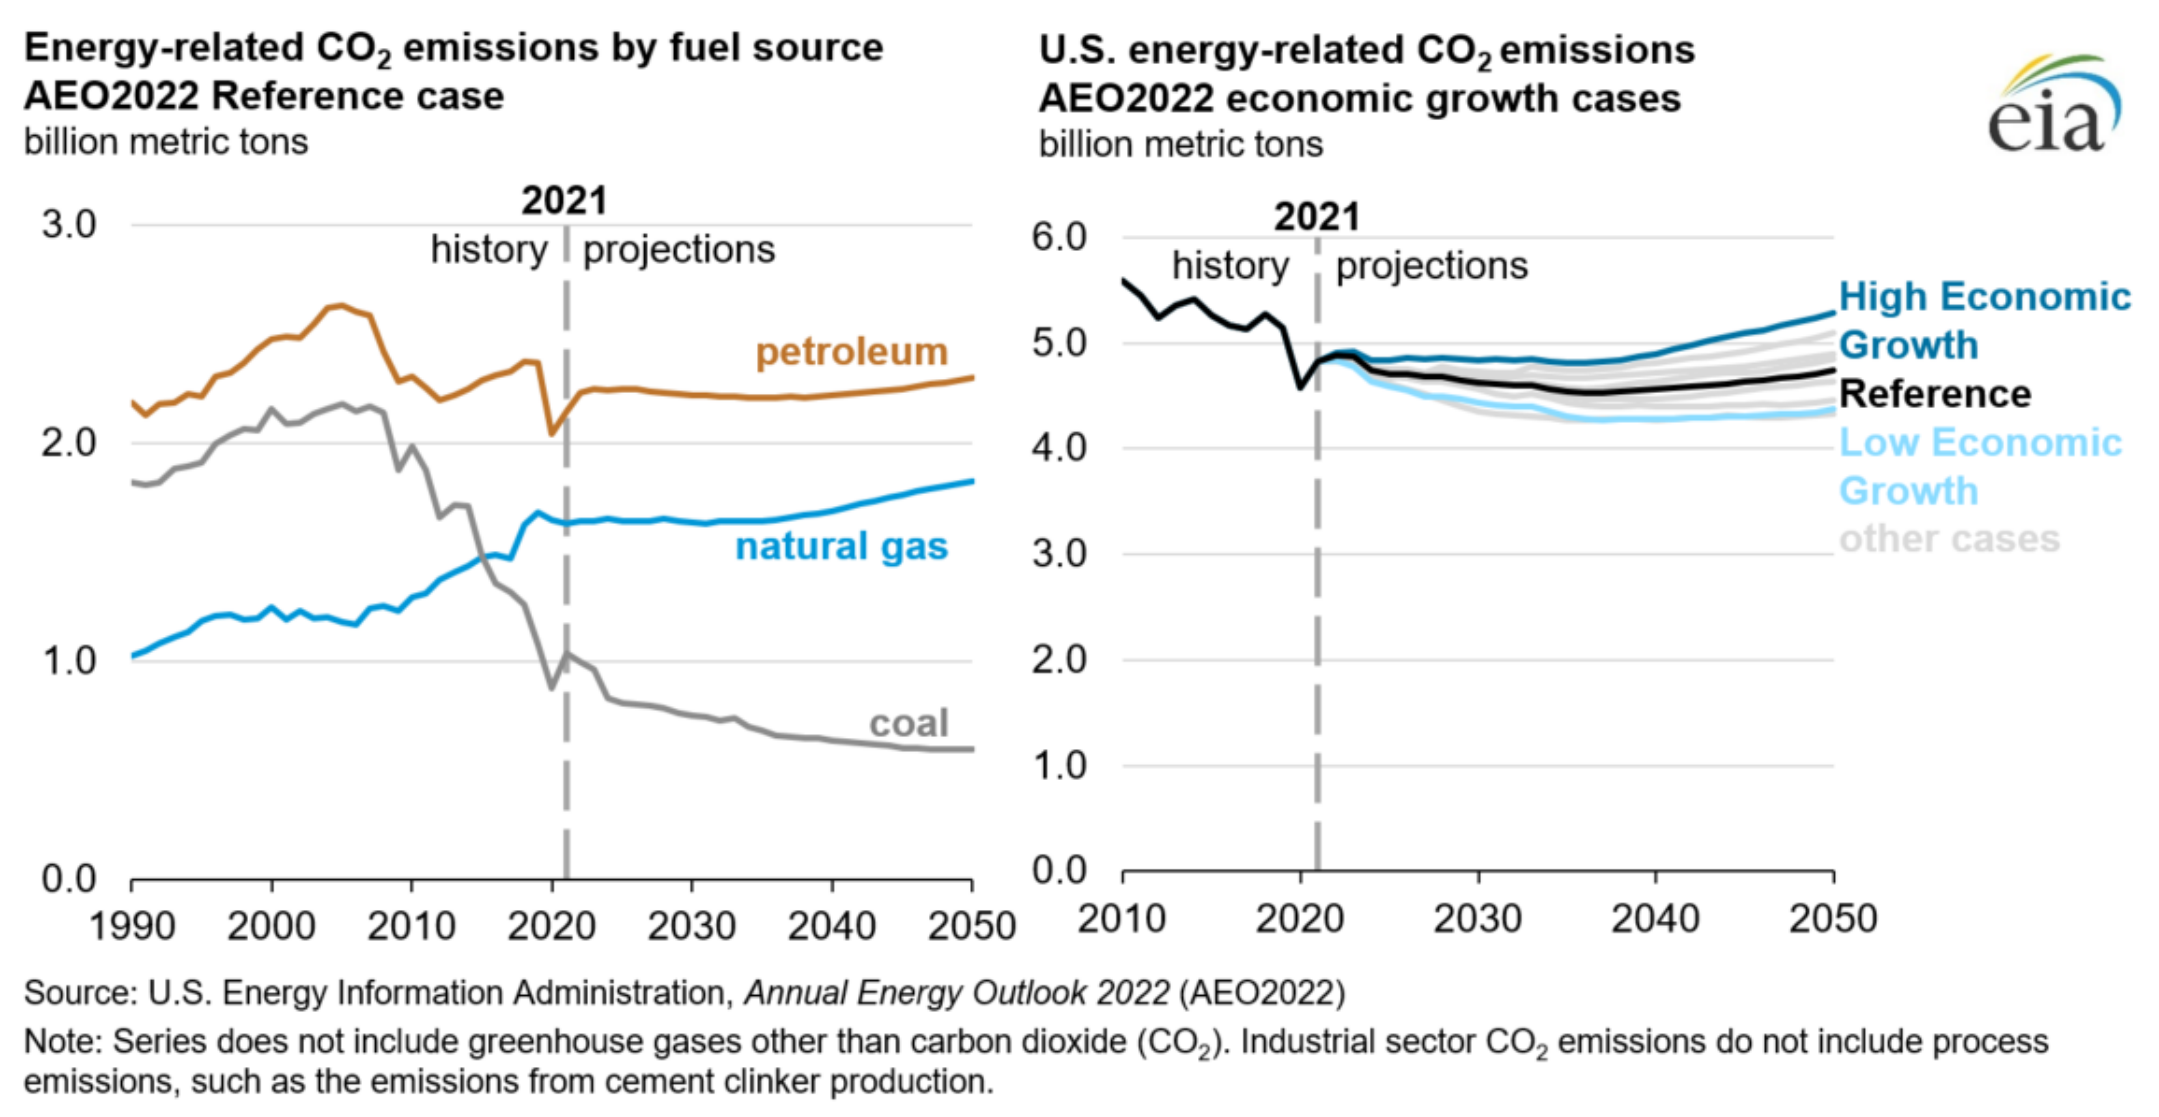
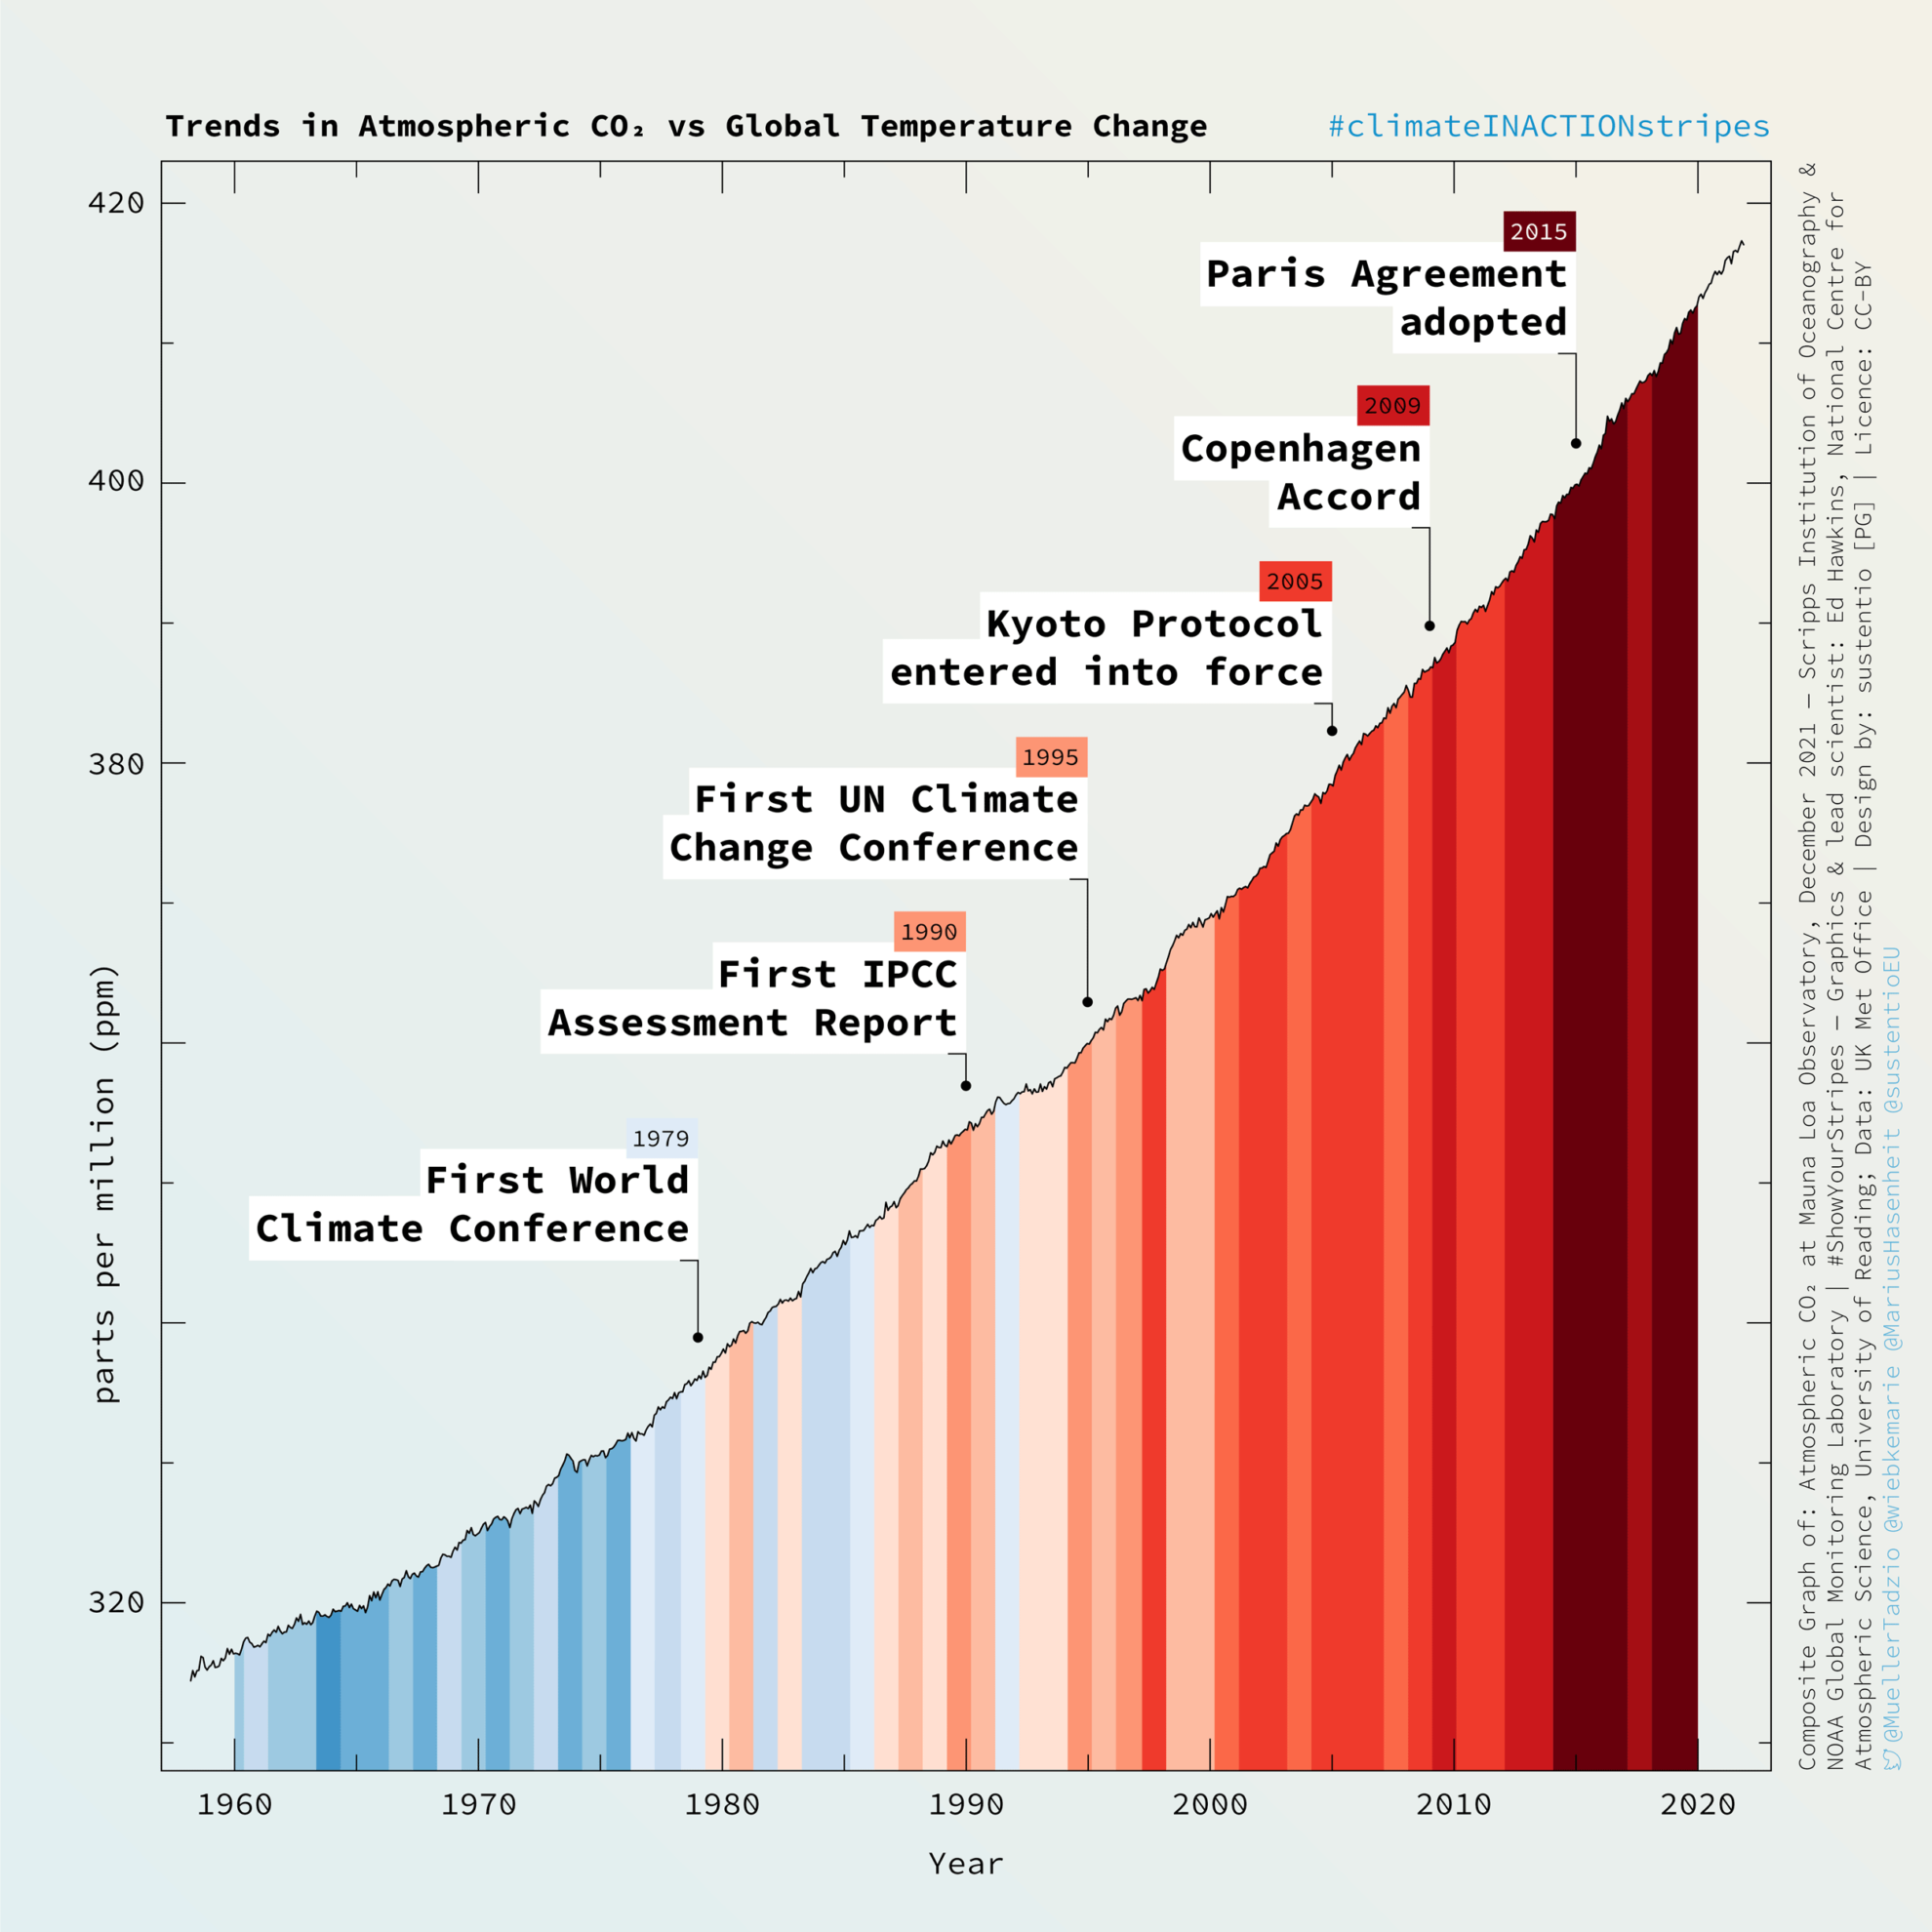
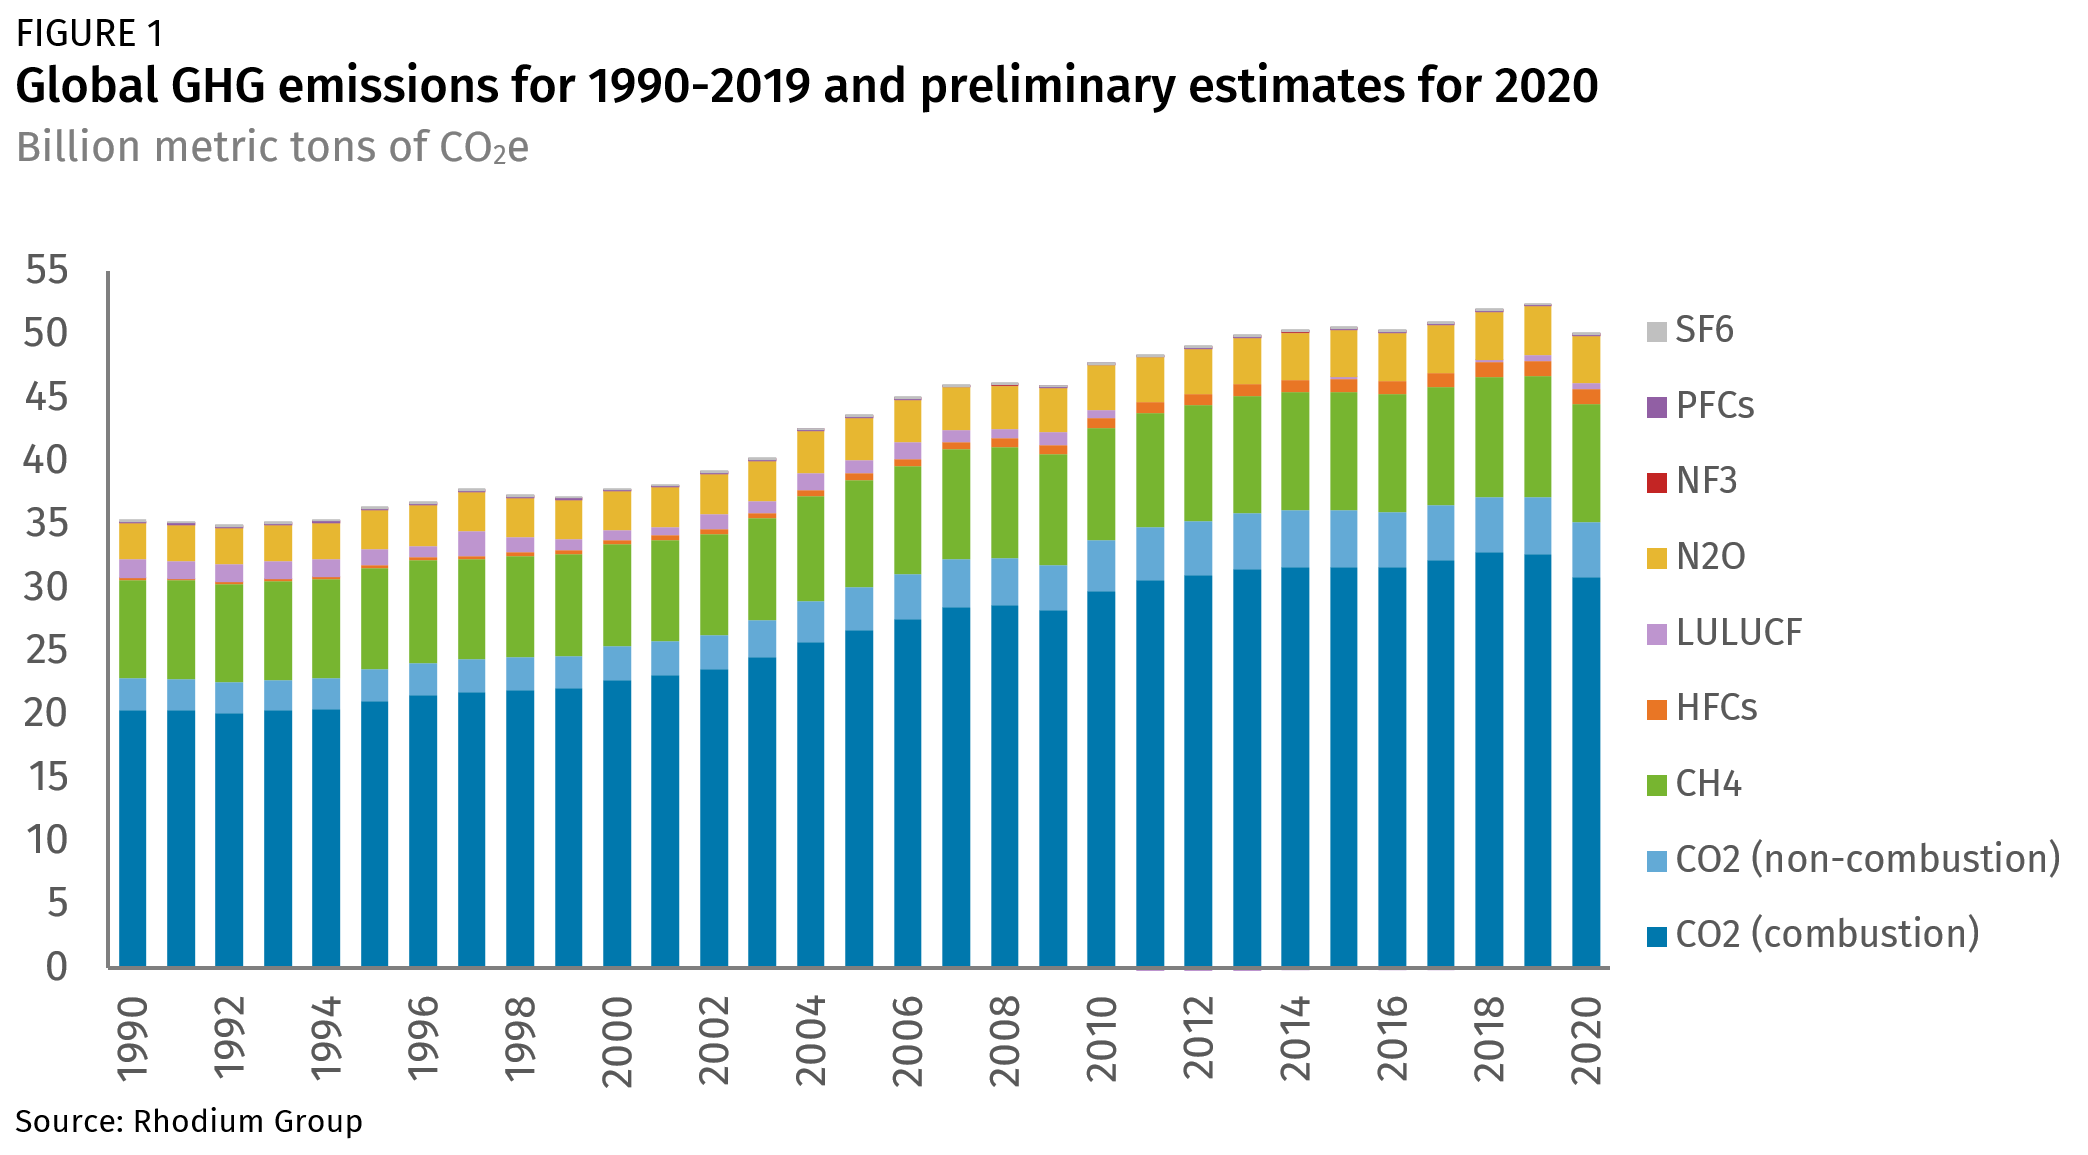
Abrupt climate change is driven almost entirely by human emissions of greenhouse gases. As Desdemona reports every year, greenhouse gas levels again hit new highs. The 2022 World Meteorological Organization (WMO) Greenhouse Gas Bulletin reported the biggest year-on-year jump in methane concentrations in 2021 since systematic measurements began nearly 40 years ago.
The increase in the atmospheric CO2 level from 2020 to 2021 was larger than the average annual growth rate over the last decade. Measurements from WMO’s Global Atmosphere Watch network stations showed that these levels continued to rise in 2022 over the entire globe.
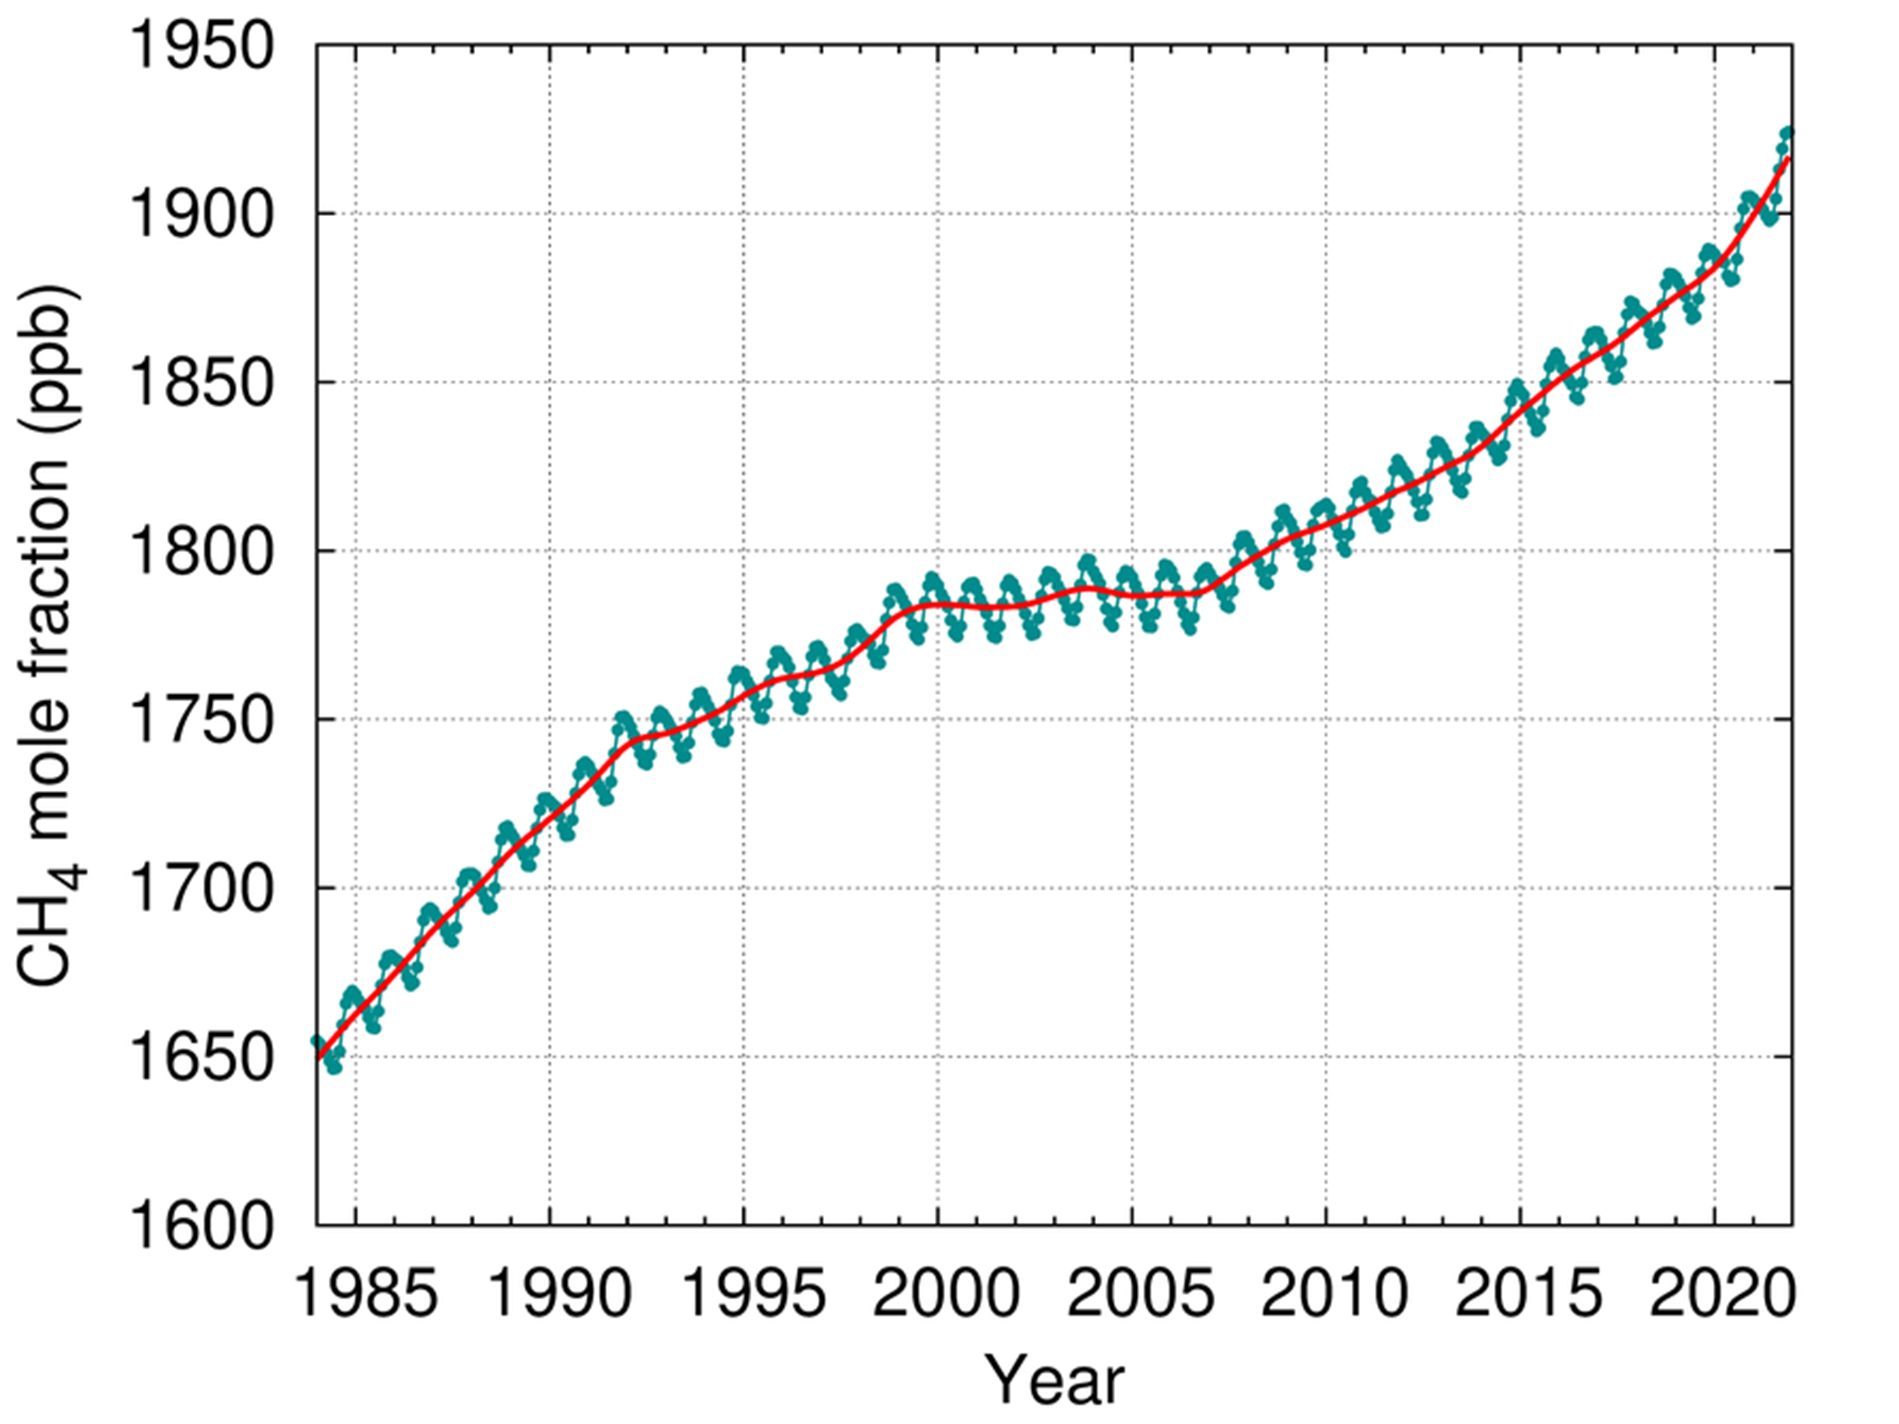
WMO Secretary-General Prof. Petteri Taalas remarked, “The continuing rise in concentrations of the main heat-trapping gases, including the record acceleration in methane levels, shows that we are heading in the wrong direction.” He added, “We need to transform our industrial, energy, and transport systems and whole way of life. The needed changes are economically affordable and technically possible. Time is running out.”
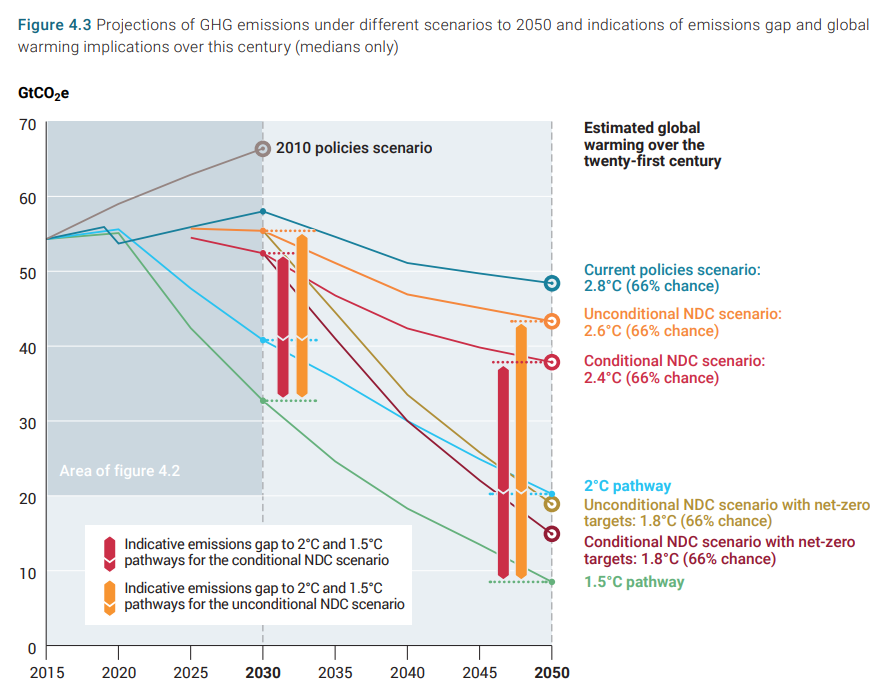
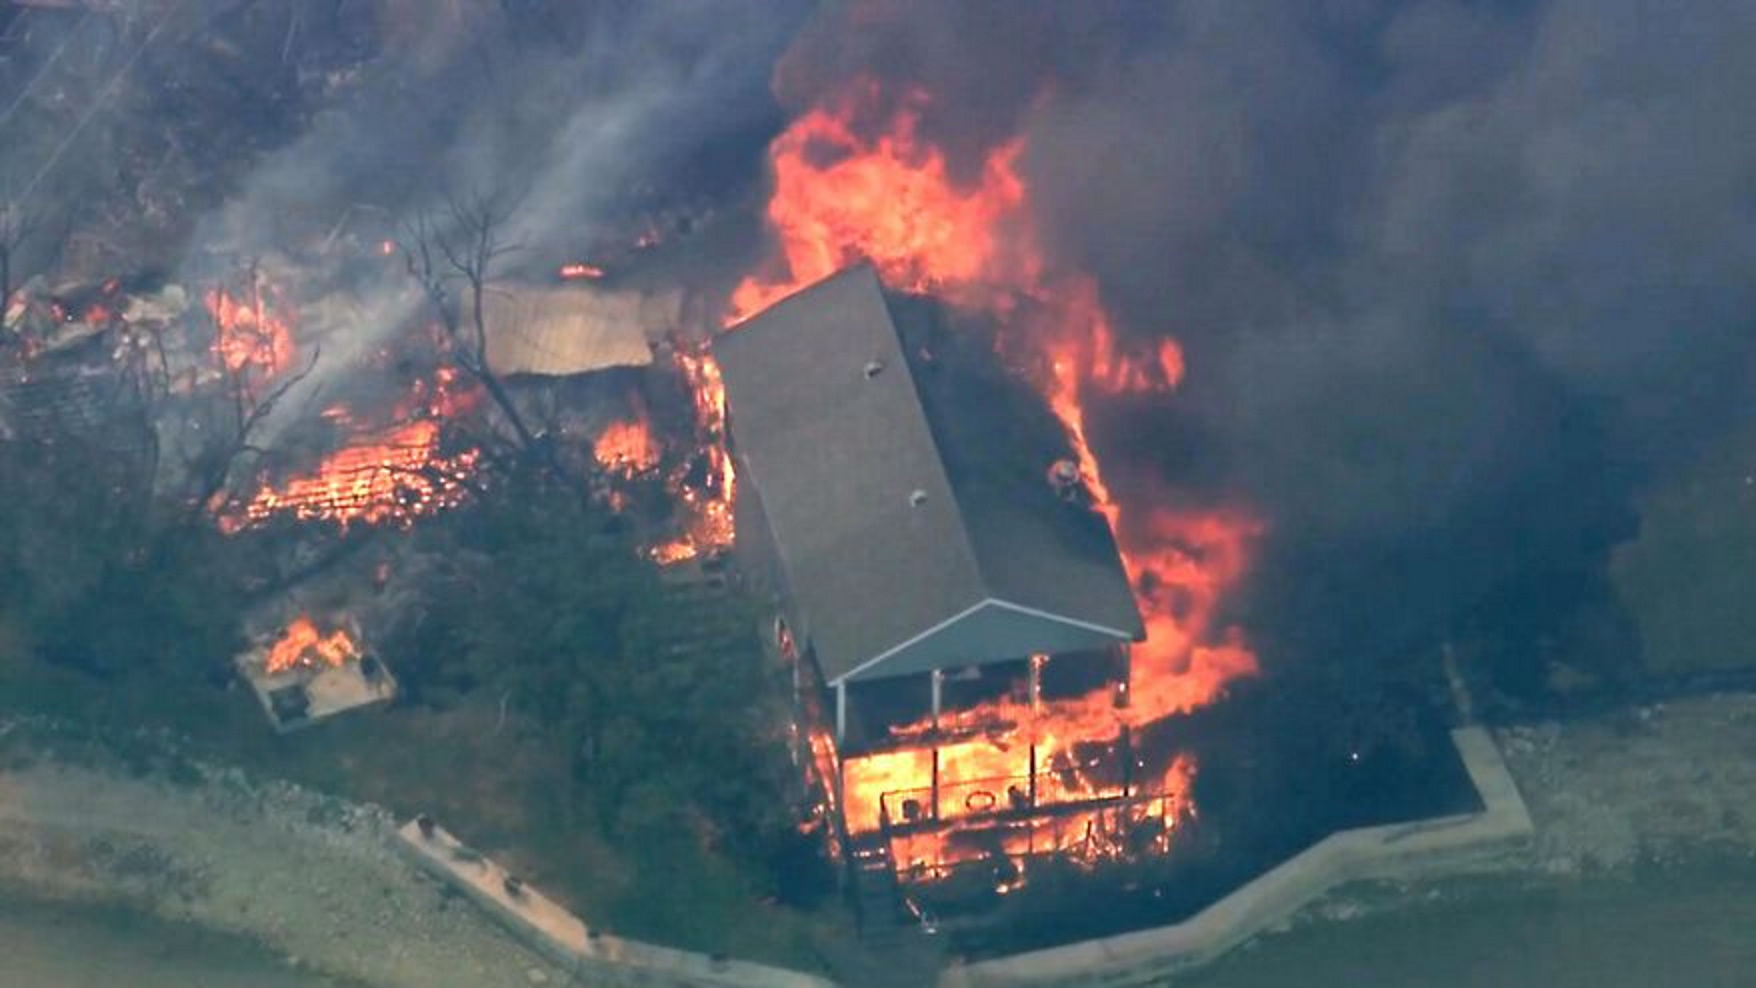
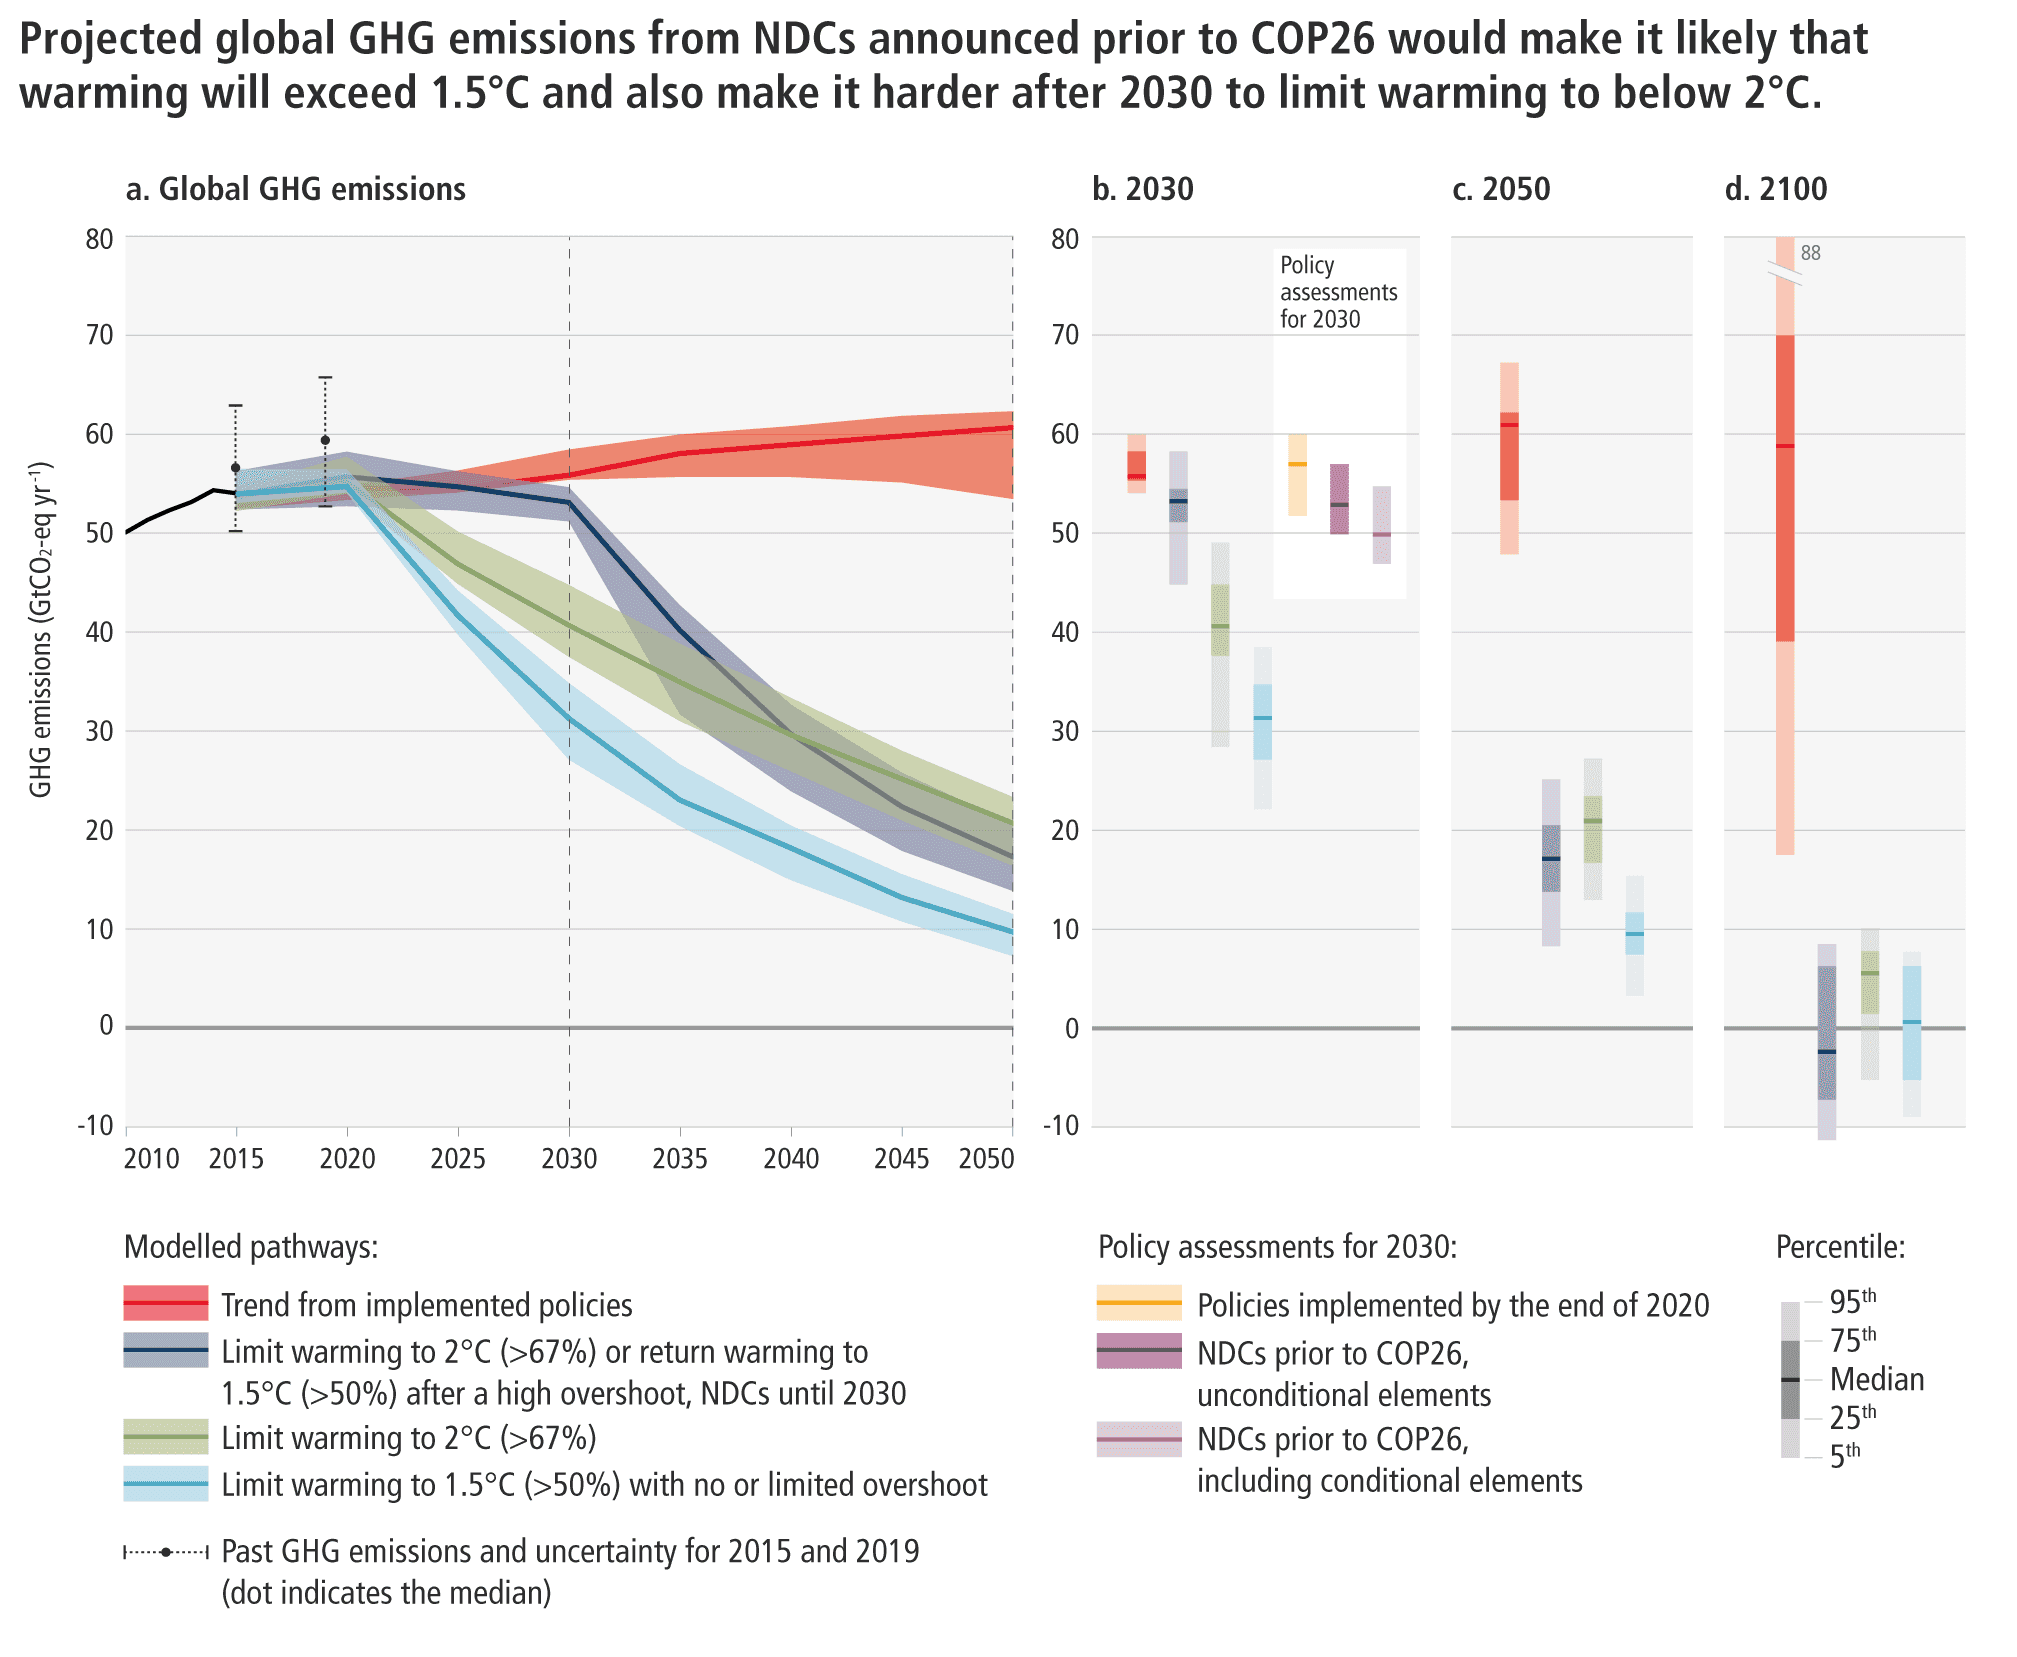
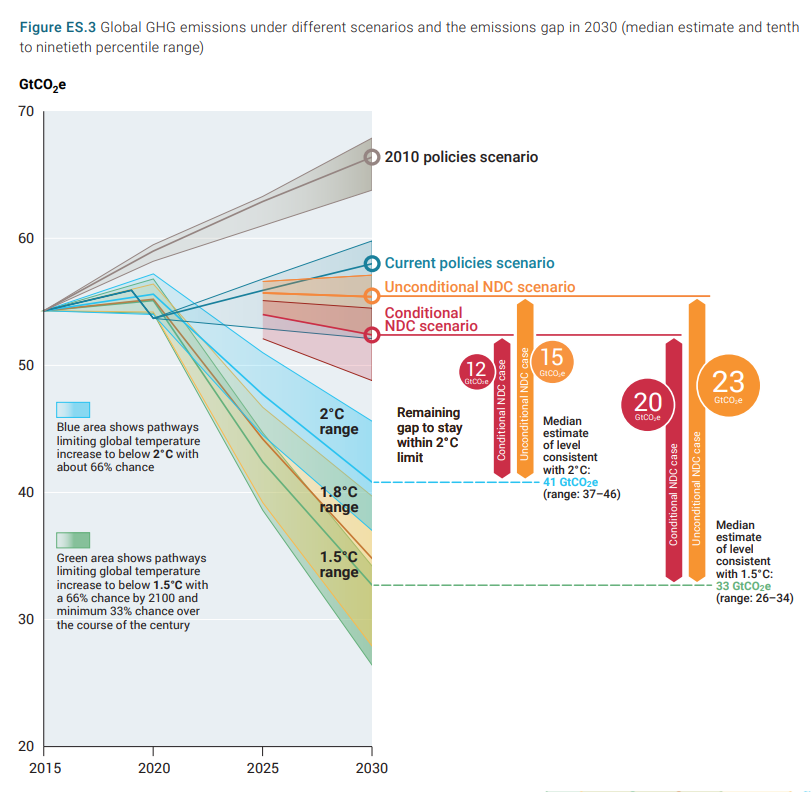
The UN concurred with WMO in a new study, Emissions Gap Report 2022: The Closing Window – Climate crisis calls for rapid transformation of societies. Inger Andersen, Executive Director of UNEP, remarked, “This report tells us in cold scientific terms what nature has been telling us, all year, through deadly floods, storms, and raging fires: we have to stop filling our atmosphere with greenhouse gases, and stop doing it fast. We had our chance to make incremental changes, but that time is over. Only a root-and-branch transformation of our economies and societies can save us from accelerating climate disaster.”
With the world at war and economic shocks from the ongoing Covid pandemic disrupting global supply chains, the likelihood of a global transformation of our industrial, energy, transport systems, and whole way of life in a sustainable direction seems more remote than ever.
A transformation is likely to happen, but Desdemona expects it to go in the opposite direction.
- Don’t miss the doomiest images for 2022.
- For the doomiest content going back to 2010, check out the Doomiest Images and Graphs Index.