Richest people in UK use more energy flying than poorest do overall – “There is so much social injustice engrained in those who don’t have enough energy”
By Josh Gabbatiss
14 December 2022
(Carbon Brief) – The wealthiest people in the UK burn through more energy flying than the poorest use in every aspect of their lives, according to new research.
The analysis of data from 2019 highlights “significant inequalities” in energy use across the country. Those in the top 10% of incomes used nearly three times as much energy in a year as people in the bottom 30%.
This was particularly true for transport. Car journeys and flights taken by the richest British people – especially “white, wealthy middle-aged men” – used more energy that year than 60% of the population got through in total.
The authors of the study, published in Ecological Economics, say energy consumption is currently “too high” to achieve the world’s climate targets, even as many indulge in “excess energy use” while millions languish in fuel poverty.
Yet, by combining their energy analysis with measures of wellbeing, they conclude that a high standard of living can be achieved in the UK with relatively low levels of energy consumption.
Experts tell Carbon Brief that this research should encourage those in power to devise policies that target the excessive energy use of the rich, such as frequent flyer levies.
Large footprints
The study assesses the annual “energy footprint” of people in the UK. This includes a detailed breakdown of the energy used for everything from building their furniture to powering the restaurants where they eat.
Those in the global north are known to be disproportionately responsible for both energy use and greenhouse gas emissions. The average person in the UK uses roughly four times as much energy in a year as someone in India and 21 times as much as someone in east Africa.
But within these relatively high-income nations there are large variations in wealth and the energy intensity of people’s lifestyles.
In order to assess the energy use of different activities, the team led by Dr Marta Baltruszewicz, as part of the Living Well Within Limits project at the University of Leeds, drew together a range of datasets concerning British people’s lives.
In particular, they merged data collected in 2019 for the UK living costs and food survey conducted by the Office of National Statistics (ONS) and Understanding Society, a wide-ranging survey touching health, work, social life and other subjects, conducted by the University of Essex.
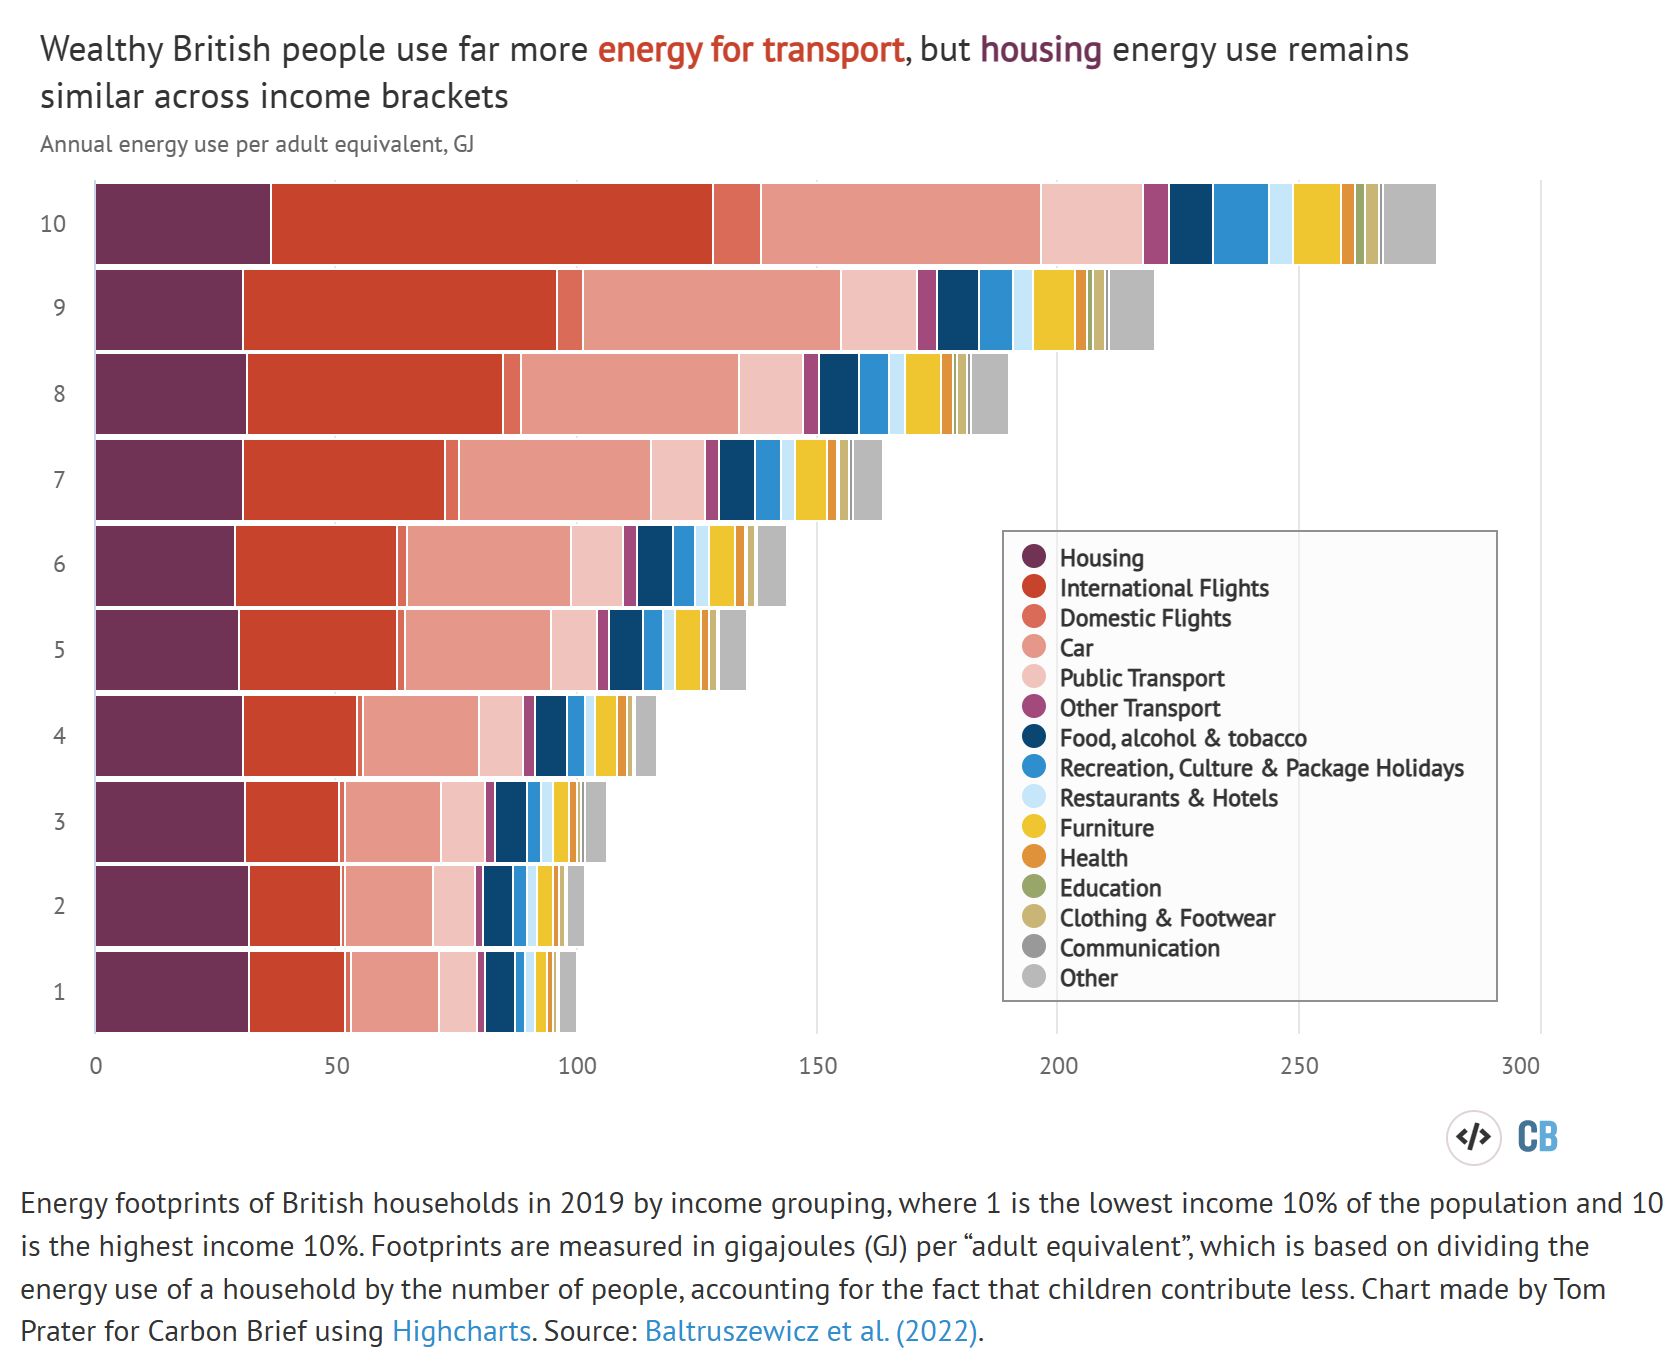
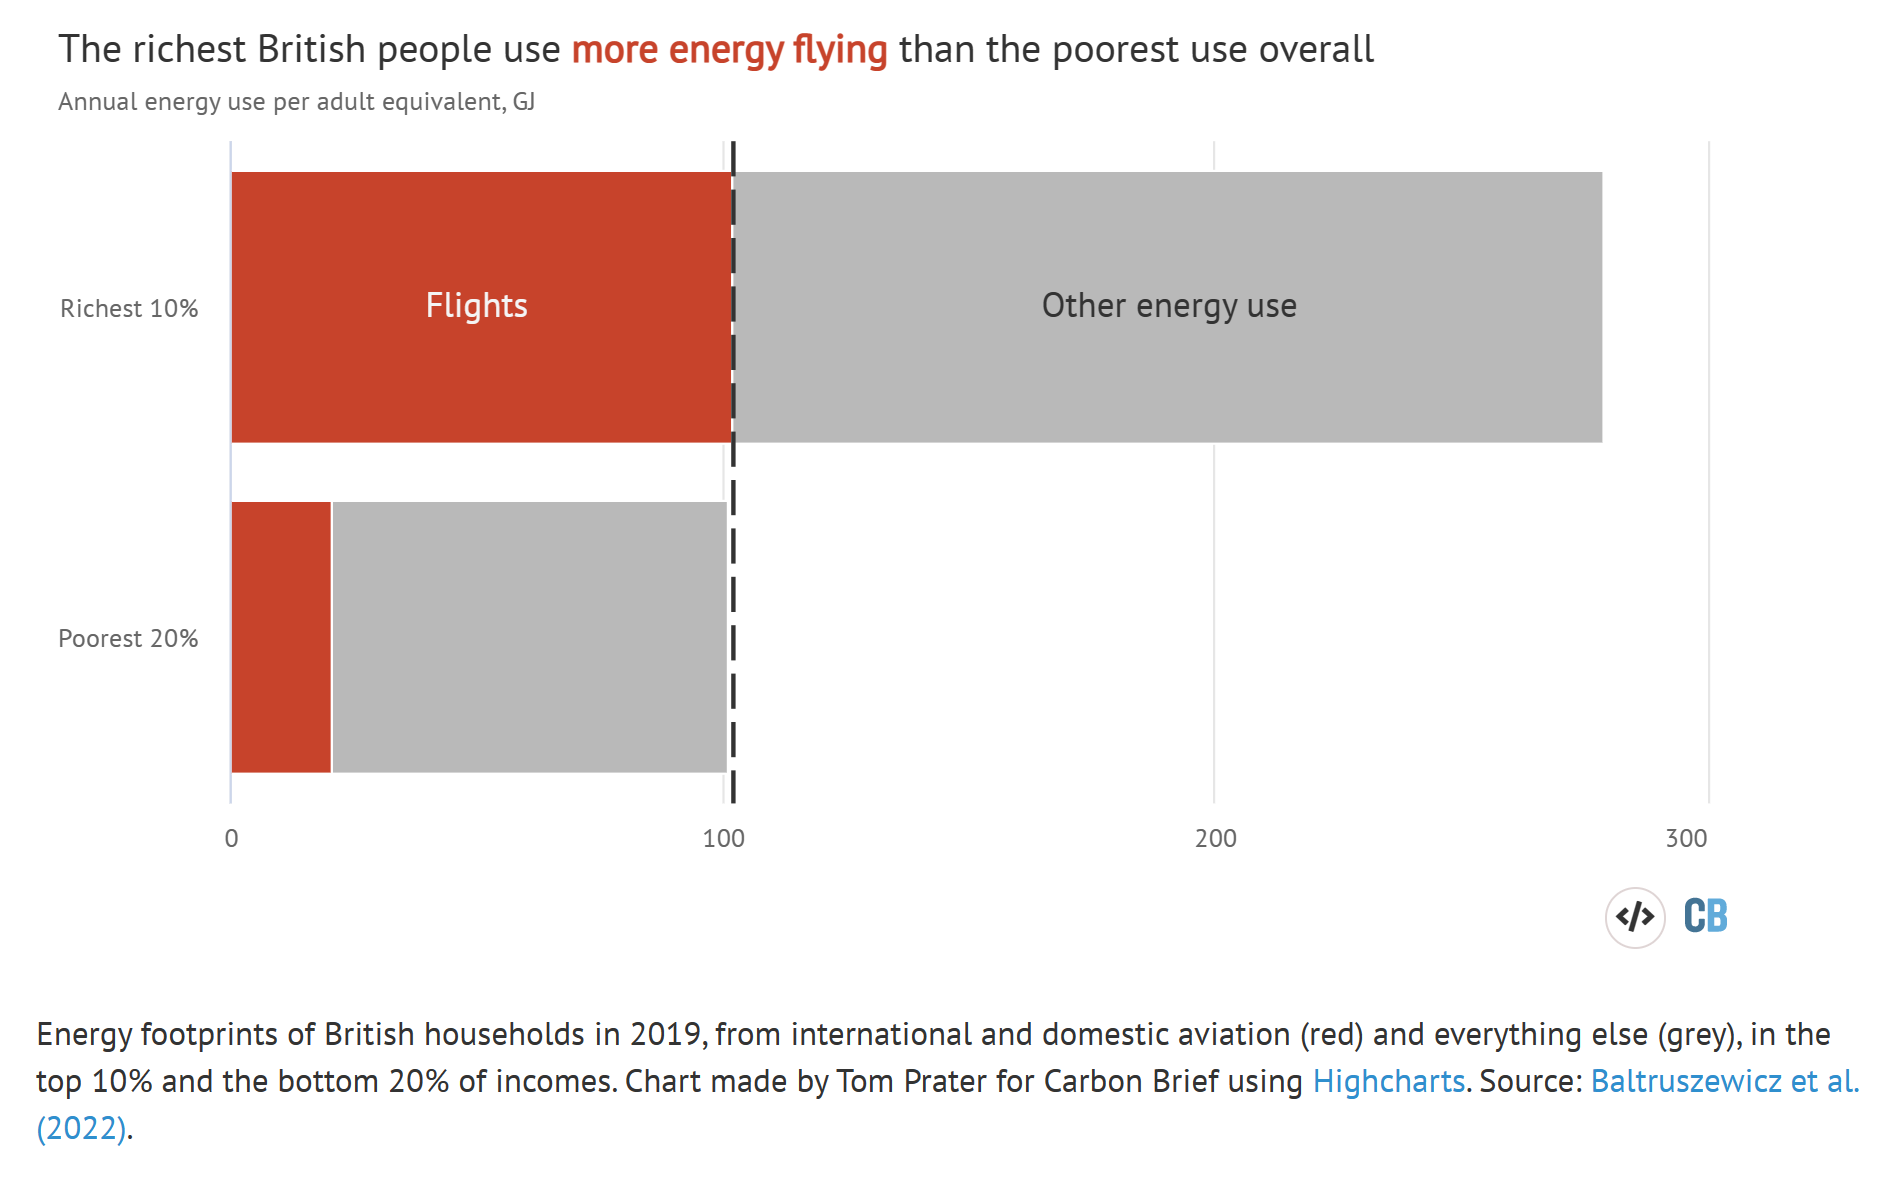
This approach allowed them to isolate how much energy people in different income brackets used for different activities. The chart above shows this breakdown.
The inequality is huge. In 2019, the wealthiest 10% of people in the UK used around three times as much energy driving cars and five times as much for recreational activities, when compared to the bottom 10%.
One of the greatest disparities came from people’s use of planes. Domestic and international flights taken by people with the highest incomes used around five times more energy than those taken by the poorest.
In fact, as the chart below shows, the 102 gigajoules (GJ) used for flying by the average adult in the top 10% of earners in that year was more than the average person in the bottom fifth of earners used for everything, including flying, driving and heating their homes.
Transport experts tell Carbon Brief the figures for air travel are in line with their expectations. “Most people are not aware that 70% of the flights taken in this country are by just 15% of the population,” says Matt Finch, UK policy manager at the NGO Transport & Environment.
Baltruszewicz and her team were also able to assess who precisely was responsible for “unabated excess energy” use. They found that “those who most often overshoot energy use are white, wealthy middle-aged men”. By comparison, Baltruszewicz tells Carbon Brief:
“Those who are most energy poor…They also tend to be non-white, female [and] rent houses…there is so much social injustice engrained in those who don’t have enough energy.” [more]
Richest people in UK ‘use more energy flying’ than poorest do overall
Social outcomes of energy use in the United Kingdom: Household energy footprints and their links to well-being
ABSTRACT: How energy relates to human need satisfaction, for whom, and with what wellbeing outcomes has remained under-researched. We address this gap by investigating the relationship between household energy footprint and well-being in the UK. Our results indicate that car and air transportation contributed the most to the total energy footprint of high-income and high-energy users. We find significant inequalities in the distribution of energy use and that the top energy users with high well-being are driving excess energy use. A more detailed analysis reveals that individuals with protected characteristics are particularly vulnerable to energy poverty and that their contribution to overall energy demand is negligible. We find that focusing on well-being steers the attention towards questions of sufficiency, overconsumption as well as the context within which we satisfy needs. Tackling the issues of energy poverty and inequalities are important for lowering energy demand and need to be addressed as a matter of climate justice.