Greenhouse gas pollution trapped record 49 percent more heat in 2021 than in 1990 – Methane increase in 2021 largest since 1982 – “The primary gases responsible for climate change continue rising rapidly”
23 May 2022 (NOAA) – Greenhouse gas pollution caused by human activities trapped 49 percent more heat in the atmosphere in 2021 than they did in 1990, according to NOAA scientists.
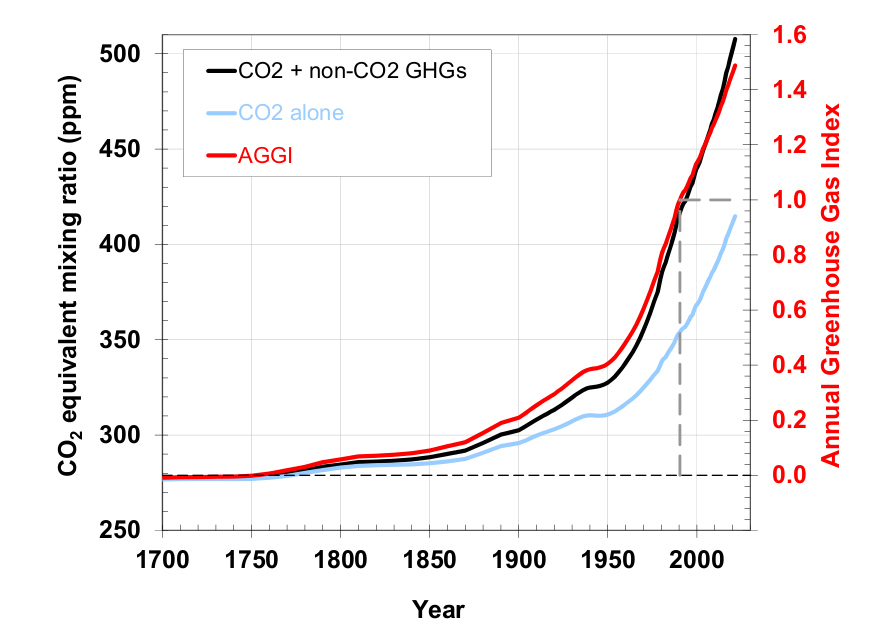
NOAA’s Annual Greenhouse Gas Index, known as the AGGI, tracks increases in the warming influence of human emissions of heat-trapping gases, including carbon dioxide, methane, nitrous oxide, chlorofluorocarbons, and 16 other chemicals. The AGGI converts the complex scientific computations of how much extra heat these gases capture into a single number that can easily be compared to previous years and tracks the rate of change.
The AGGI is indexed to 1990, the baseline year for the Kyoto Protocol and the year the first IPCC Scientific Assessment of Climate Change was published.
“The AGGI tells us the rate at which we are driving global warming,” said Ariel Stein, the acting director of NOAA’s Global Monitoring Laboratory (GML). “Our measurements show the primary gases responsible for climate change continue rising rapidly, even as the damage caused by climate change becomes more and more clear. The scientific conclusion that humans are responsible for their increase is irrefutable.”
In 2021, the AGGI reached a value of 1.49, which means that human-emitted greenhouse gases trapped 49 percent more heat in the atmosphere than in 1990. Because it is based primarily on highly accurate measurements of greenhouse gases in air samples collected around the globe, the result contains little uncertainty.
The biggest culprit
Carbon dioxide, or CO2, is by far the most abundant human-emitted greenhouse gas. Roughly 36 billion metric tons of CO2 are emitted each year by transportation, electrical generation, cement manufacturing, deforestation, agriculture, and many other practices. A substantial fraction of CO2 emitted today will persist in the atmosphere for more than 1,000 years. Not surprisingly, it is also the largest contributor to the AGGI in terms of both amount and rate of increase.
NOAA measurements showed the global average concentration of CO2 in 2021 was 414.7 parts per million (ppm). The annual increase was 2.6 ppm during this year, about the average annual increase for the previous decade, and much higher than the increase measured during 2000-2009. CO2 levels have risen by 61 ppm since 1990, accounting for 80% of the increased heat tracked by the AGGI since that year.
“CO2 is the main player because it stays in the atmosphere and oceans for thousands of years and it is by far the largest contributor to global warming,” said GML Senior Scientist Pieter Tans. “Eliminating CO2 pollution has to be front and center in any efforts to deal with climate change.”
![Annual Increase in Globally-Averaged Atmospheric Methane, 1984-2021. The atmospheric burden of methane has increased more rapidly over the past two years than at any other point in the on-going measurement record, which began in 1983. The recent rapid increase follows a period from 1999 to 2006 when the atmospheric CH4 burden was nearly constant. Causes for the recent increase are not fully understood, but warm temperatures in the Arctic in 2007 and increased precipitation in the tropics during 2007 and 2008 [Dlugokencky et al., 2009] contributed in the early years. Isotopic measurements argue for continued increasing microbial emissions after 2008 (e.g., likely from wetlands or agriculture) [Schaefer et al., 2016; Nisbet et al., 2019, Lan et al., 2021]. Since 2016, the global annual increase in methane has averaged 10.8 ± 4.3 ppb yr-1 compared to an average annual increase of 6.9 ± 3.2 ppb yr-1 over the preceding 5 years (between 2009 and 2015; https://gml.noaa.gov/ccgg/trends_ch4/). The annual methane increase during 2021 was 16.94 ± 0.38 ppb and during 2020 it was 15.29 ± 0.38 ppb. Graphic: Ed Dlugokencky / NOAA / GML](https://desdemonadespair.net/wp-content/uploads/2022/05/Annual-Increase-in-Globally-Averaged-Atmospheric-Methane-1984-2021-Ed-Dlugokencky-NOAA-GML.png)
Methane: Is warming feeding warming?
One of the most important scientific questions for climate scientists is what’s been driving the sharp, sustained increase of the second-most important greenhouse gas – methane – since 2006.
Levels of atmospheric methane, or CH4, averaged 1,895.7 parts per billion during 2021. The 16.9 ppb increase recorded for 2021 was the fastest observed since the early 1980s, when a more rigorous measurement regime was initiated. Methane levels are currently around 162% greater than pre-industrial levels. From NOAA’s observations, scientists estimate the amount of methane emitted in 2021 was 15% greater than the 1984-2006 period.
Methane is the second-most important greenhouse gas in warming the globe. The warming influence of CH4 since pre-industrial times is about a quarter of that from CO2. Causes for the dramatic post-2007 increase are not fully understood, but NOAA scientists have concluded that changes in isotopic composition of atmospheric methane over time point to microbial sources, likely from wetlands, agriculture and landfills, as the dominant driver. Fossil fuel emissions, they suggest, have made a smaller contribution.
“We should absolutely target man-made methane emissions – especially those from fossil fuel – because it is technologically feasible to control them,” said Xin Lan, a CIRES scientist working in the Global Monitoring Lab. “If wetlands are giving off more methane because of warming and changes in global precipitation caused by rising CO2 levels , that’s something we can’t control directly. And that would be very concerning.”
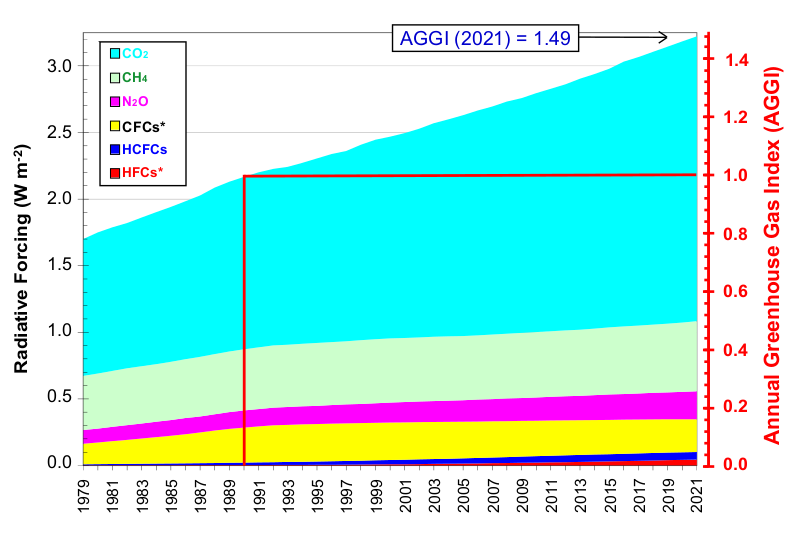
![Global average abundances of the major, well-mixed, long-lived greenhouse gases - carbon dioxide, methane, nitrous oxide, CFC-12 and CFC-11, 1979-2021. These five gases account for about 96 percent of the direct radiative forcing by long-lived greenhouse gases since 1750. The remaining 4 percent is contributed by 15 other halogenated gases including HCFC-22 and HFC-134a, for which NOAA observations are also shown here. Methane data before 1983 are annual averages from D. Etheridge [Etheridge et al., 1998], adjusted to the NOAA calibration scale [Dlugokencky et al., 2005]. Graphic: Montzka, 2022 / NOAA](https://desdemonadespair.net/wp-content/uploads/2022/05/Global-average-abundances-of-major-well-mixed-long-lived-greenhouse-gases-CO2-CH4-N2O-CFC-12-and-CFC-11-1979-2021-Montzka-2022-NOAA.png)
No laughing matter
The third-most important greenhouse gas is one you may have encountered as an anesthesia in the dentist’s chair. Nitrous oxide, or N2O, is another long-lived climate forcing pollutant primarily emitted by people. It is rising every year. But it’s different in that it’s being driven by expanding populations, not energy demands. N2O pollution is primarily a result of fertilizer use to support agriculture and food production, especially for an expanding global population .
“We can find alternative energy sources to replace fossil fuels,” said Stephen Montzka, the GML scientist who leads the AGGI report each year, “but cutting emissions associated with producing food is a very difficult task.”
These three greenhouse gases, plus two banned ozone-depleting chemicals, account for about 96% of the excess heat trapped in the atmosphere due to human activity since 1750. The remaining 4% is from 16 other greenhouse gases also tracked by the AGGI. In aggregate, they trapped an amount of heat equivalent to 508 ppm of CO2 in 2021.
One number to track human impact on climate
NOAA scientists released the first AGGI in 2006 as a way to help policymakers, educators, and the public understand the cumulative impact of greenhouse gases on climate over time.
Scientists benchmarked the AGGI to the year 1750, the onset of the Industrial Revolution, assigning it a value of zero. An AGGI value of 1.0 was assigned to 1990.
The AGGI is based on thousands of air samples collected from sites around the world each year from NOAA’s Global Greenhouse Gas Reference Network. Concentrations of these greenhouse gases and other chemicals are determined through the analysis of those samples at NOAA’s Global Monitoring Laboratory in Boulder, Colorado. Scientists then calculate the amount of extra heat being trapped in the Earth system by these gases and how much that has changed over time to understand the contribution from human activity.
Contact
- Theo Stein, NOAA Communications, theo.stein@noaa.gov
Greenhouse gas pollution trapped 49% more heat in 2021 than in 1990, NOAA finds