CO2 equivalent mixing ratio of atmospheric greenhouse gases, 1979-2022. The NOAA Annual Greenhouse Gas Index (AGGI) tracks increases in the warming influence of heat-trapping gases generated by human activity, including carbon dioxide, methane, nitrous oxide, chlorofluorocarbons, and 15 other gases. This illustration depicts the increase in radiative forcing, relative to 1750, of virtually all long-lived greenhouse gases. The AGGI, which is indexed to 1 for the year 1990, is shown on the right axis. Graphic: NOAA Global Monitoring Laboratory

NOAA index tracks how greenhouse gas pollution amplified global warming in 2022 – Methane and nitrous oxide rise near record levels – “Alternative energy sources to replace fossil fuels exist, but cutting emissions associated with producing food is perhaps an even more difficult task”

23 May 2023 (NOAA) – Greenhouse gas pollution from human activity trapped 49 percent more heat in the atmosphere during 2022 than those same gases did in 1990, according to an annual NOAA report. NOAA’s Annual Greenhouse Gas Index, known as the AGGI, tracks increases in the warming influence of heat-trapping gases generated by human activity, […]

Annual Greenhouse Gas Index (AGGI), 1700-2021. For 2021, the AGGI was a record high 1.49, representing an increase in total direct radiative forcing of 49 percent since 1990. The atmospheric abundance of CO2 has increased by an average of 1.88 ppm per year over the past 42 years (1979-2021). This increase in CO2 is accelerating — while it averaged about 1.6 ppm per year in the 1980s and 1.5 ppm per year in the 1990s, the growth rate increased to 2.4 ppm per year during the last decade (2011-2021). The annual CO2 increase from 1 January 2021 to 1 January 2022 was 2.60 ± 0.08 ppm. Graphic: Montzka, 2022 / NOAA

Greenhouse gas pollution trapped record 49 percent more heat in 2021 than in 1990 – Methane increase in 2021 largest since 1982 – “The primary gases responsible for climate change continue rising rapidly”

23 May 2022 (NOAA) – Greenhouse gas pollution caused by human activities trapped 49 percent more heat in the atmosphere in 2021 than they did in 1990, according to NOAA scientists. NOAA’s Annual Greenhouse Gas Index, known as the AGGI, tracks increases in the warming influence of human emissions of heat-trapping gases, including carbon dioxide, methane, […]

Global net anthropogenic greenhouse gas emissions projected to 2050. Projected global GHG emissions from Nationally Determined Contribution (NDCs) announced prior to COP26 would make it likely that warming will exceed 1.5°C and also make it harder after 2030 to limit warming to below 2°C. Graphic: IPCC

Amid backsliding on climate, the renewables effort now must be tripled – “A litany of broken climate promises”

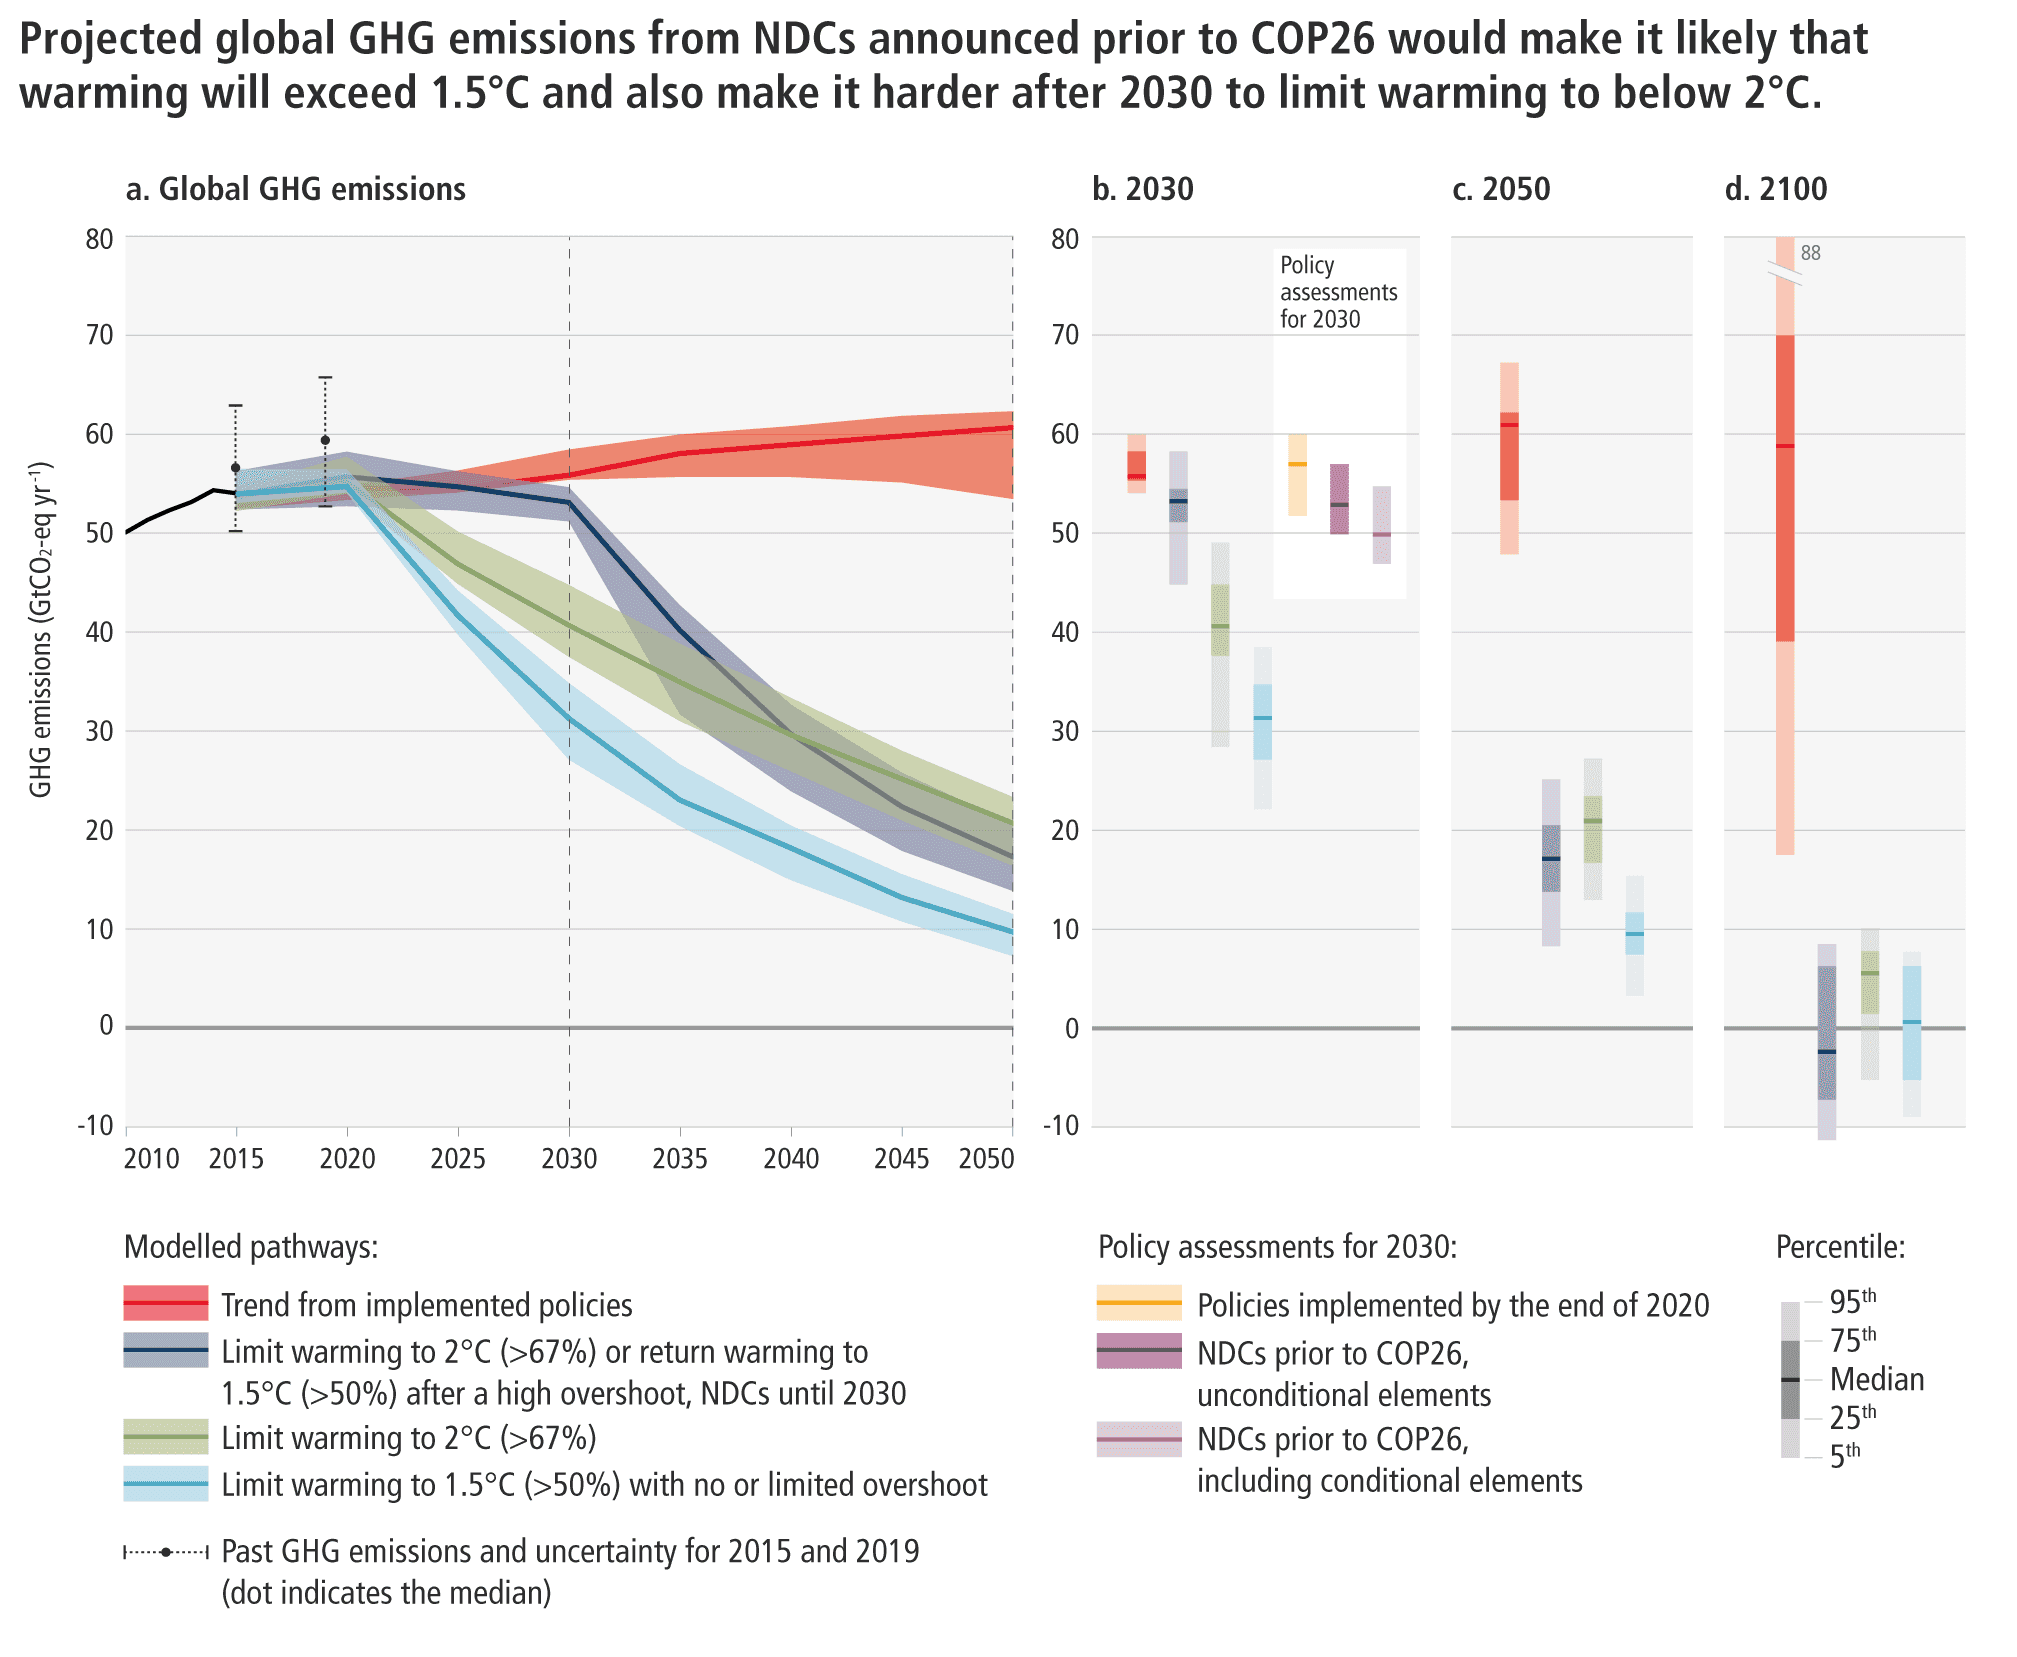
By António Guterres 4 April 2022 (The Washington Post) – A report released Monday by the Intergovernmental Panel on Climate Change is a litany of broken climate promises. Together with the IPCC’s previous two reports on physical science and adaptation in the past year, it reveals the yawning gap between climate pledges and reality. And the reality is that we are […]

Sateliite data showing the 2021 Antarctic ozone hole, which reached its maximum area on 7 October 2021 and ranked as the 13th-largest such feature since 1979. This view, from a NASA video, shows its current extent based on satellite data. Data: Paul Newman and Eric Nash / NASA / Ozone Watch. Graphic: Joshua Stevens

Video: Larger-than-average ozone hole over Antarctica in 2021 – Ozone layer recovery slower than anticipated, will be no earlier than 2070

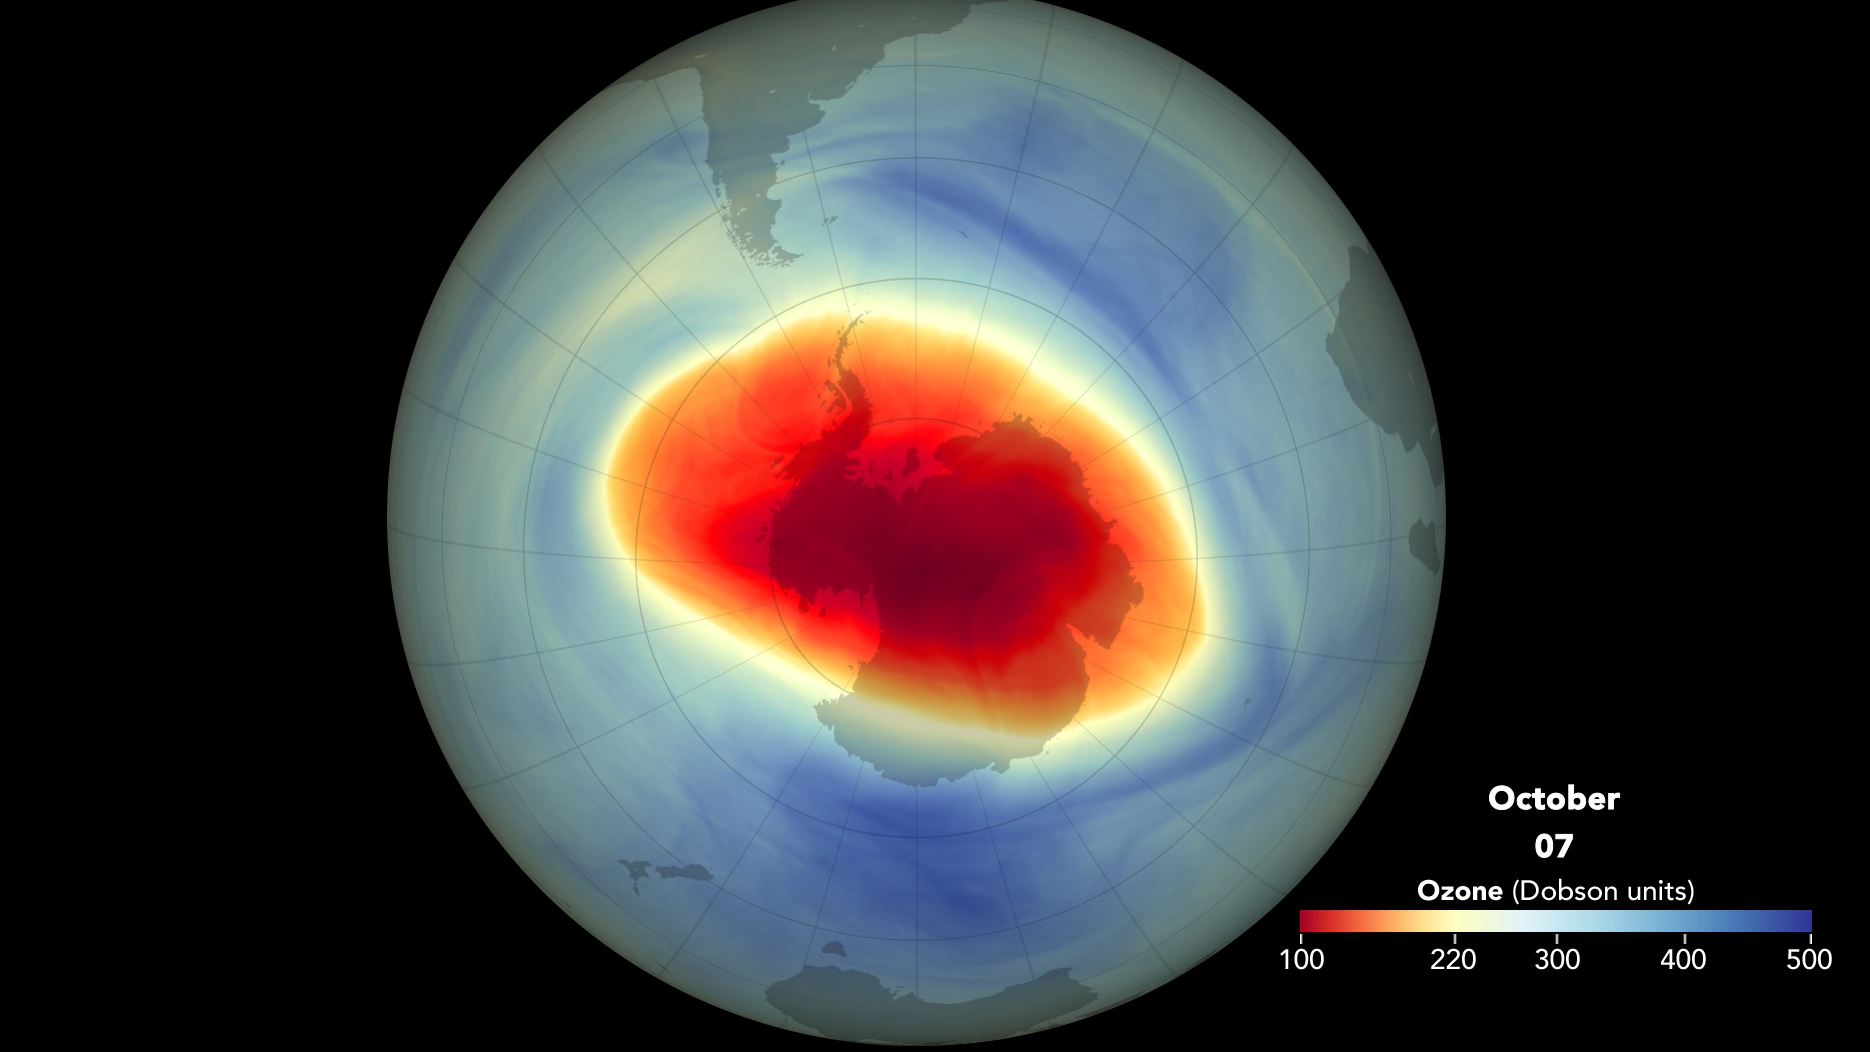
By Elizabeth Howell 5 November 2021 (Space.com) – A new NASA video highlights the giant ozone hole that opened over Antarctica this year. A cold Southern Hemisphere winter, and possible effects of global warming, have caused the hole to grow to its 13th-largest extent since 1979. The ozone depletion you see in the NASA video is monitored by three […]

Total greenhouse gas emissions from China and OECD nations, 1990-2019. In 2019, China’s GHG emissions passed the 14 gigaton threshold for the first time, reaching 14,093 million metric tons of CO2 equivalent (MMt CO2e). This represents a more than tripling of 1990 levels, and a 25 percent increase over the past decade. As a result, China’s share of the 2019 global emissions total of 52 gigatons rose to 27 percent. Data: Rhodium Group / UNFCCC. Graphic: Rhodium Group

China’s greenhouse gas emissions exceeded the developed world for the first time in 2019

By Kate Larsen, Hannah Pitt, Mikhail Grant, and Trevor Houser 6 May 2021 (Rhodium Group) – Each year Rhodium Group provides the most up-to-date global and country-level greenhouse gas (GHG) emissions estimates through the ClimateDeck (a partnership with Breakthrough Energy). In addition to our preliminary US and China GHG estimates for 2020, Rhodium provides annual estimates of economy-wide emissions—including all […]

Annual Greenhouse Gas Index (AGGI), 1750-2020. For 2020, the AGGI was a record high 1.47, representing an increase in total direct radiative forcing of 47 percent since 1990. This increase in CO2 is accelerating — while it averaged about 1.6 ppm per year in the 1980s and 1.5 ppm per year in the 1990s, the growth rate increased to 2.4 ppm per year during the last decade (2009-2020). Pre-1978 changes in the CO2-equivalent abundance and AGGI based on the ongoing measurements of all greenhouse gases reported here, measurements of CO2 going back to the 1950s from C.D. Keeling [Keeling et al., 1958], and atmospheric changes derived from air trapped in ice and snow above glaciers [Machida et al., 1995, Battle et al., 1996, Etheridge, et al., 1996; Butler, et al., 1999]. Equivalent CO2 atmospheric amounts (in ppm) are derived with the relationship between CO2 concentrations and radiative forcing from all long-lived greenhouse gases. Graphic: Butler and Montzka, 2021 / NOAA

Another record high for NOAA Annual Greenhouse Gas Index in 2020 – CO2 increase continues accelerating – No slowdown from Covid pandemic seen

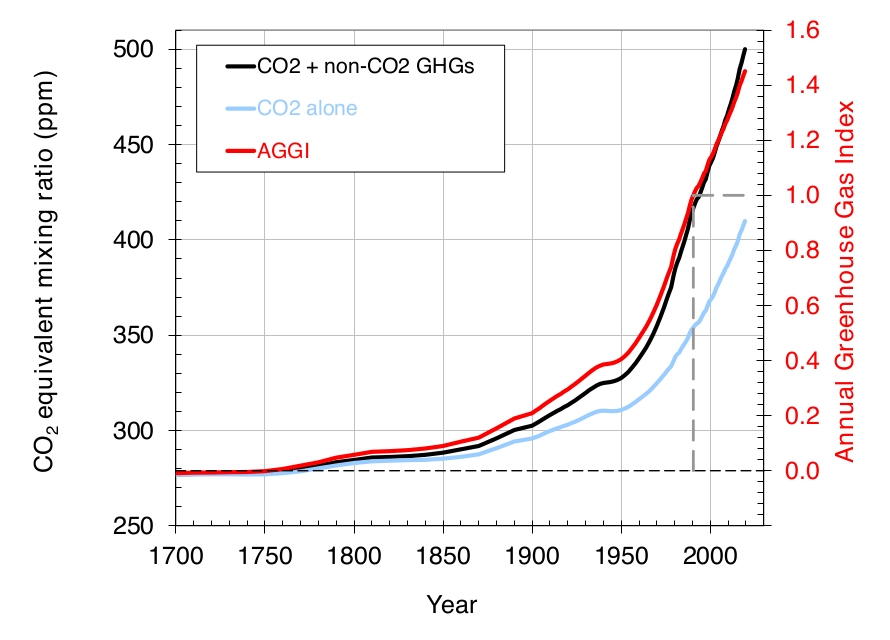
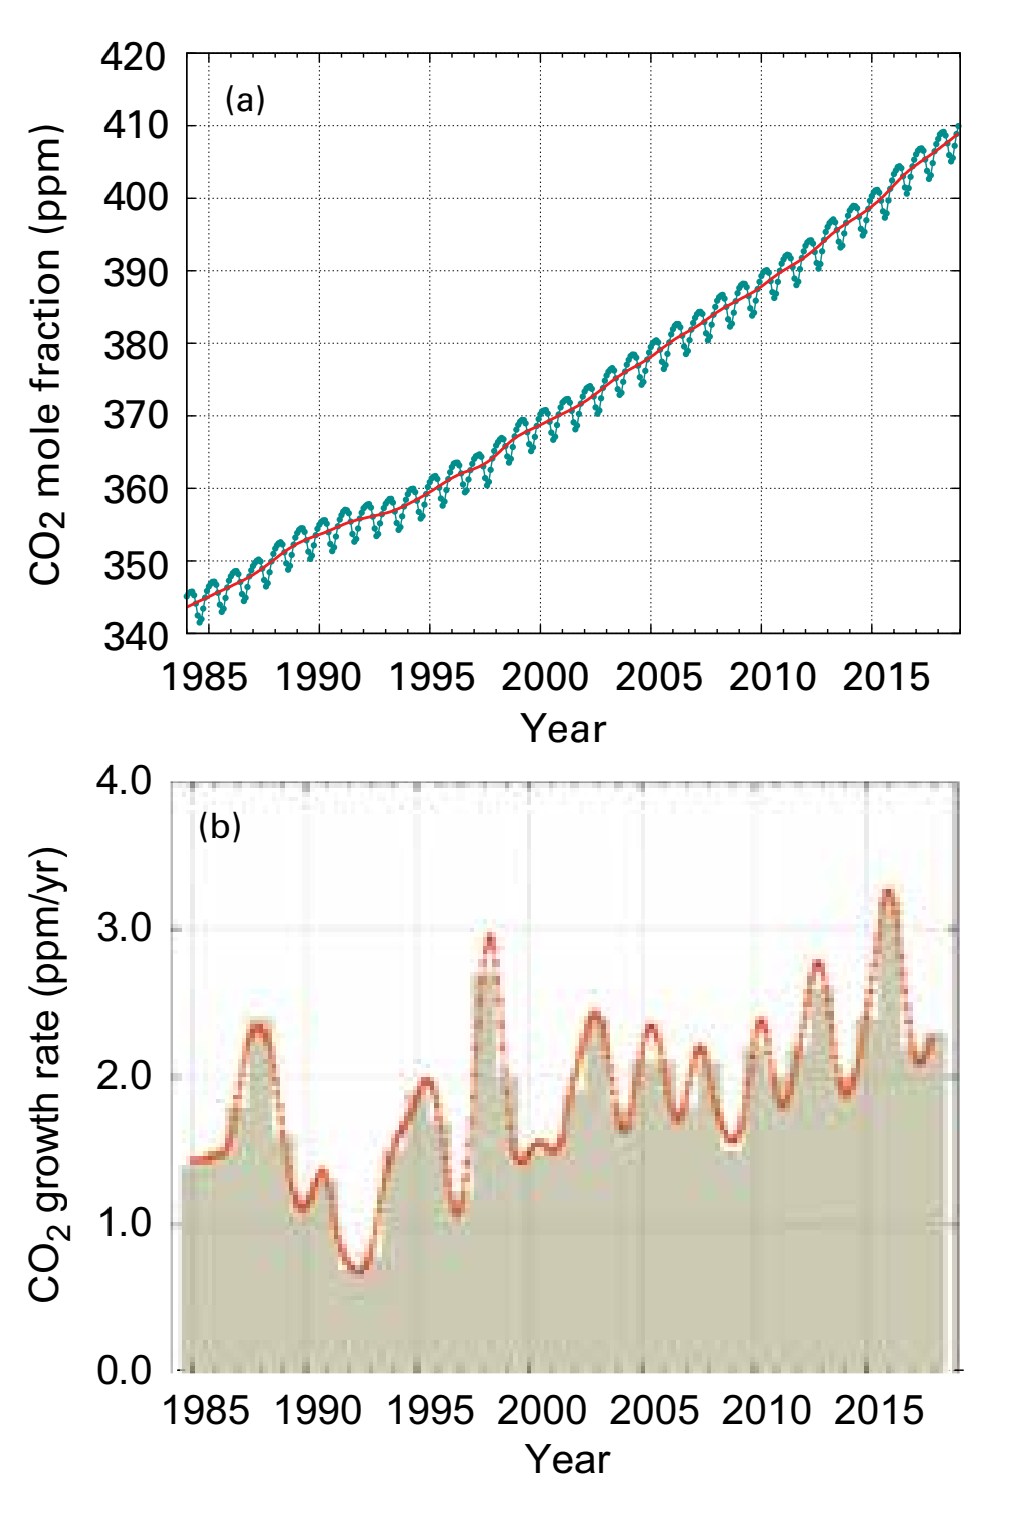
26 May 2021 (NOAA) – […] The atmospheric abundance of CO2 has increased by an average of 1.85 ppm per year over the past 41 years (1979-2020). This increase in CO2 is accelerating — while it averaged about 1.6 ppm per year in the 1980s and 1.5 ppm per year in the 1990s, the growth rate increased to […]

Annual Greenhouse Gas Index (AGGI), 1750-2019. For 2019, the AGGI was a record high 1.45, representing an increase in total direct radiative forcing of 45% since 1990. The increase in radiative forcing from CO2 alone since 1990 was 60.6%. Pre-1978 changes in the CO2-equivalent abundance and AGGI are based on the ongoing measurements of all greenhouse gases reported here, measurements of CO2 going back to the 1950s from C.D. Keeling (Keeling et al., 1958), and atmospheric changes derived from air trapped in ice and snow above glaciers (Machida et al., 1995, Battle et al., 1996, Etheridge, et al., 1996; Butler, et al., 1999). Equivalent CO2 atmospheric amounts (in ppm) are derived with the relationship between CO2 concentrations and radiative forcing from all long-lived greenhouse gases. Graphic: Butler and Montzka, 2020 / NOAA

NOAA Annual Greenhouse Gas Index reached another record high in 2019 – Total direct radiative forcing has increased 45 percent since 1990

14 May 2020 (NOAA) – […] The NOAA monitoring program provides high-precision measurements of the global abundance and distribution of long-lived greenhouse gases that are used to calculate changes in radiative climate forcing. Air samples are collected through the NOAA/GML global air sampling network, including a cooperative program for the carbon gases which provides samples […]

Total column ozone field (in Dobson Units) from CAMS, 1 April 2020 - 6 April 2020, showing values below 250 DU over large parts of the Arctic. Video: Copernicus Atmosphere Monitoring Service / ECMWF

Arctic ozone depletion tracks at record levels in Spring 2020

9 April 2020 (WMO) – Depletion of the ozone layer, ­ the shield that protects life on Earth from harmful levels of ultraviolet radiation, ­is at an unprecedented level over large parts of the Arctic this spring . This phenomenon is caused by the continuing presence of ozone­-depleting substances in the atmosphere and a very […]

Hansen, et al. (1988) projections compared with observations on a temperature vs. time basis (top) and temperature vs. external forcing (bottom). Graphic: Hausfather, et al., 2019 / Geophysical Research Letters

Early climate modelers got global warming right, new report finds – “The warming we have experienced is pretty much exactly what climate models predicted it would be as much as 30 years ago”

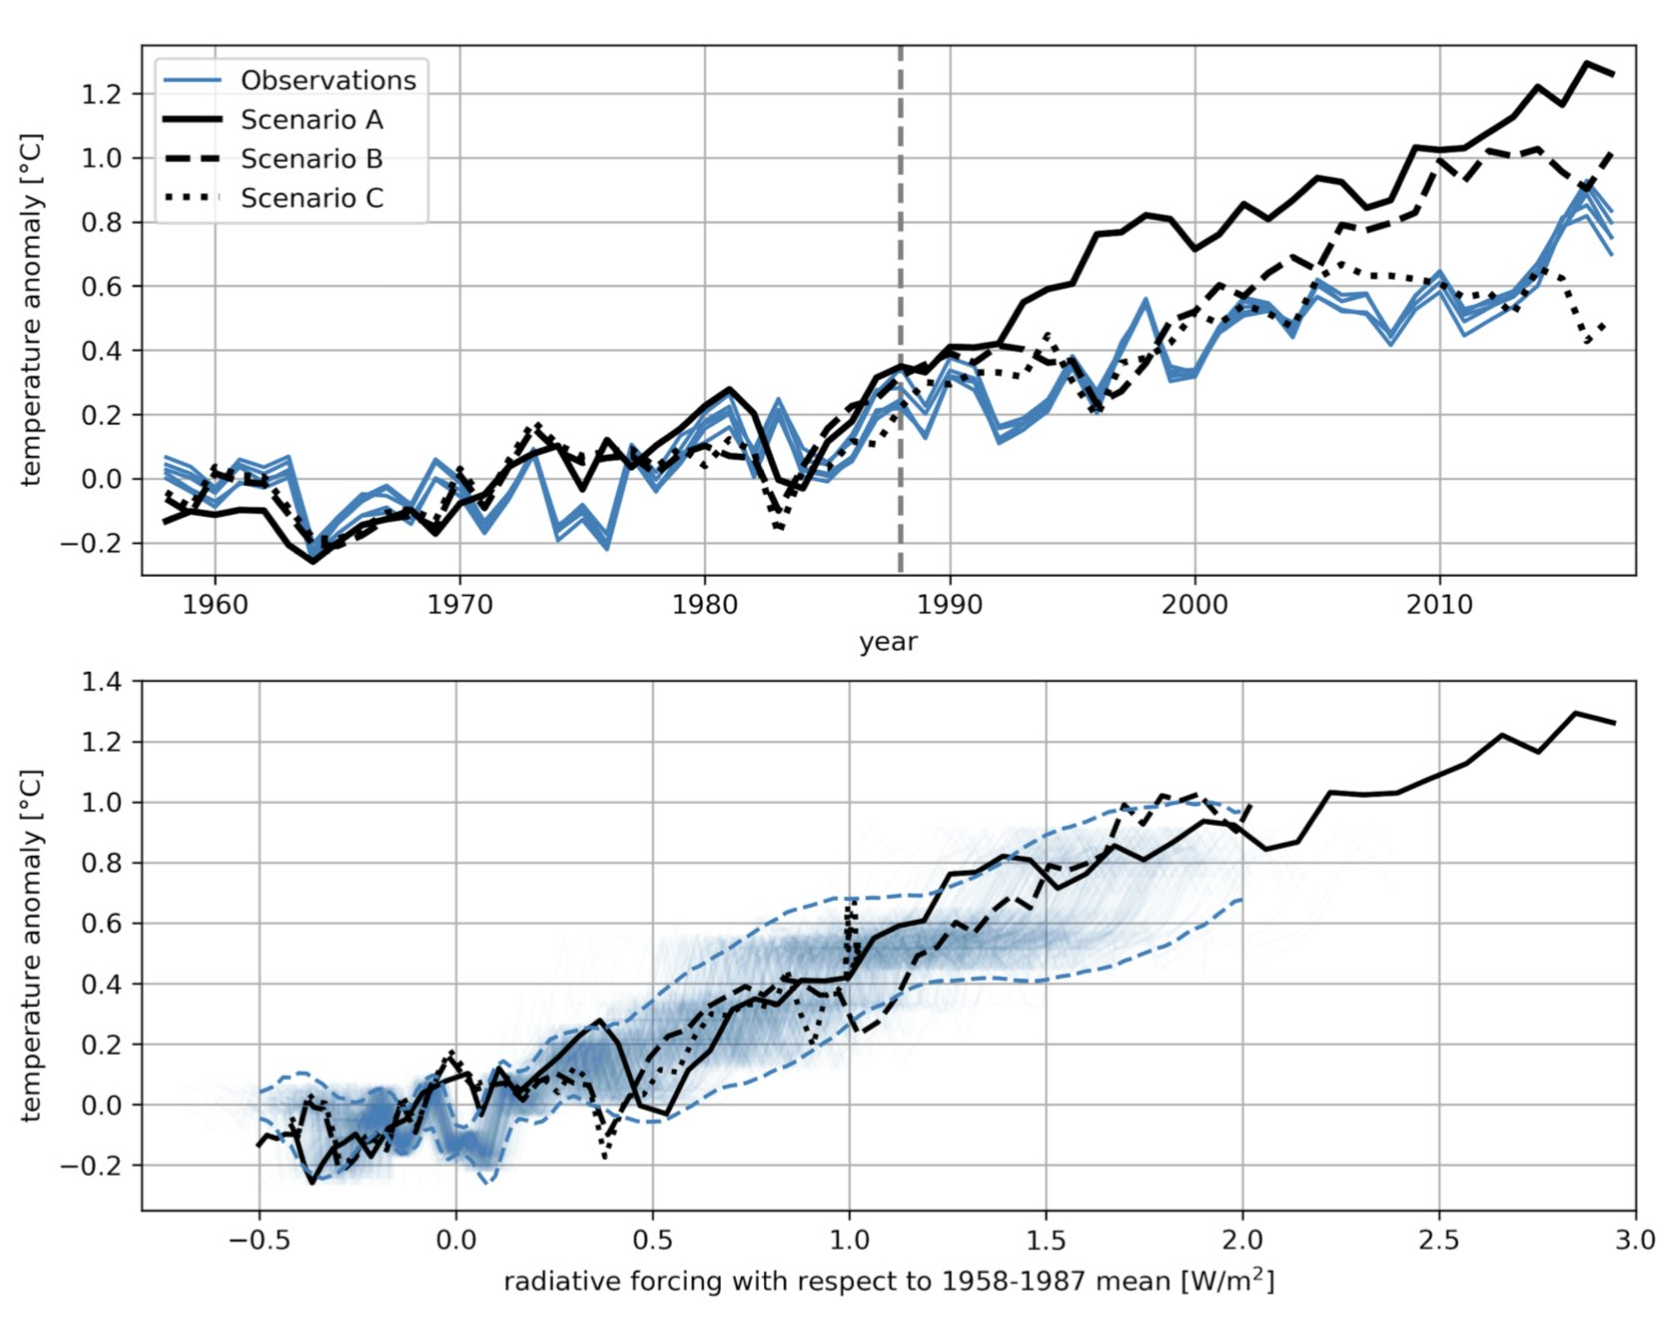
By Robert Sanders 4 December 2019 (Berkeley News) – Climate skeptics have long raised doubts about the accuracy of computer models that predict global warming, but it turns out that most of the early climate models were spot-on, according to a look-back by climate scientists at the University of California, Berkeley, Massachusetts Institute of Technology […]

Globally averaged CO2 mole fraction (a) and its growth rate (b) from 1984 to 2018. Increases in successive annual means are shown as shaded columns in (b). The red line in (a) is the monthly mean with the seasonal variation removed; the blue dots and line depict the monthly averages. Observations from 129 stations have been used for this analysis. Graphic: WMO

Greenhouse gas concentrations in atmosphere reached yet another high in 2018

GENEVA, 25 November 2019 (WMO) – Levels of heat-trapping greenhouse gases in the atmosphere have reached another new record high, according to the World Meteorological Organization. This continuing long-term trend means that future generations will be confronted with increasingly severe impacts of climate change, including rising temperatures, more extreme weather, water stress, sea level rise […]
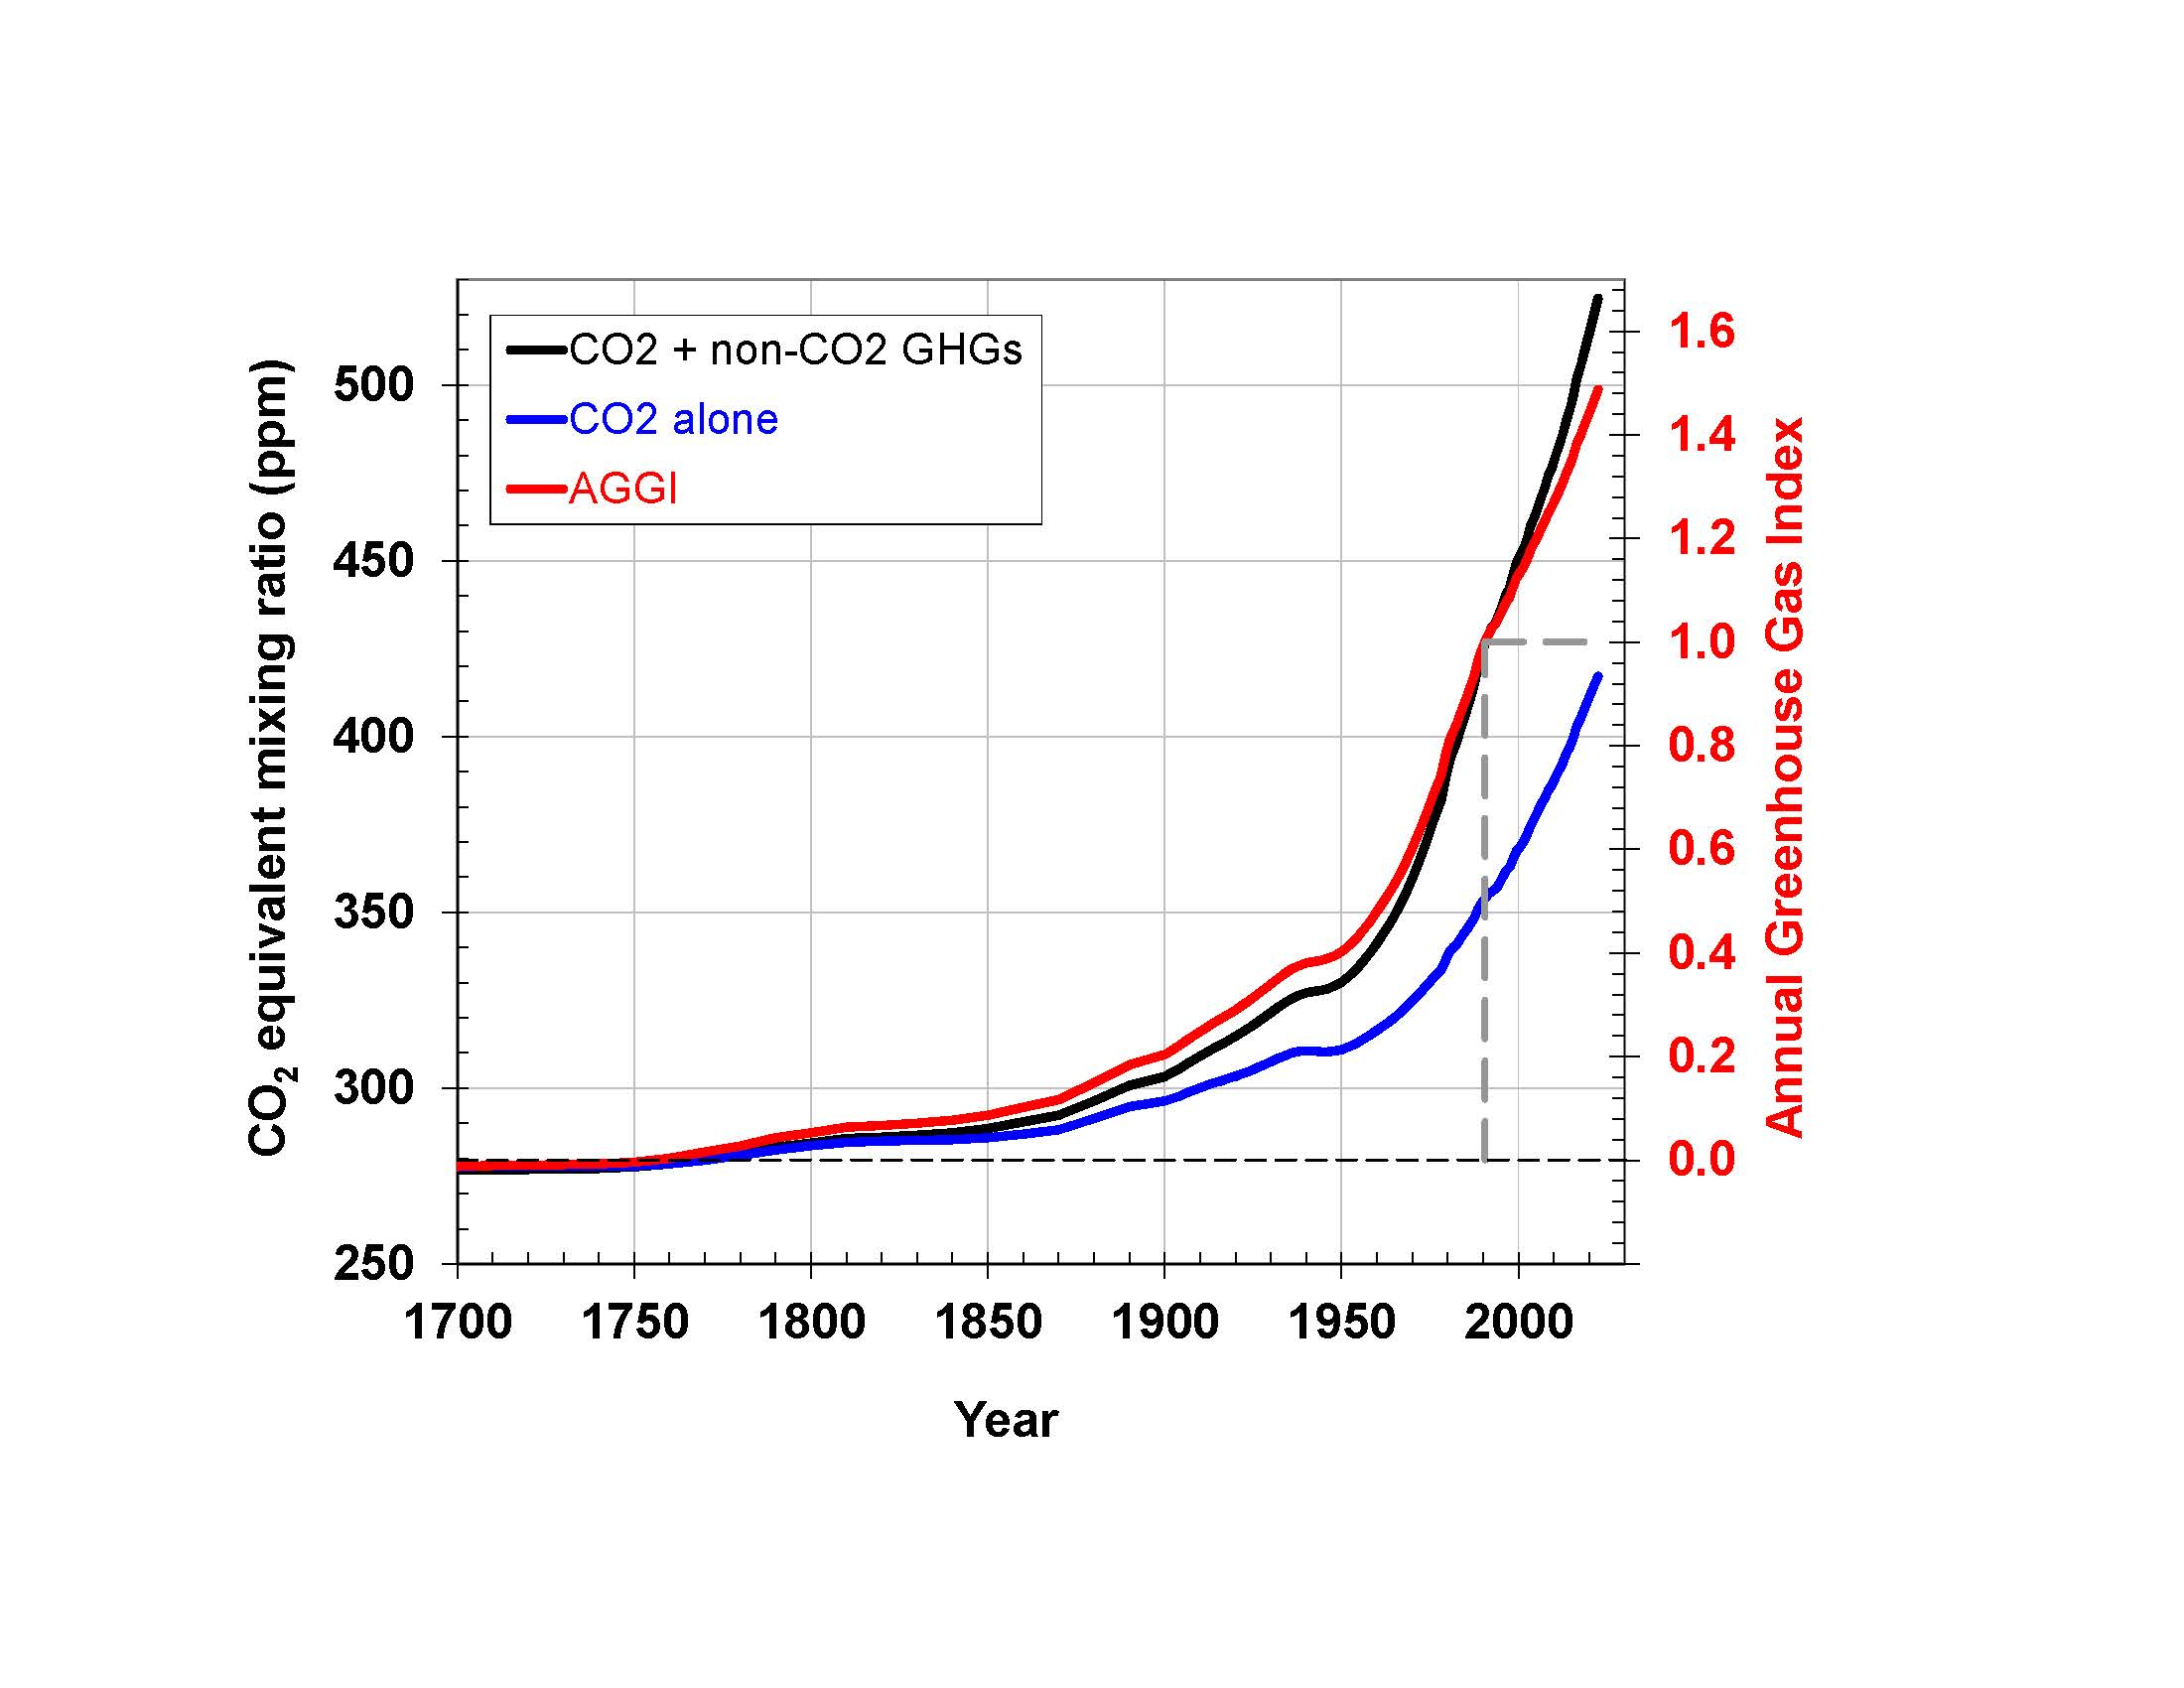
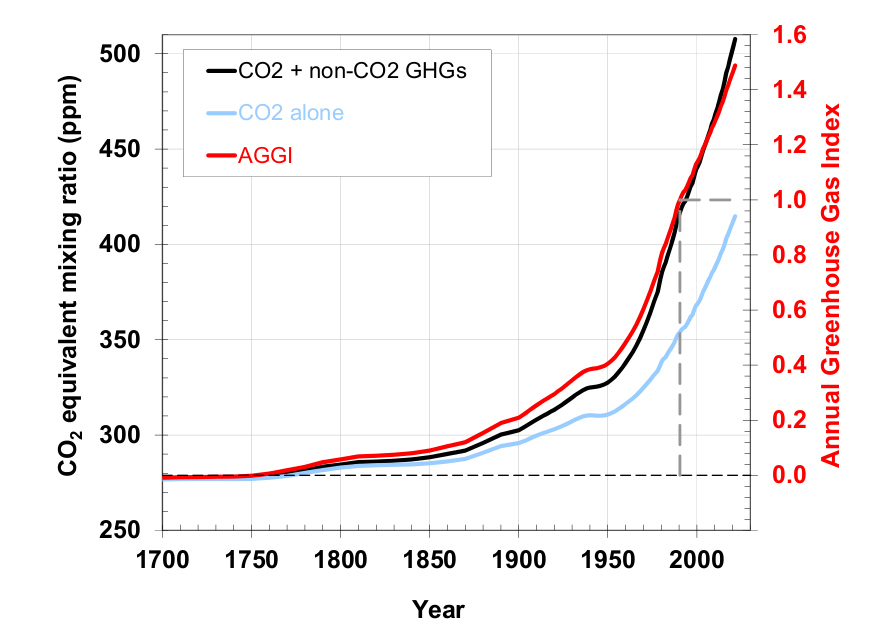
Social media & sharing icons powered by UltimatelySocial