2 September 2024 (The Juice Media) – Hello I’m from your local Government™ franchise with an update on All The Latest Bullshit. Today’s update is brought to you by the Government of Japan. Hello, I’m from the Government of Japan. Where we’ve issued a warrant for the arrest of Captain Paul Watson. Wanted for the […]
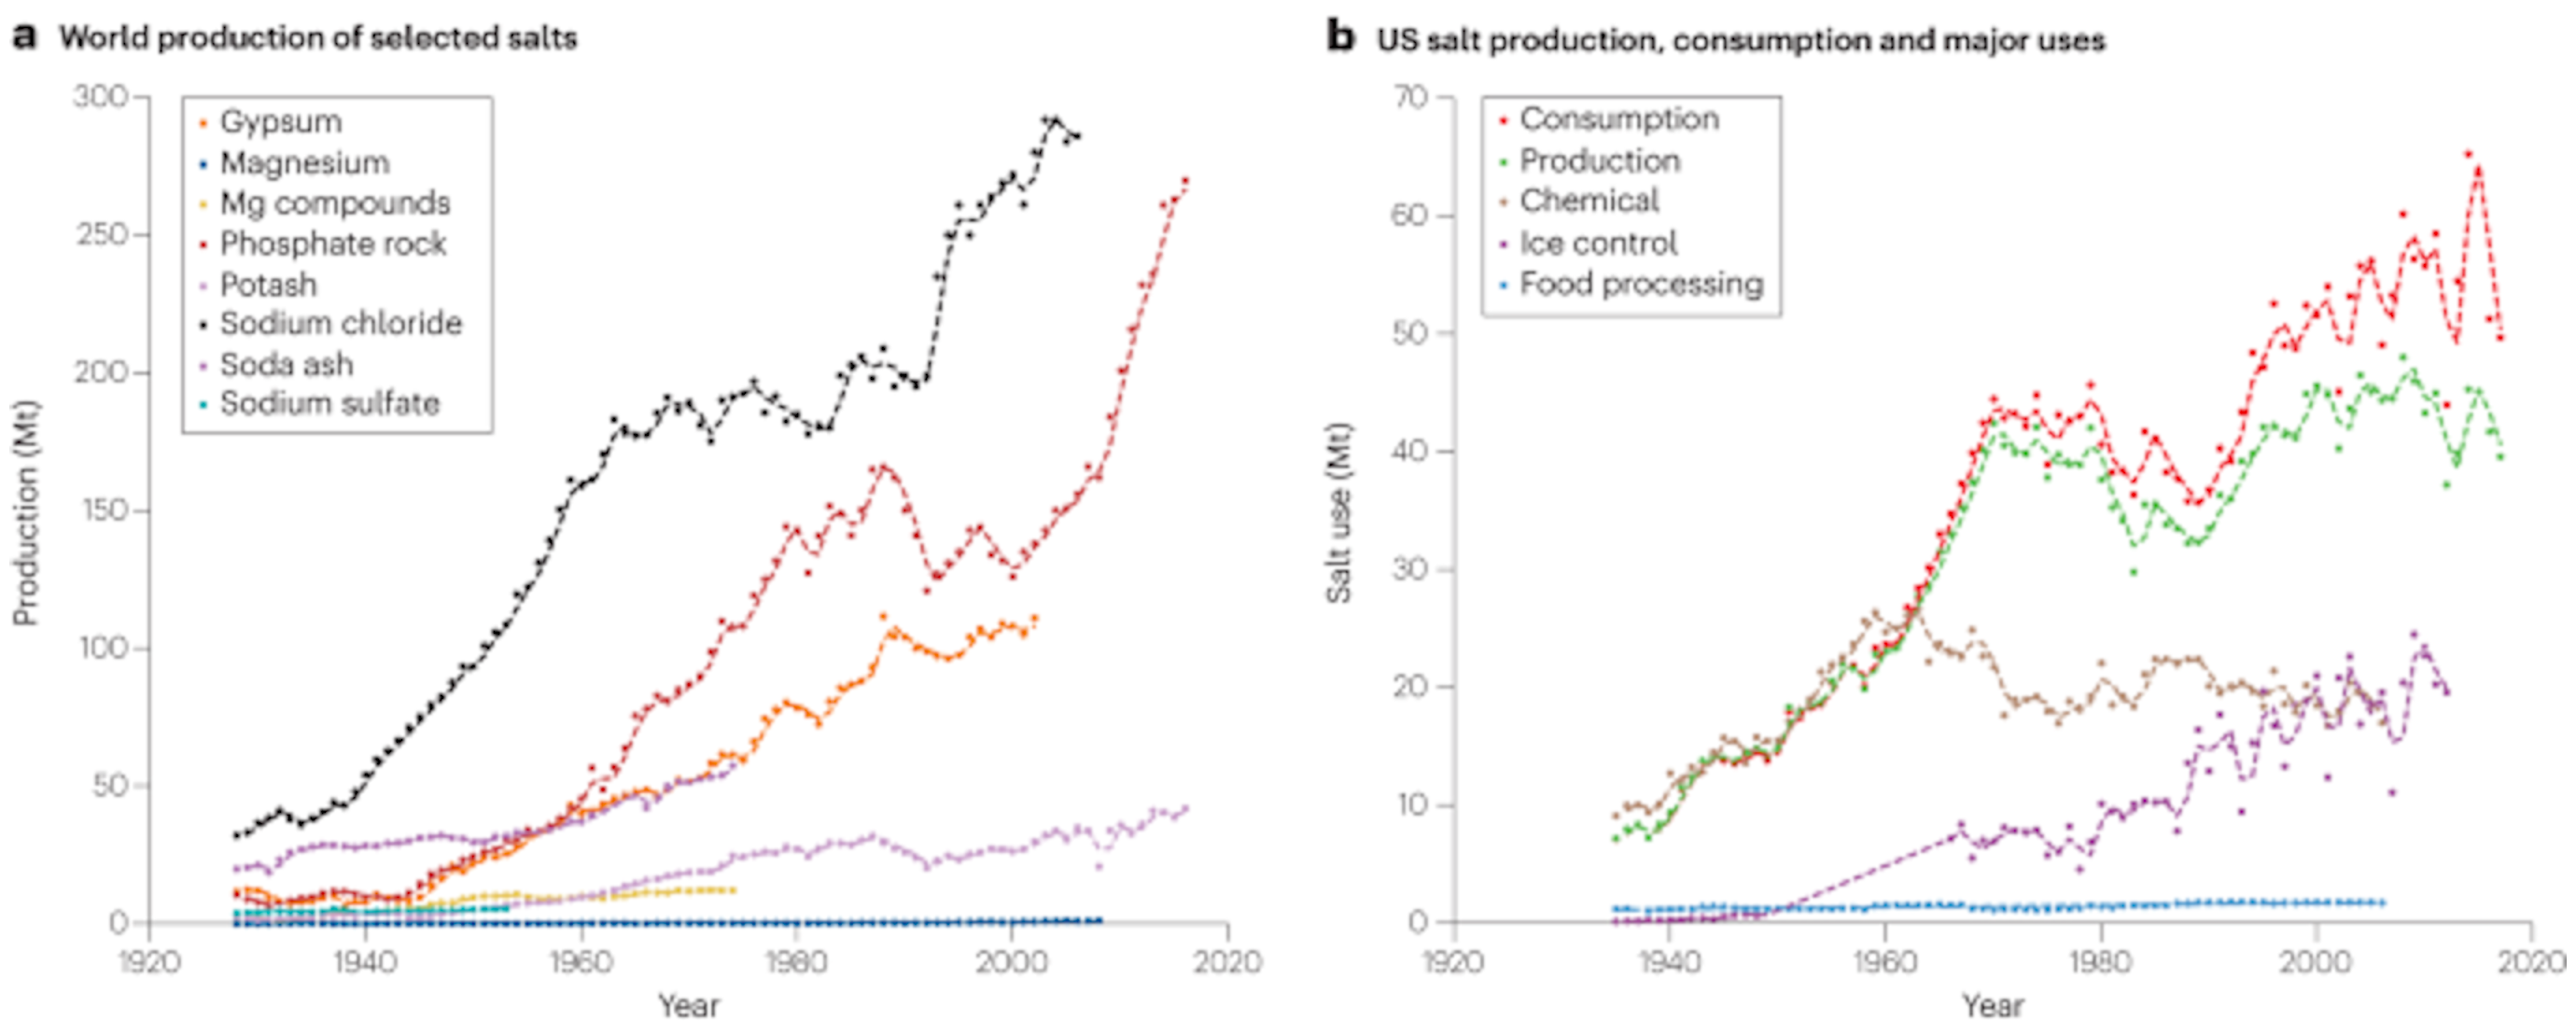
31 October 2023 (University of Maryland) – The influx of salt in streams and rivers is an ‘existential threat,’ according to a research team led by a UMD geologist. The planet’s demand for salt comes at a cost to the environment and human health, according to a new scientific review led by University of Maryland Geology Professor Sujay Kaushal. Published […]
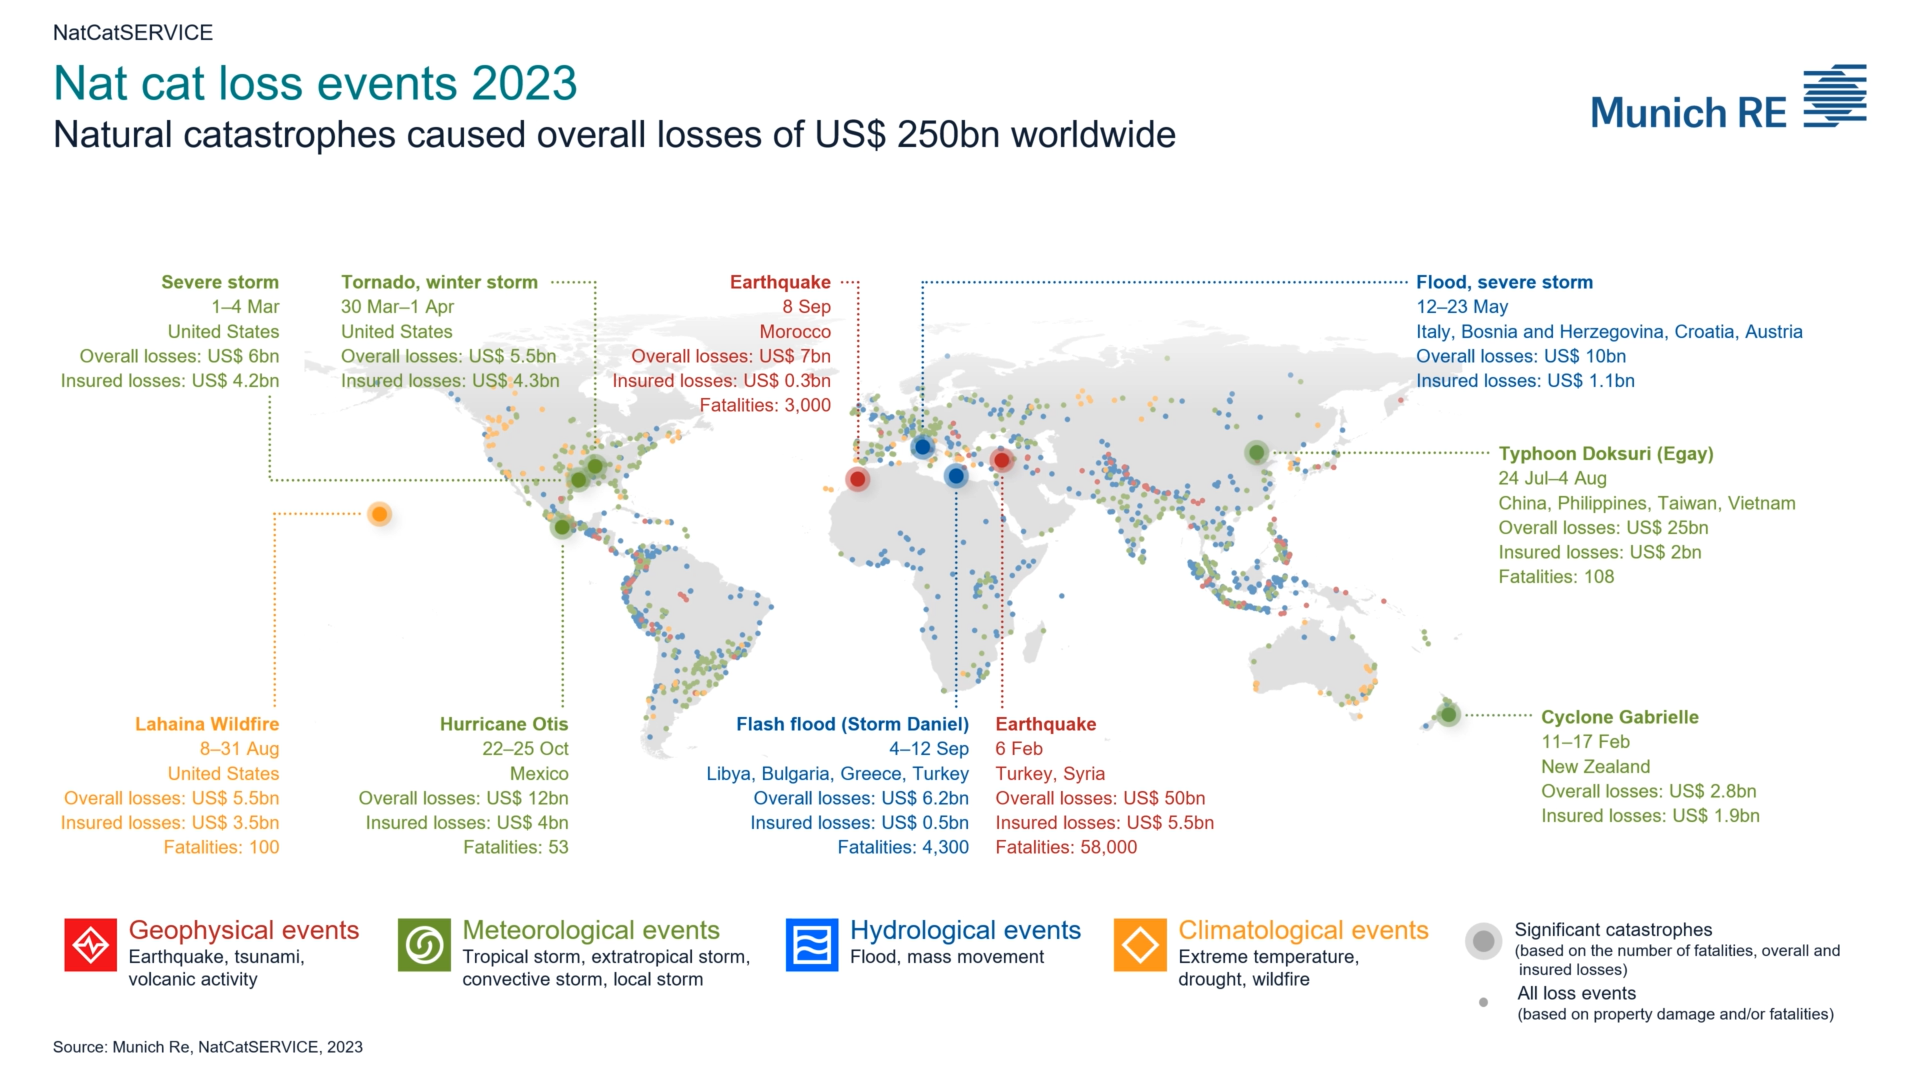
9 January 2024 (Munich Re) – Worldwide, natural disasters in 2023 resulted in losses of around US$ 250bn (previous year US$ 250bn), with insured losses of US$ 95bn (previous year US$ 125bn). Overall losses tally with the five-year average, while insured losses were slightly below the average figure of US$ 105bn. Unlike in previous years, […]
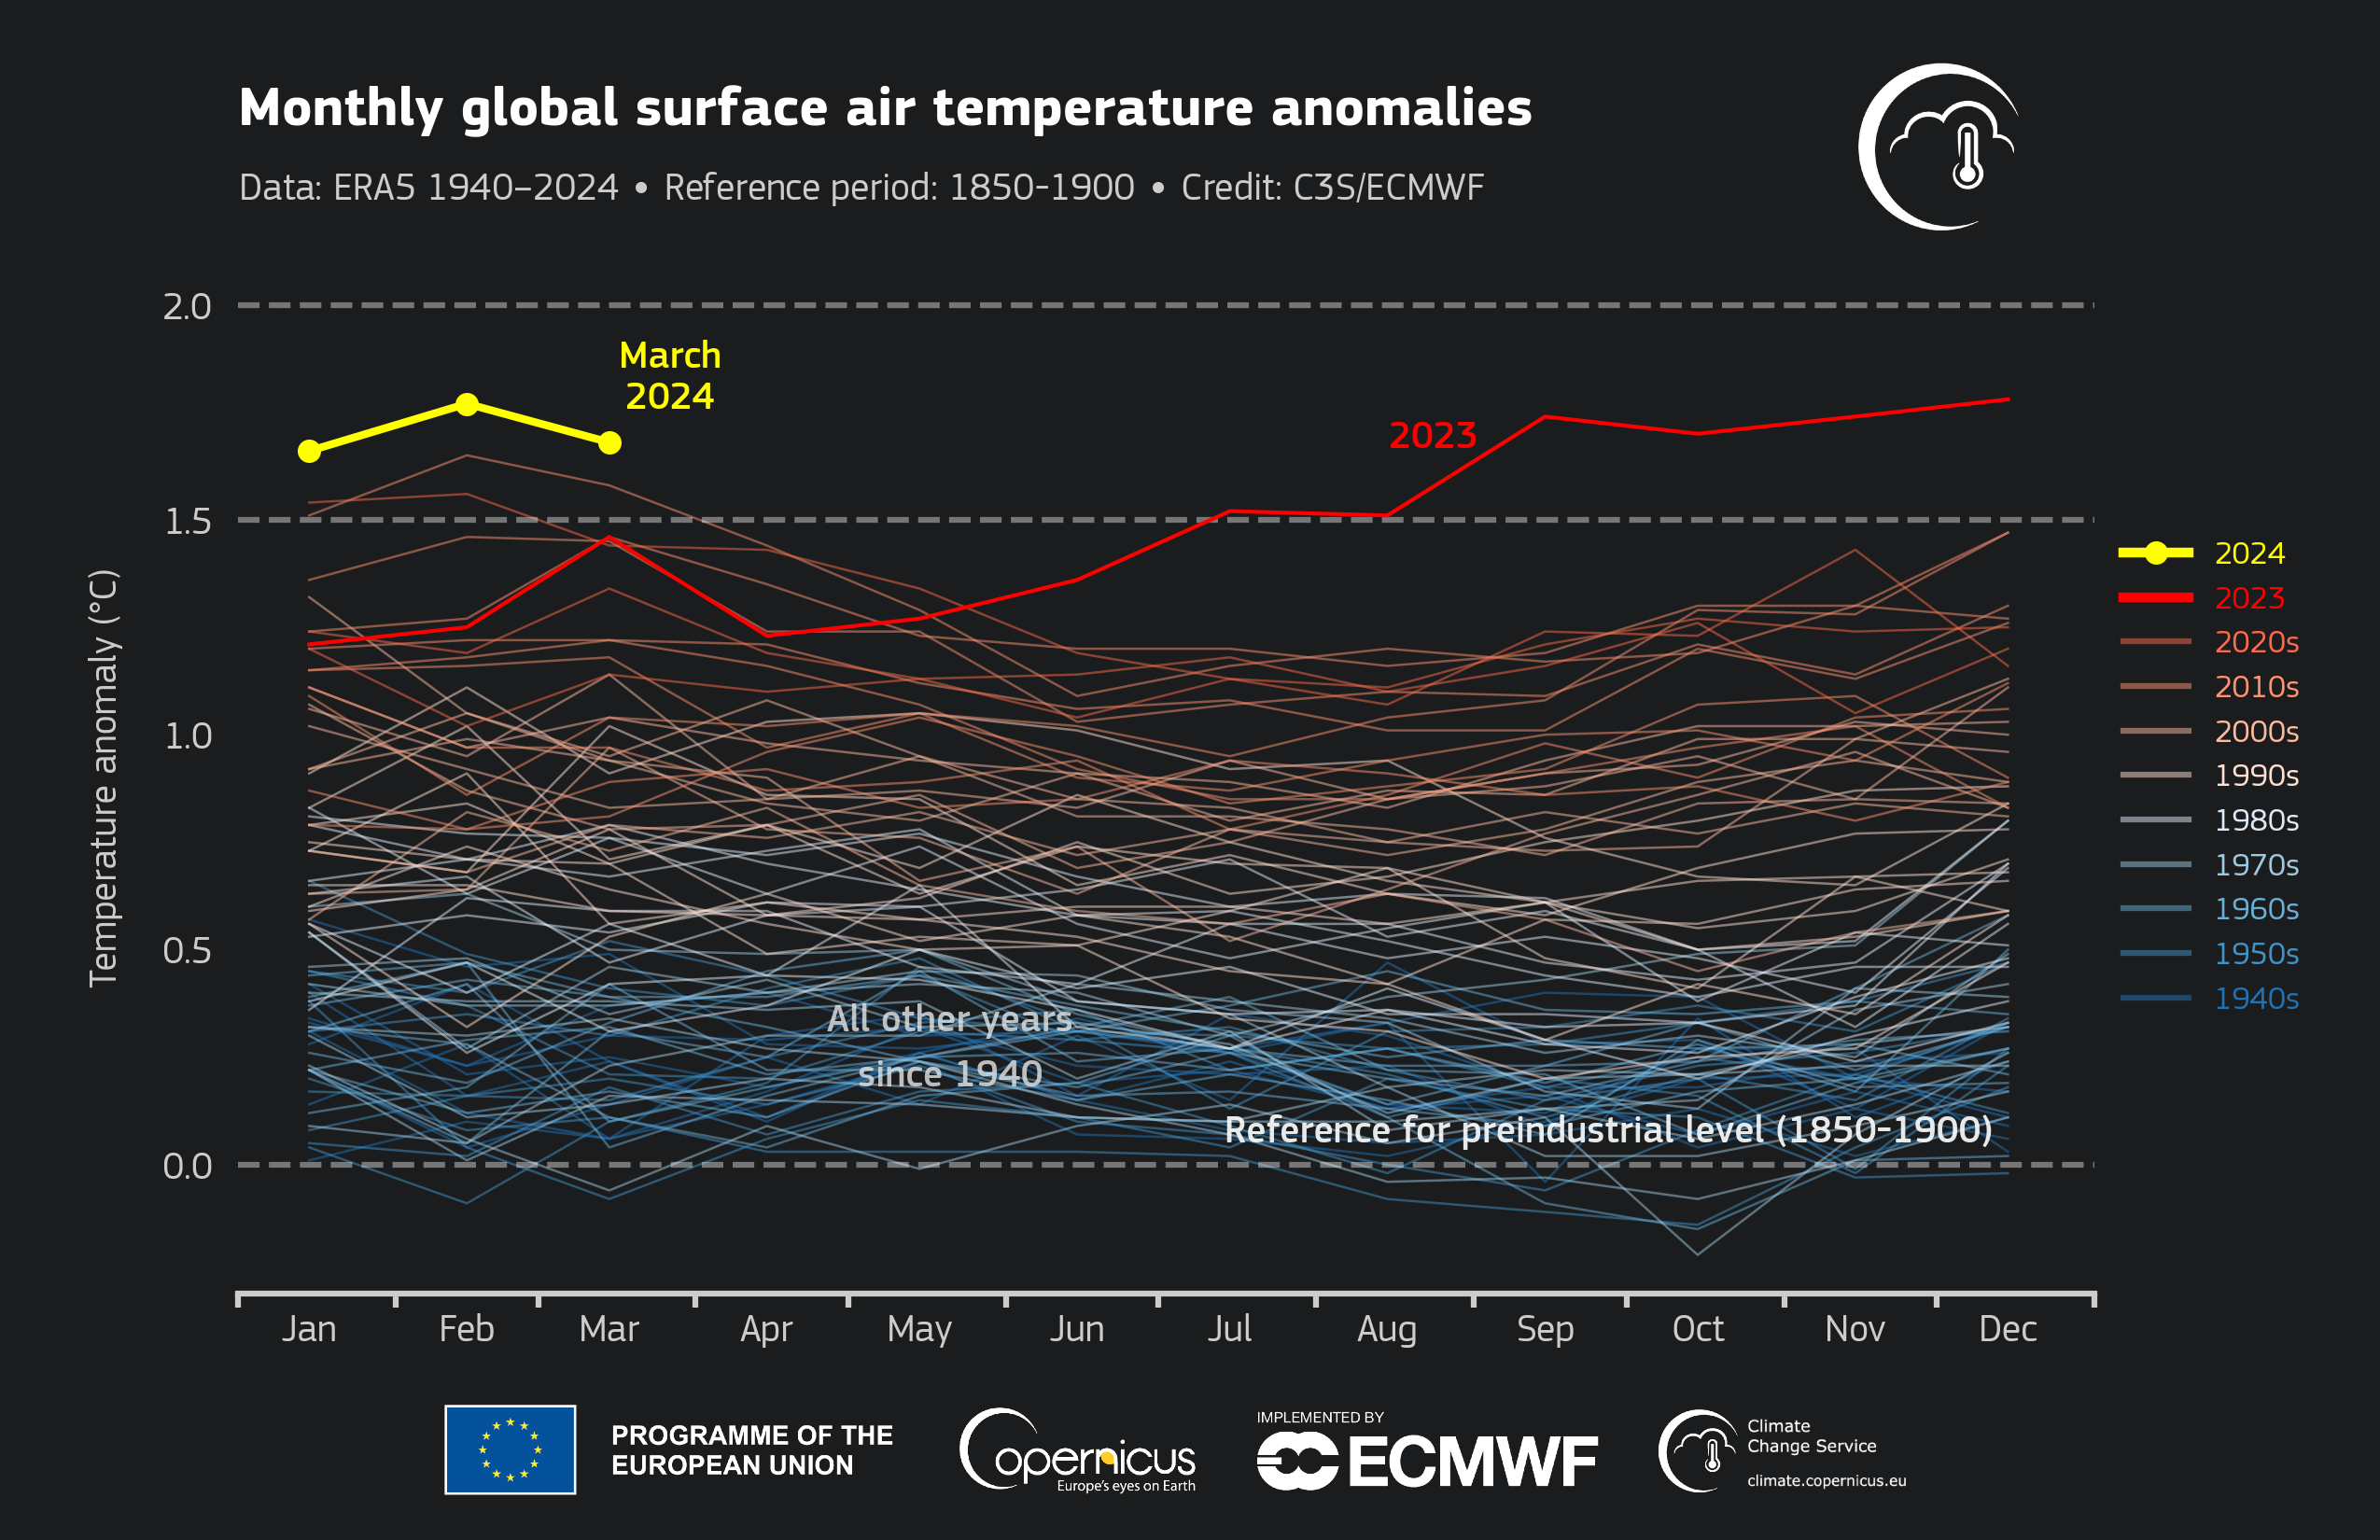
By Jonathan Erdman 12 April 2024 (Weather.com) – March was Earth’s warmest on record, according to data from three separate agencies, the latest month in a stretch of heat records since the planet’s hottest year in 2023. Another month, another record In a report released Friday, NOAA found March’s globally average temperature was 2.43 degrees Fahrenheit above […]
By Nathan Rennolds 6 January 2024 (Business Insider) – A bluefin tuna sold for 114.2 million Japanese yen, or nearly $800,000, at Tokyo’s largest fish market is set to be served at a Michelin-starred restaurant in Japan. The 525-pound fish, caught off of the coast of Aomori Prefecture in northern Japan, fetched the fourth-highest price […]
By Lauren Sommer 28 December 2023 (NPR) – As 2023 draws to a close, it’s going out on top. “It’s looking virtually certain at this point that 2023 will be the hottest year on record,” says Zeke Hausfather, climate scientist at Berkeley Earth, a non-profit that analyzes climate trends. Though temperature records from December have […]
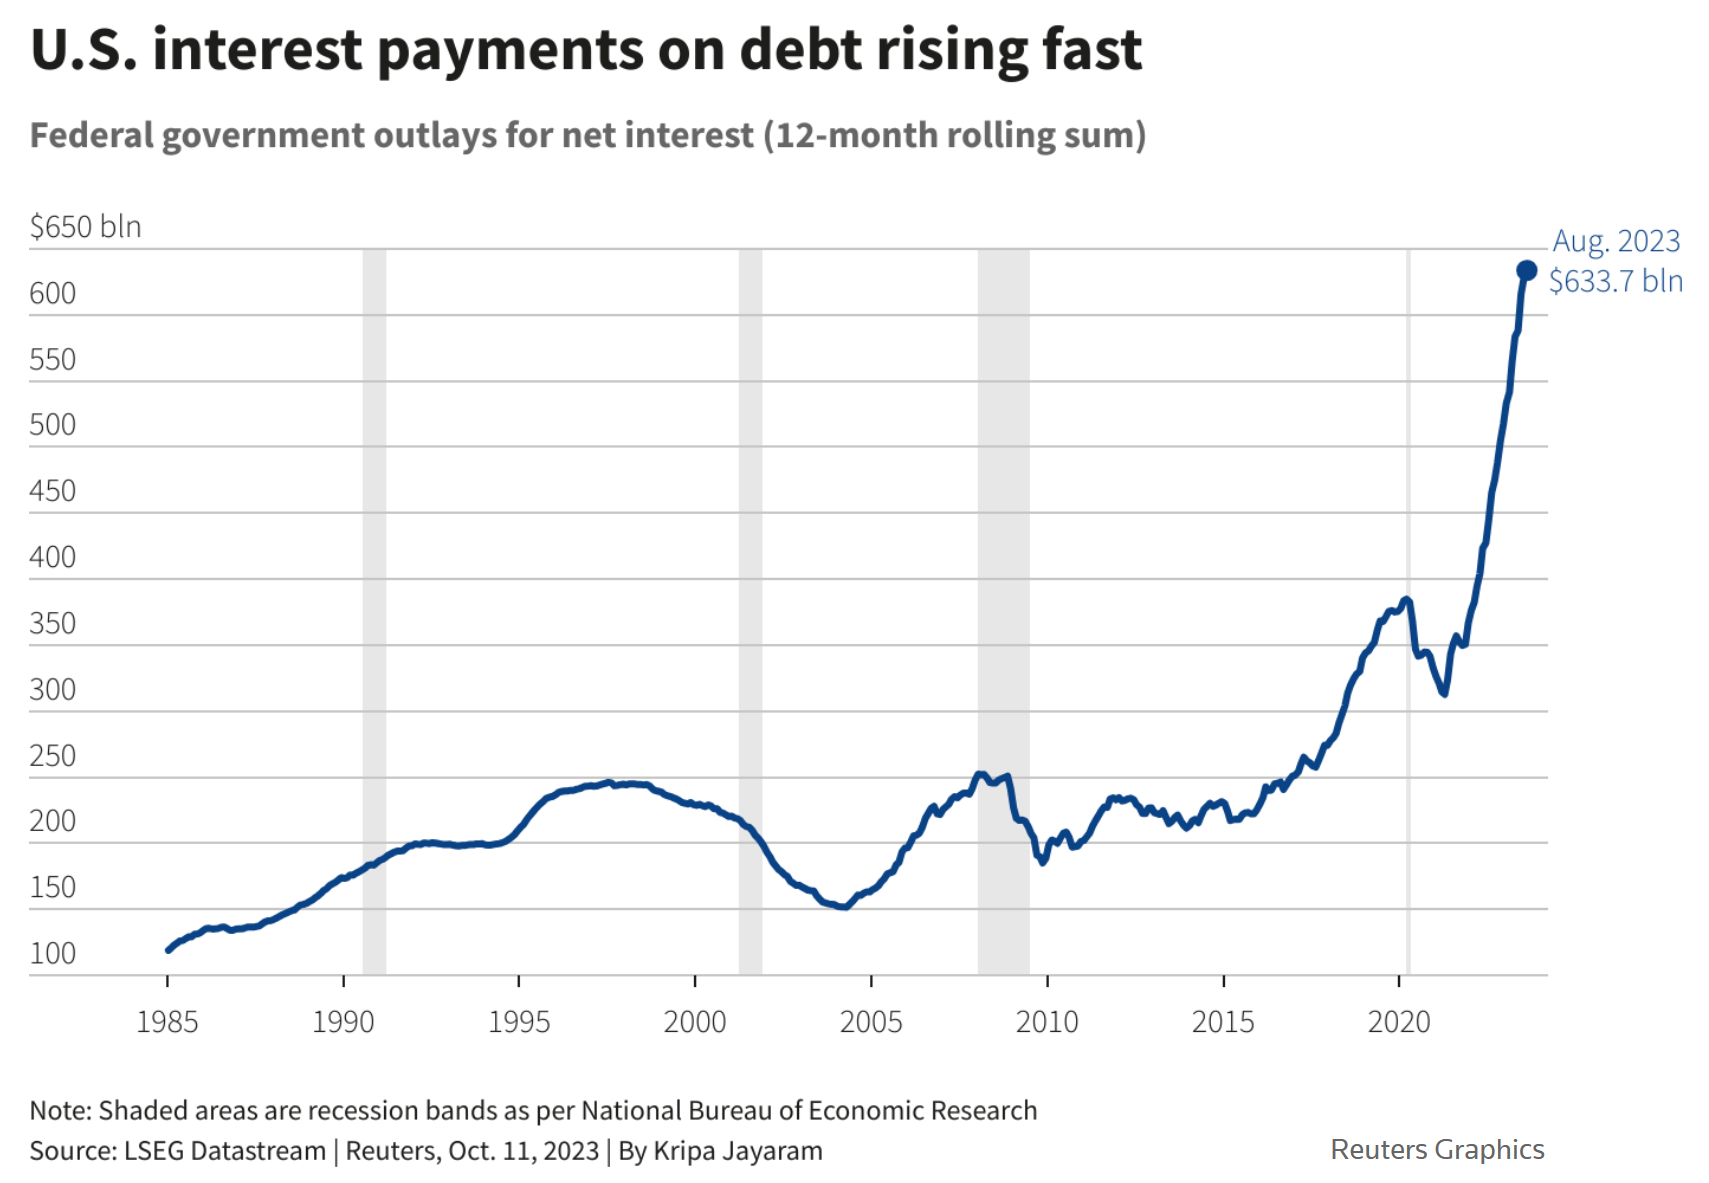
By Yoruk Bahceli, Dhara Ranasinghe, and Maria Martinez 16 October 2023 LONDON (Reuters) – Record debts, high interest rates, the costs of climate change, health, and pension spending as populations age and fractious politics are stoking fears of a financial market crisis in big, developed economies. A surge in government borrowing costs has put high debt in […]
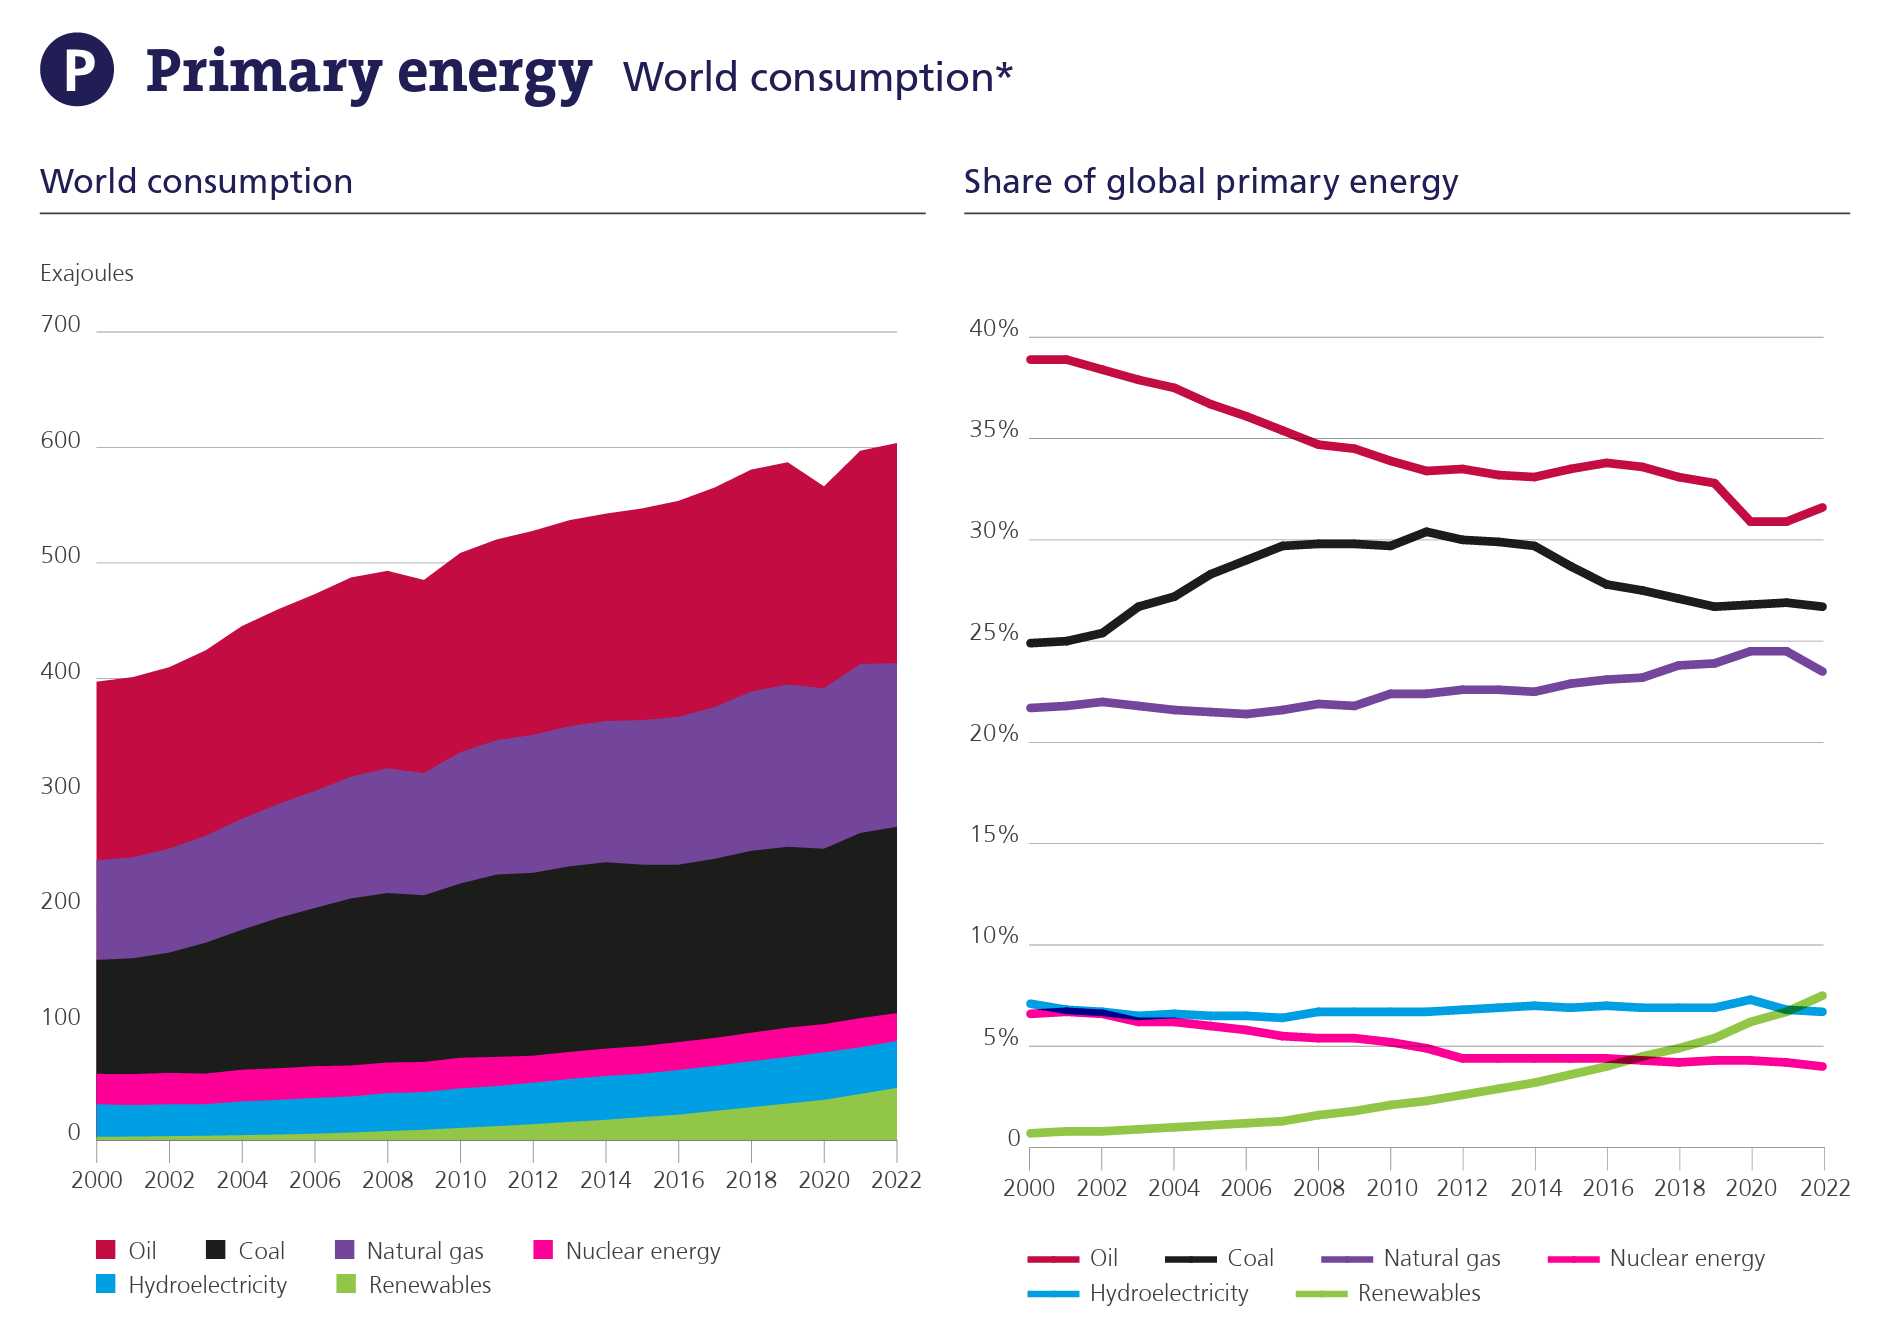
26 June 2023 (EI) – The Energy Institute (EI) and partners KPMG and Kearney today released the 72nd annual edition of the Statistical Review of World Energy, presenting for the first time full global energy data for 2022. Five key themes emerge from the data EI President Juliet Davenport OBE HonFEI said: “The EI Statistical Review […]
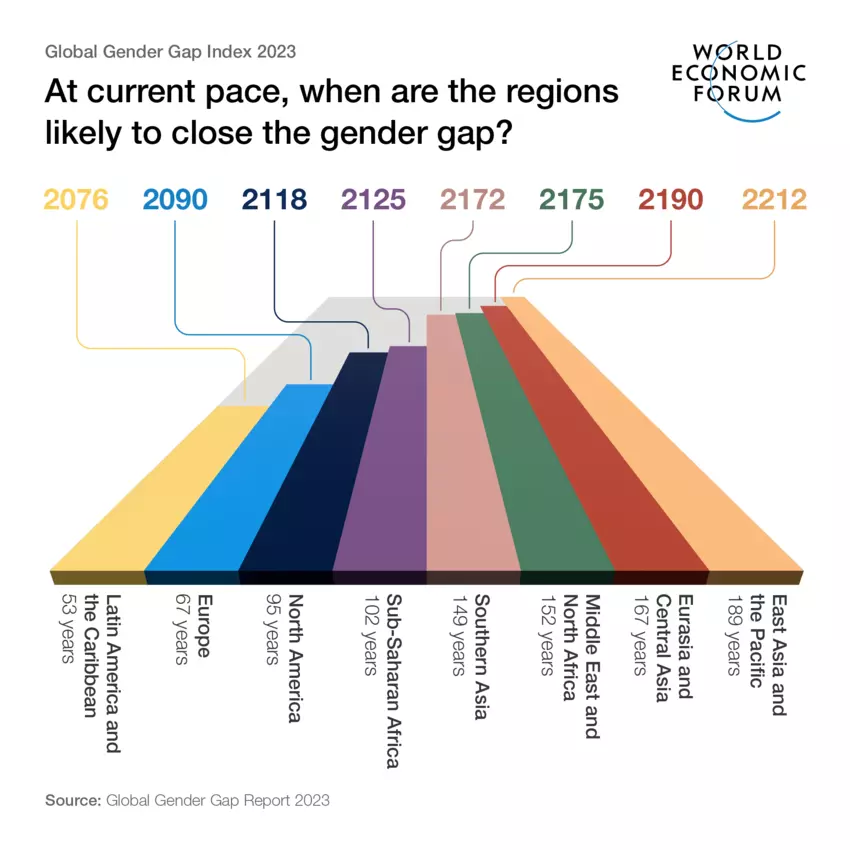
By Alicia Wallace 20 June 2023 Minneapolis (CNN) – Progress on achieving global gender equality is languishing. A new report from the World Economic Forum estimates that women won’t attain parity with men for another 131 years. In other words, not until 2154. The overall gender gap — a measurement of equality across the realms of the economy, politics, […]
By Olivia Trani 1 June 2023 (VCU) – When it comes to public health, the United States is at a disadvantage compared with other developed countries. Americans experience more illness, have less access to health care and pay more for health services than citizens in other high-income countries. Americans also die earlier – and have been doing so […]