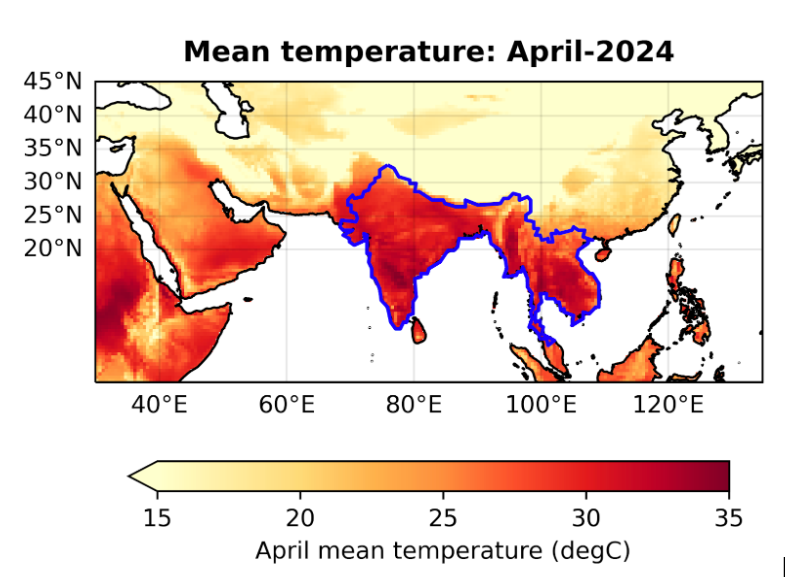
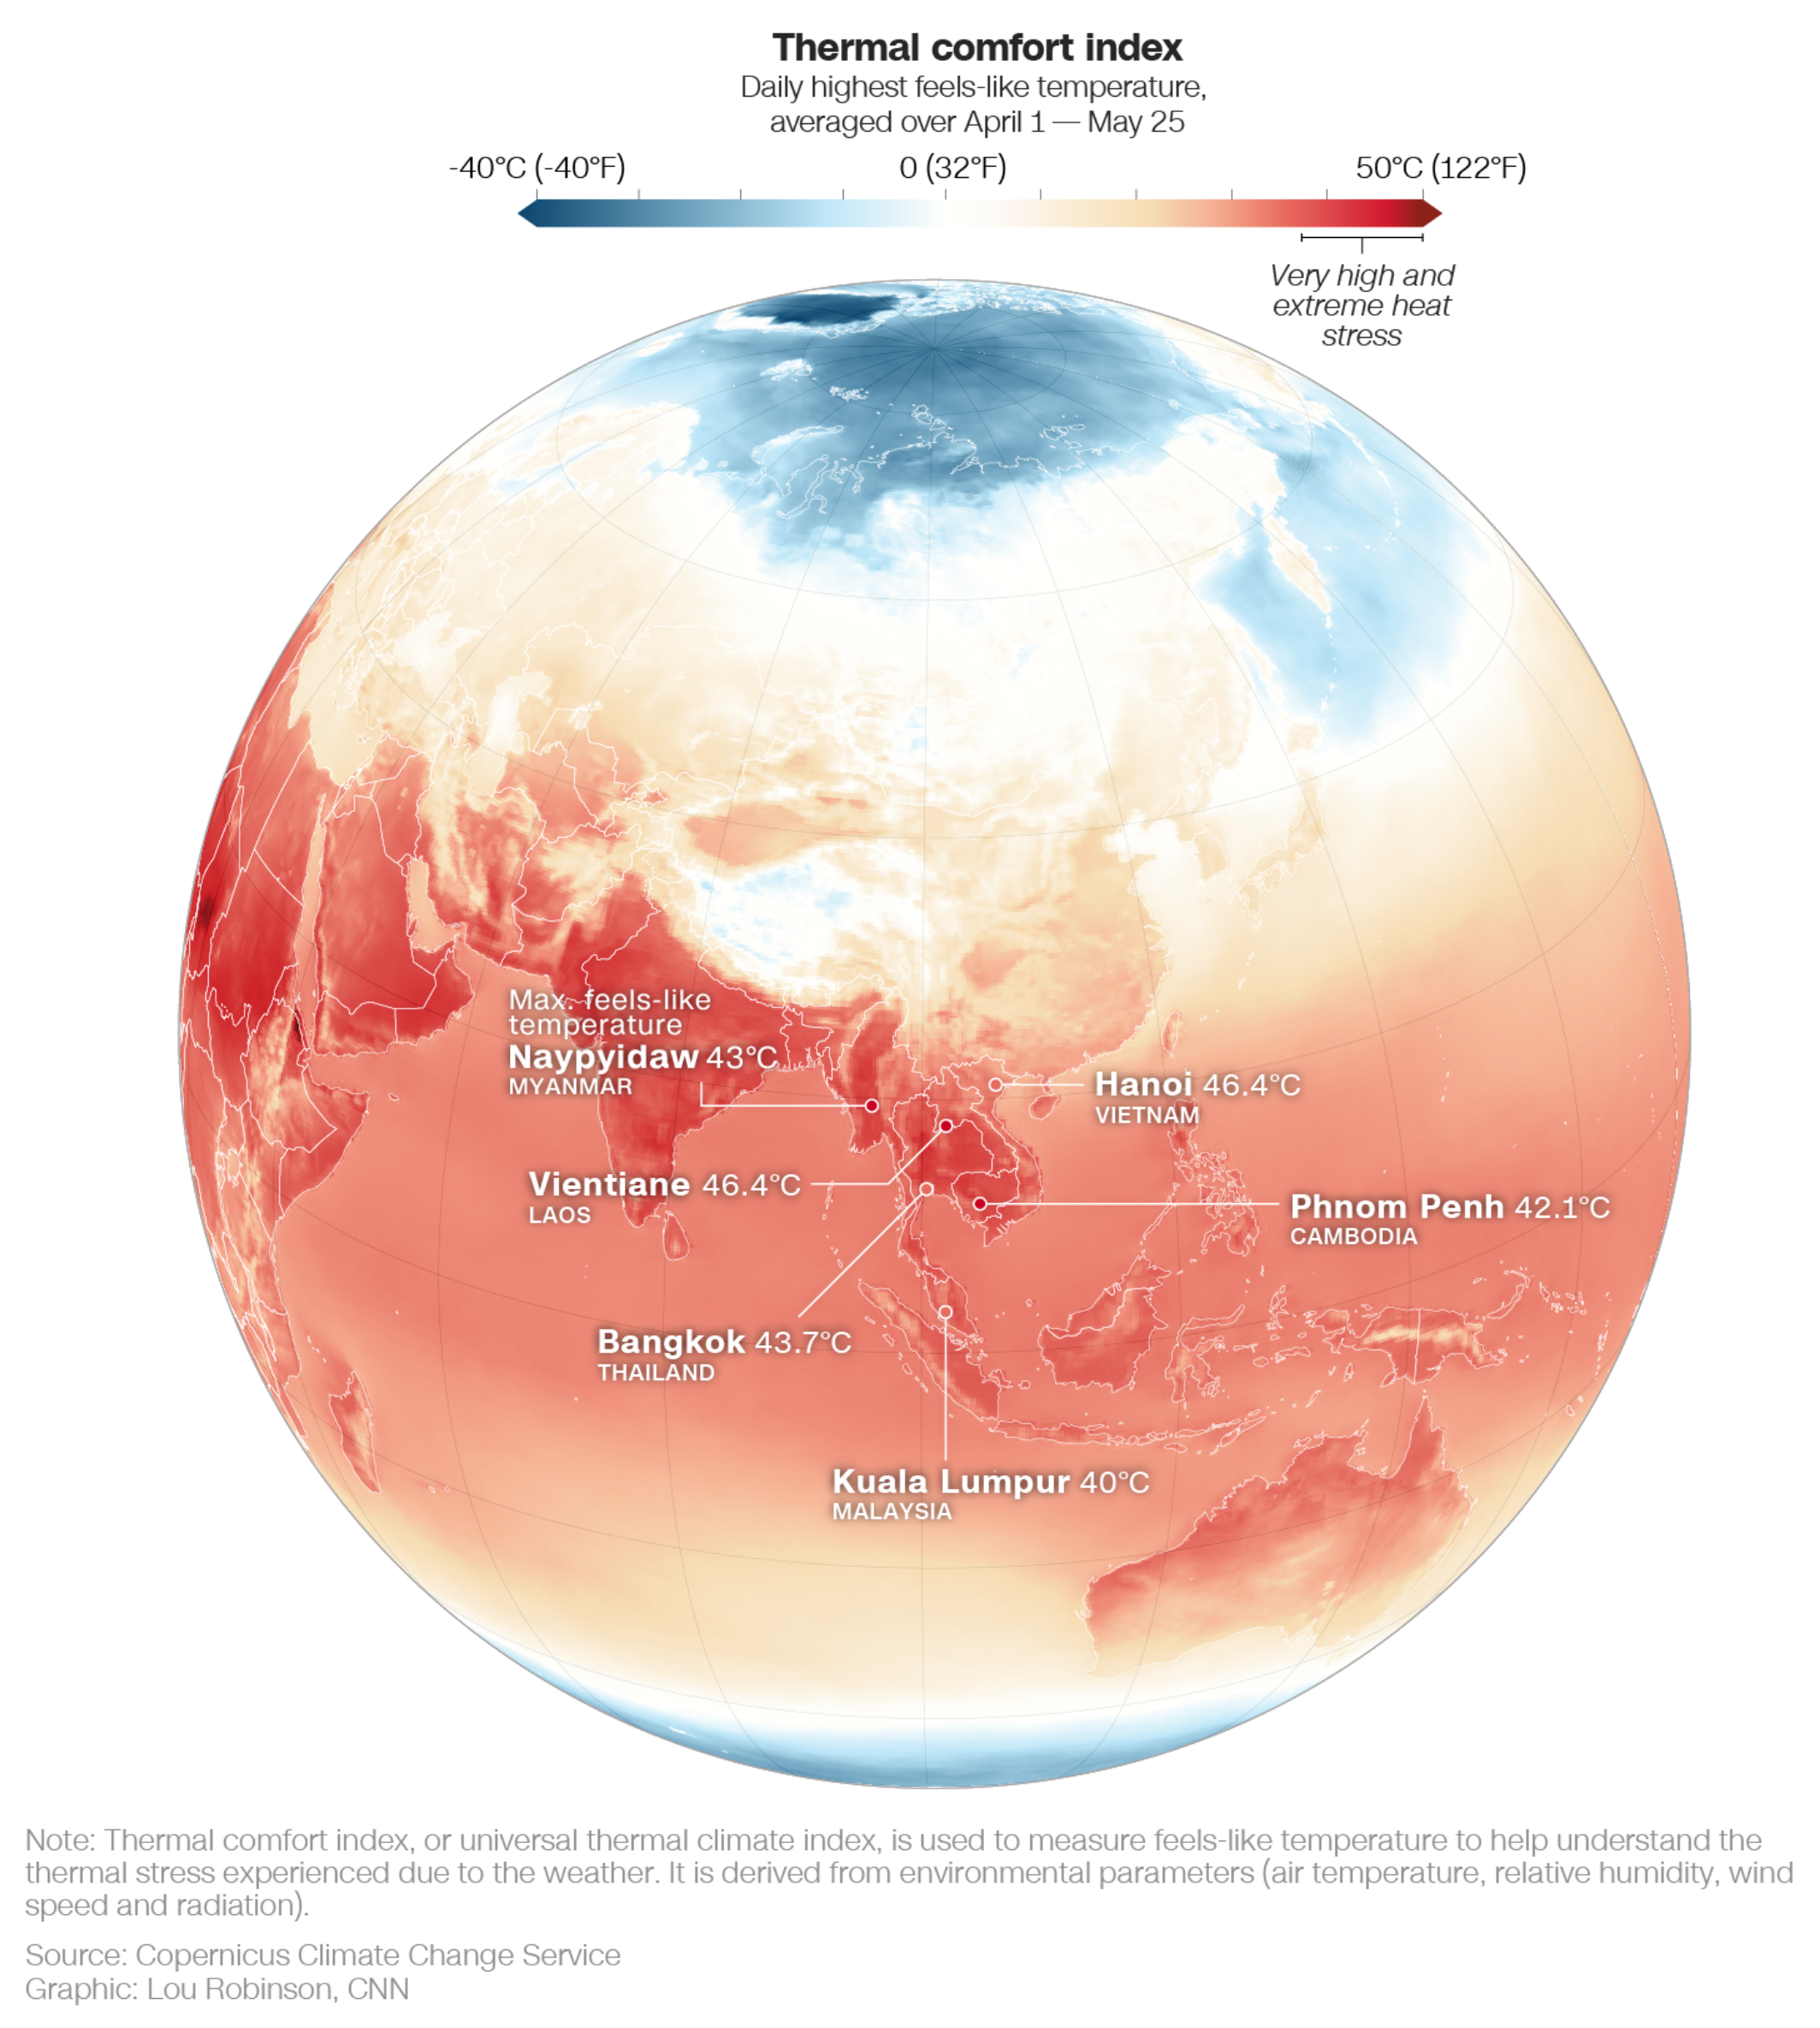
By Sibi Arasu 14 May 2024 BENGALURU, India (AP) – Sizzling heat across Asia and the Middle East in late April that echoed last year’s destructive swelter was made 45 times more likely in some parts of the continent because of human-caused climate change, a study Tuesday found. Scorching temperatures were felt across large swaths of Asia, […]
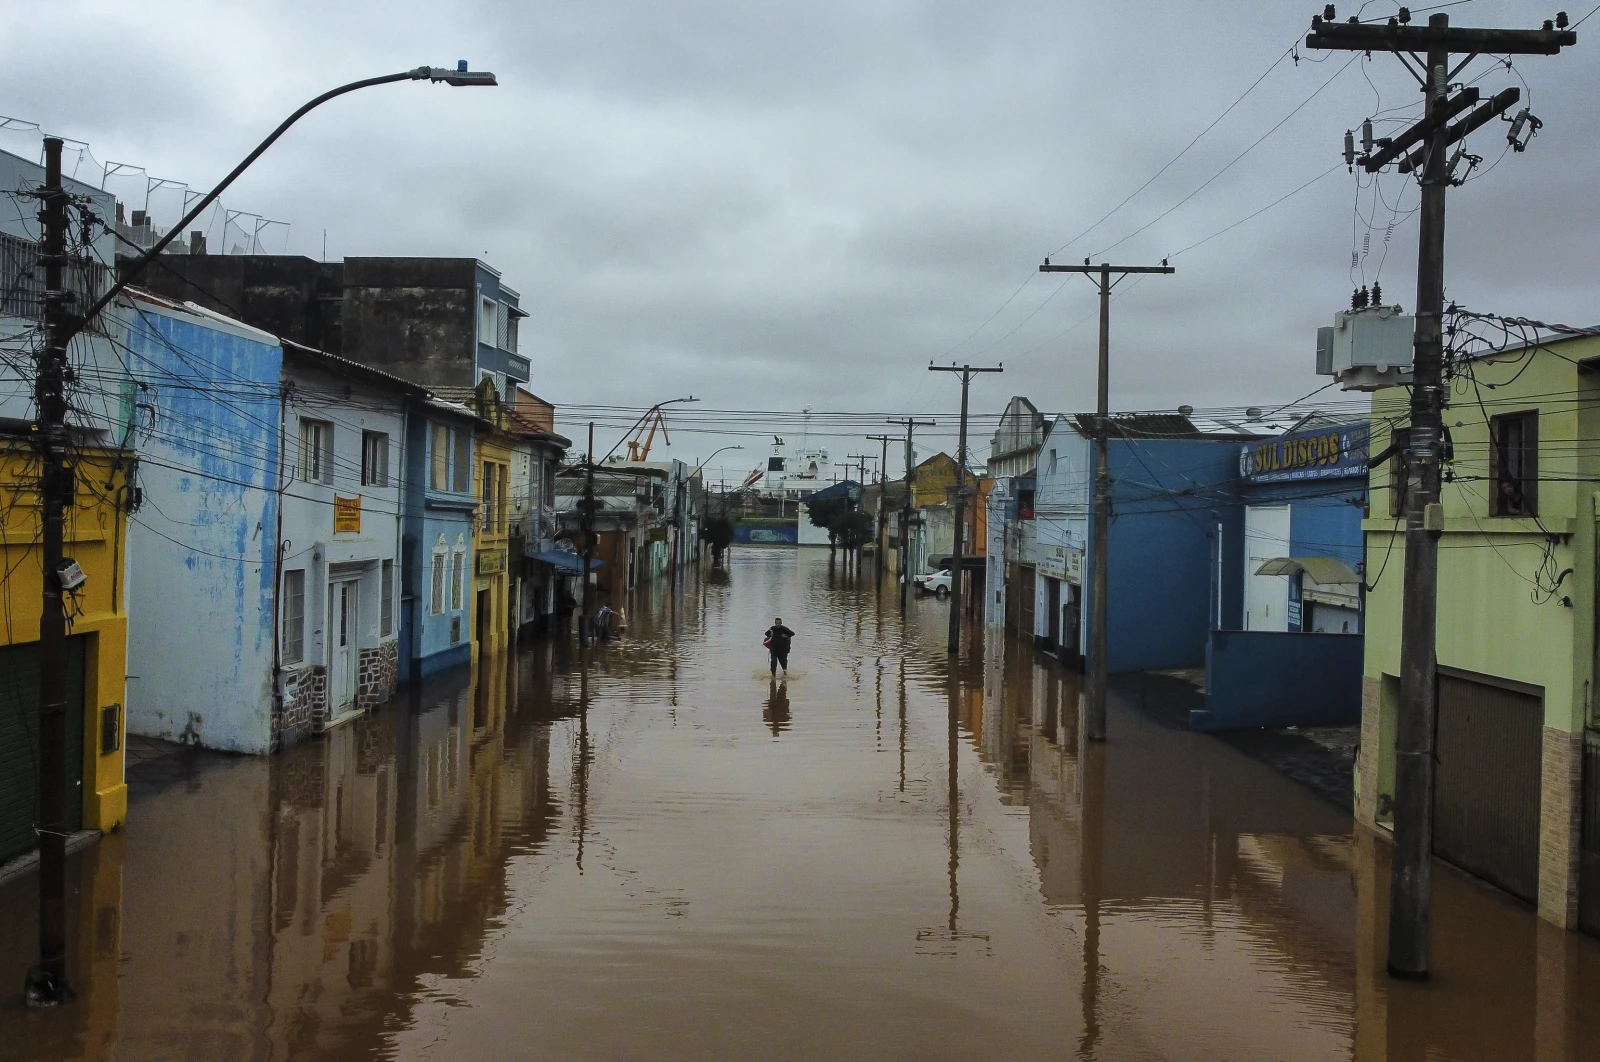
By Seth Borenstein, Suman Naishadham, Sibi Arasu, and Fabiano Maisonnave 7 May 2024 (AP News) – In sweltering Brazil, flooding killed dozens of people and paralyzed a city of about 4 million people. Voters and politicians in India, amid national elections, are fainting in heat that hit as high as 115 degrees (46.3 degrees Celsius). […]
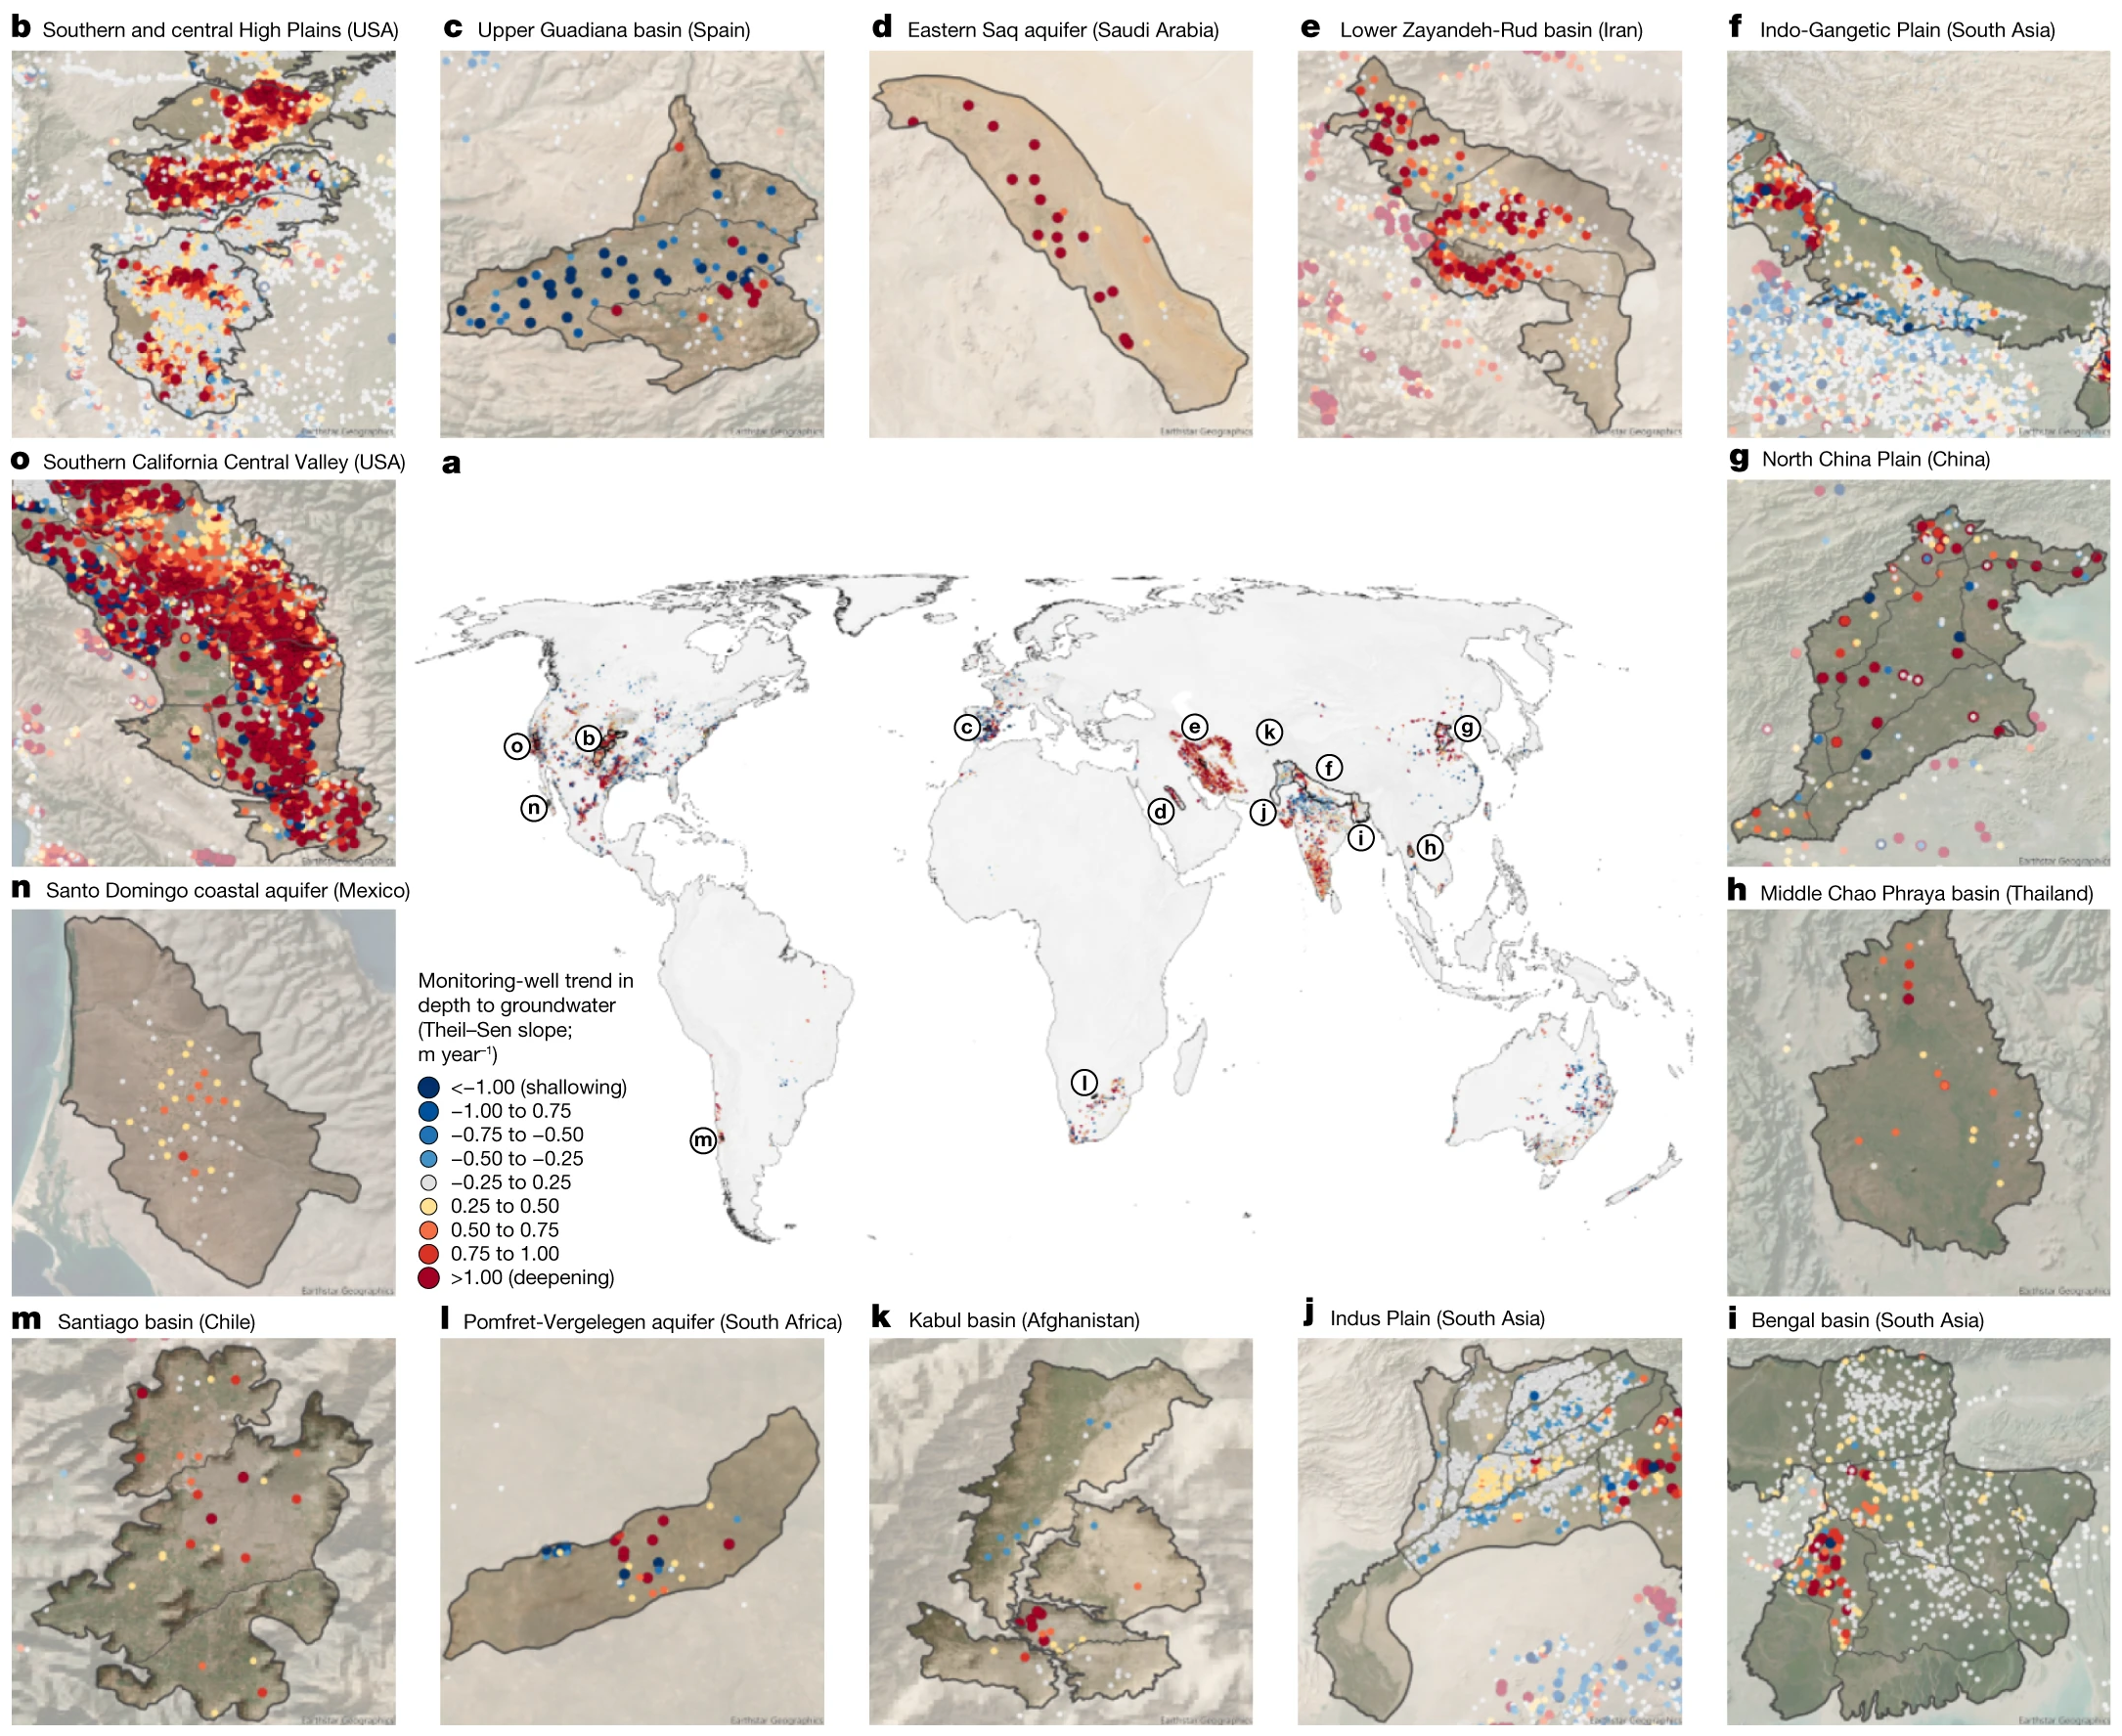
By Matthew Rozsa 24 January 2024 (Salon) – Humans rely on groundwater for many things, but especially our food. Roughly 30 percent of all the planet’s available freshwater comes from groundwater, or water that is found underground in the spaces between rocks, soil and sand. It is primarily used for agriculture and billions of humans are dependent […]
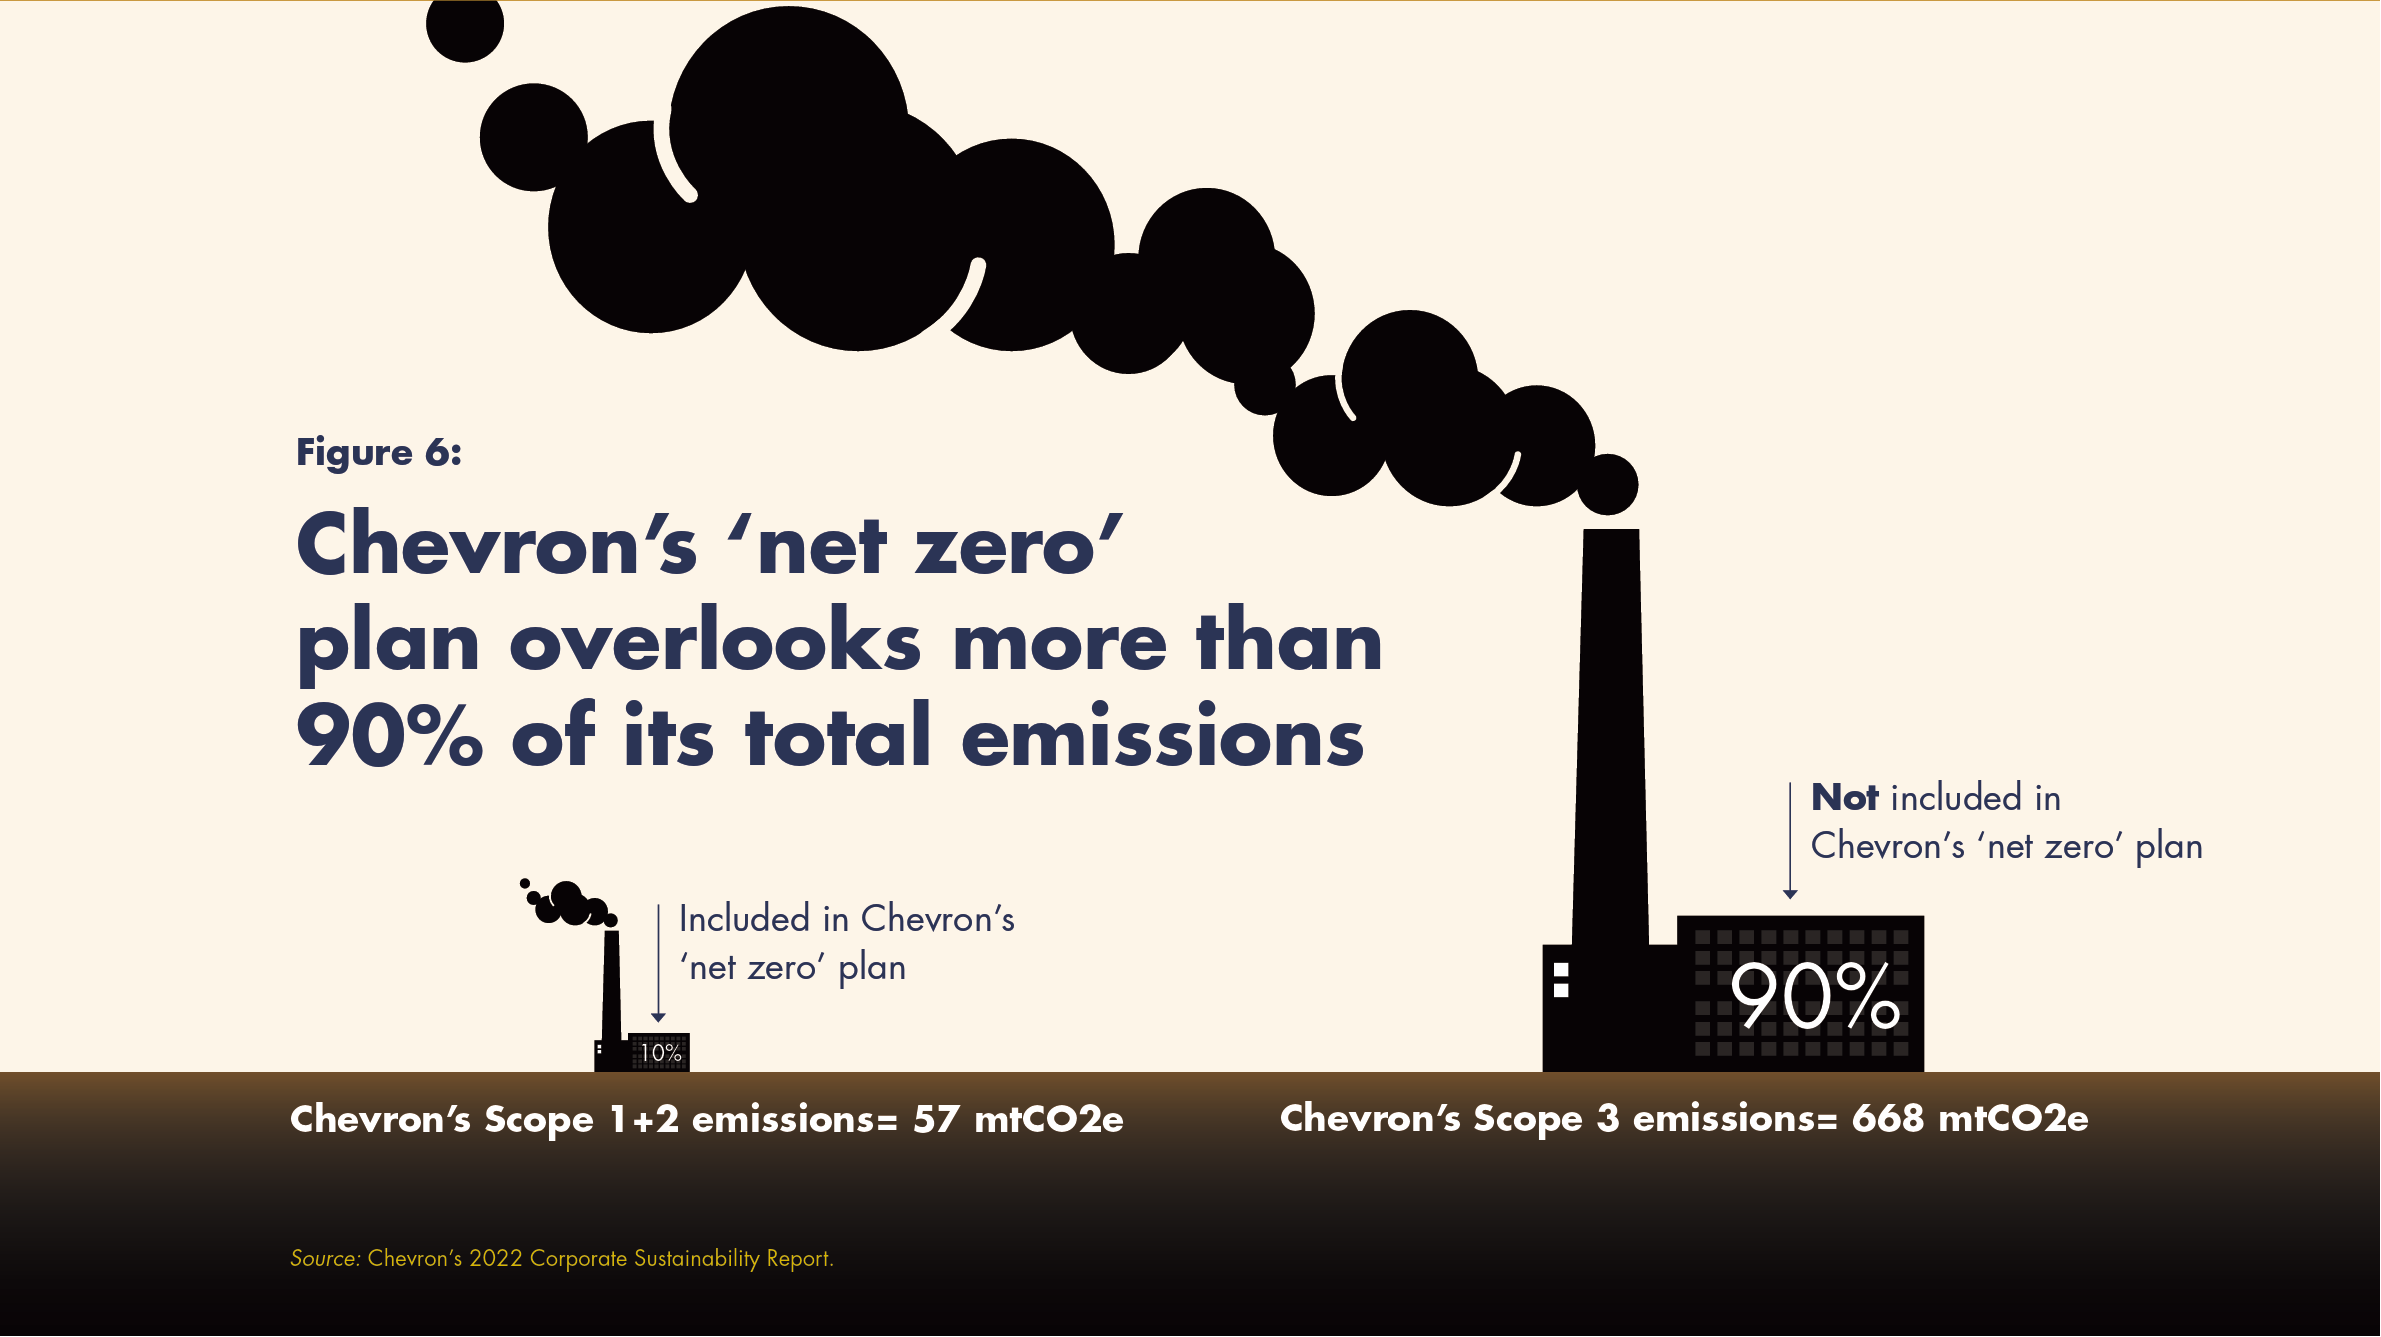
By Nina Lakhani 24 May 2023 NEW YORK (The Guardian) – A new investigation into Chevron’s climate pledge has found the fossil-fuel company relies on “junk” carbon offsets and “unviable” technologies, which do little to offset its vast greenhouse gas emissions and, in some cases, may actually be causing communities harm. Chevron, which reported $35.5bn […]
By Carlotta Dotto, Krystina Shveda, and Lou Robinson 7 June 2023 HONG KONG (CNN) – Every day, countless mopeds crisscross the congested city of Hanoi, in Vietnam, with commuters traveling to work or motorbike taxis dropping off everything from parcels to cooked food and clients. One of them is Phong, 42, who starts his shift […]
By Olivia Trani 1 June 2023 (VCU) – When it comes to public health, the United States is at a disadvantage compared with other developed countries. Americans experience more illness, have less access to health care and pay more for health services than citizens in other high-income countries. Americans also die earlier – and have been doing so […]
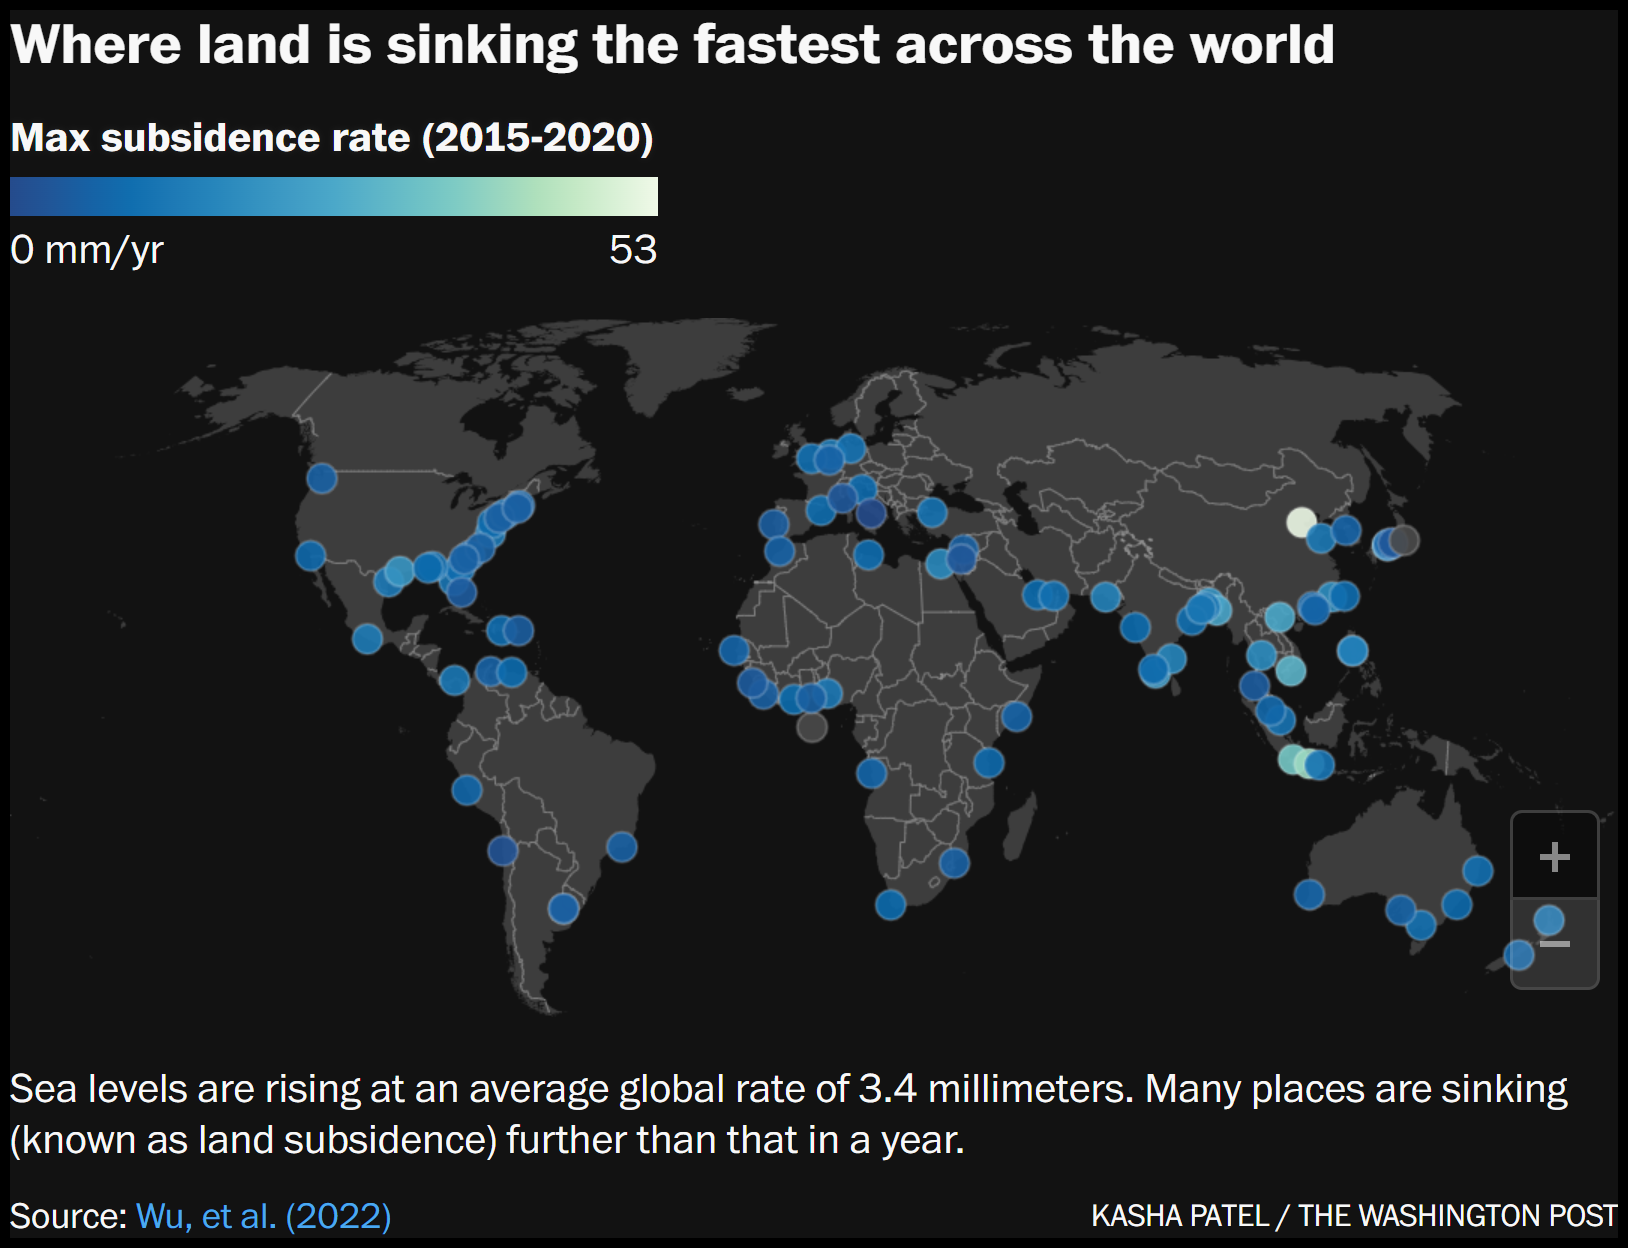
By Kasha Patel 30 May 2023 (The Washington Post) – Imagine Earth’s surface is like a stack of pancakes. The pancakes, or layers of soil and rocks, may appear fairly evenly stacked and fluffy. Over time though, the stack can become compressed, thinner and shorter. Scientists observe this downward motion of land, called land subsidence, […]
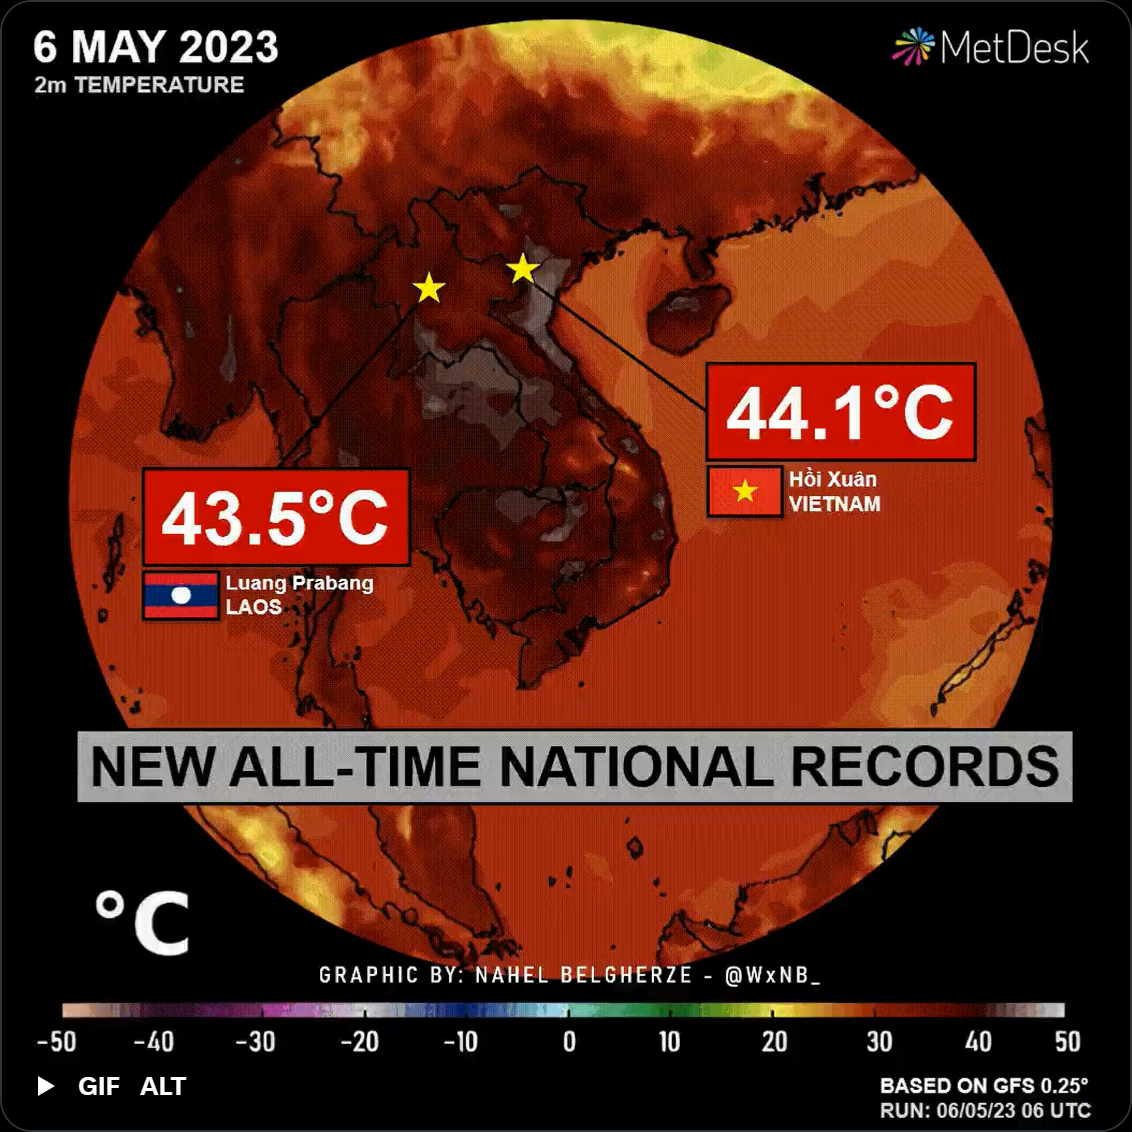
By Matthew Cappucci 8 May 2023 (The Washington Post) – A historic heat wave is bringing largely unprecedented temperatures to Southeast Asia, delivering a dangerous heat stress that could pose grave threats to vulnerable populations and smashing all-time records. Both Vietnam and Laos have recorded their hottest temperatures ever observed, in some places topping 110 […]
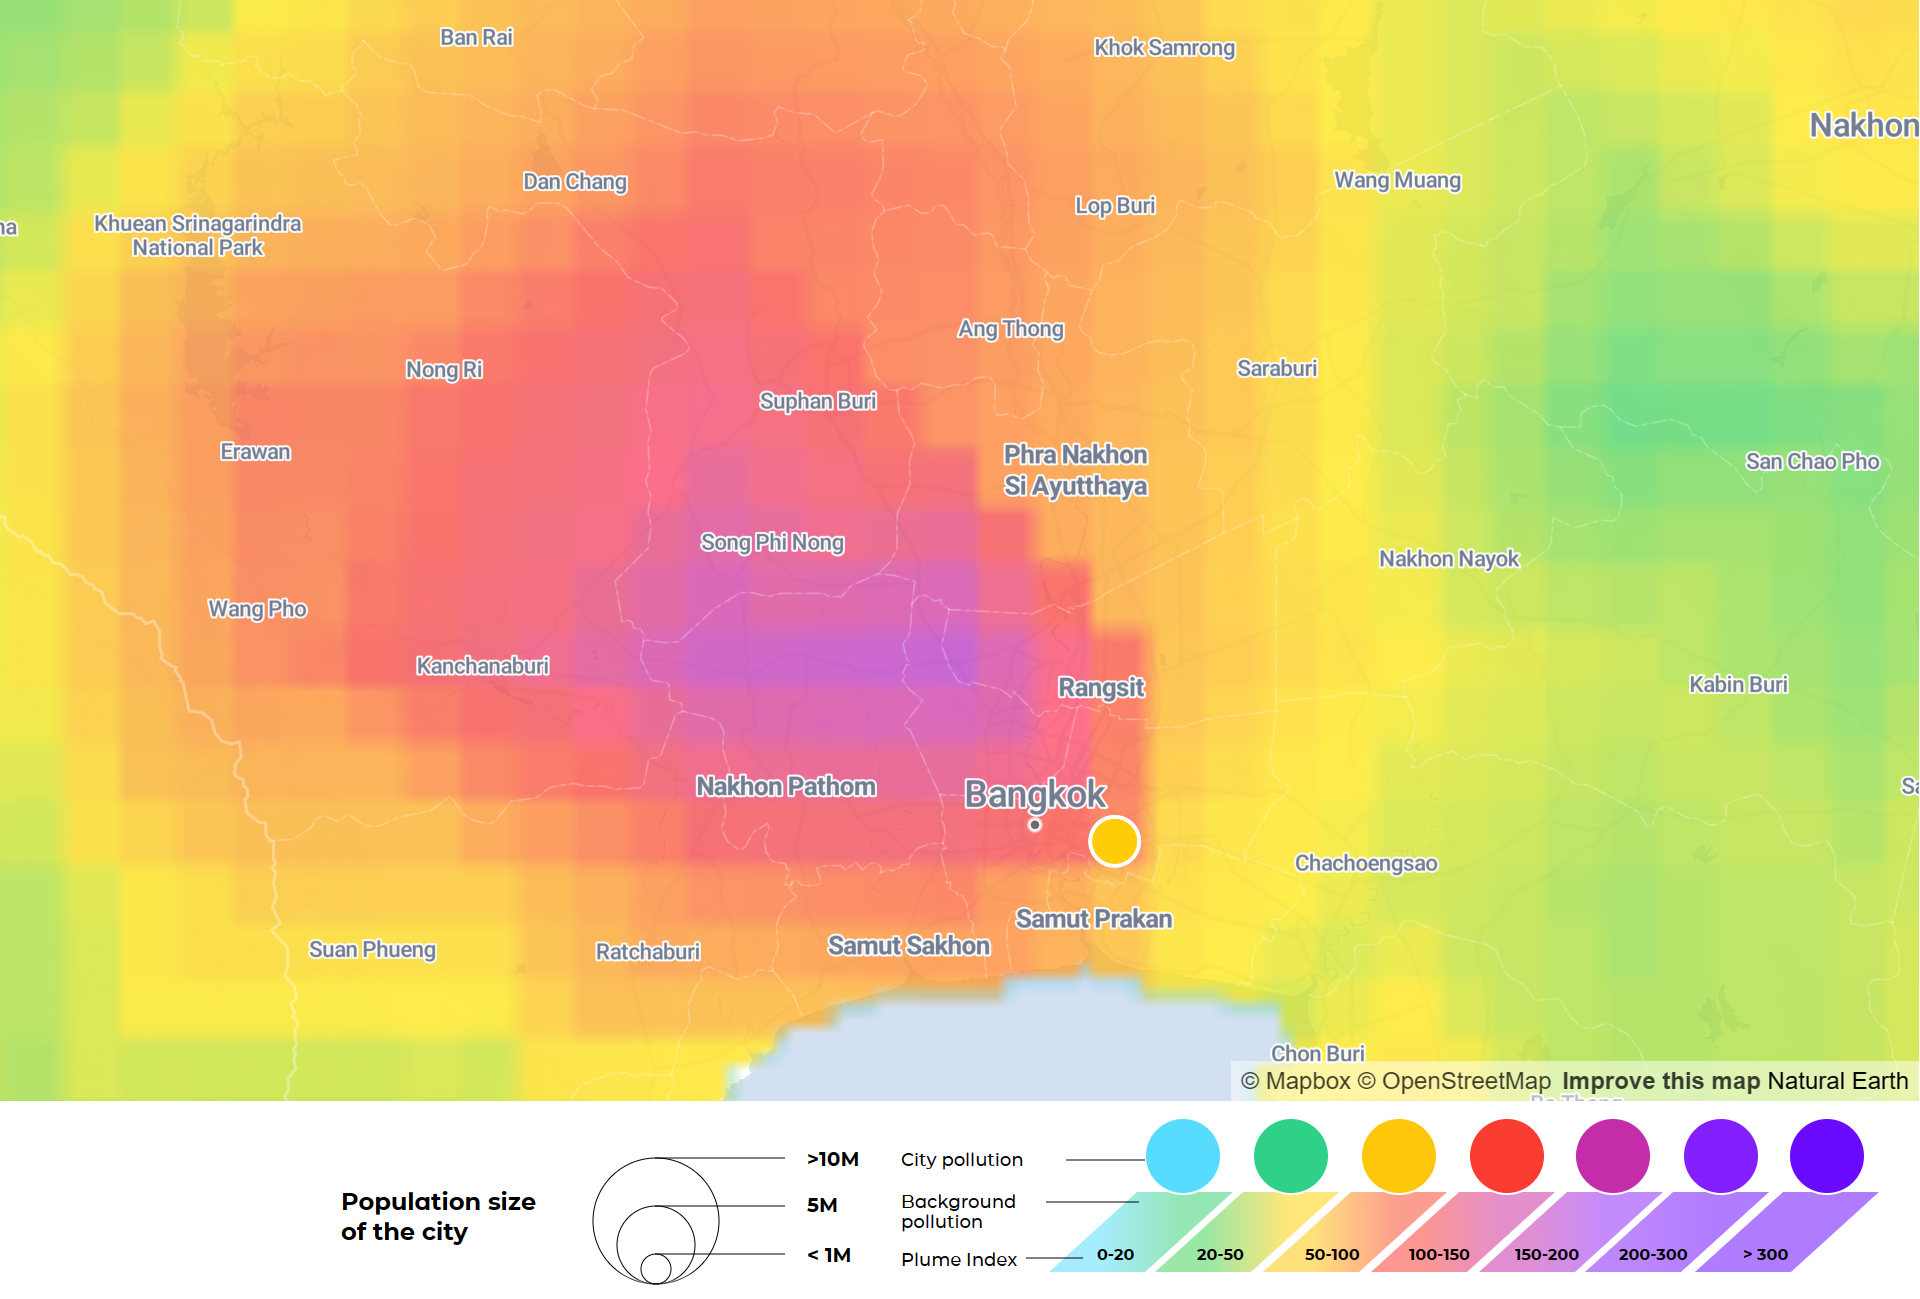
Bangkok, 20 April 2023 (AFP) – About 2.4 million people in Thailand have sought hospital treatment for medical problems linked to air pollution since the start of the year, health officials said, as toxic smog chokes parts of the country. Bangkok and the northern city of Chiang Mai were among the most polluted cities in […]
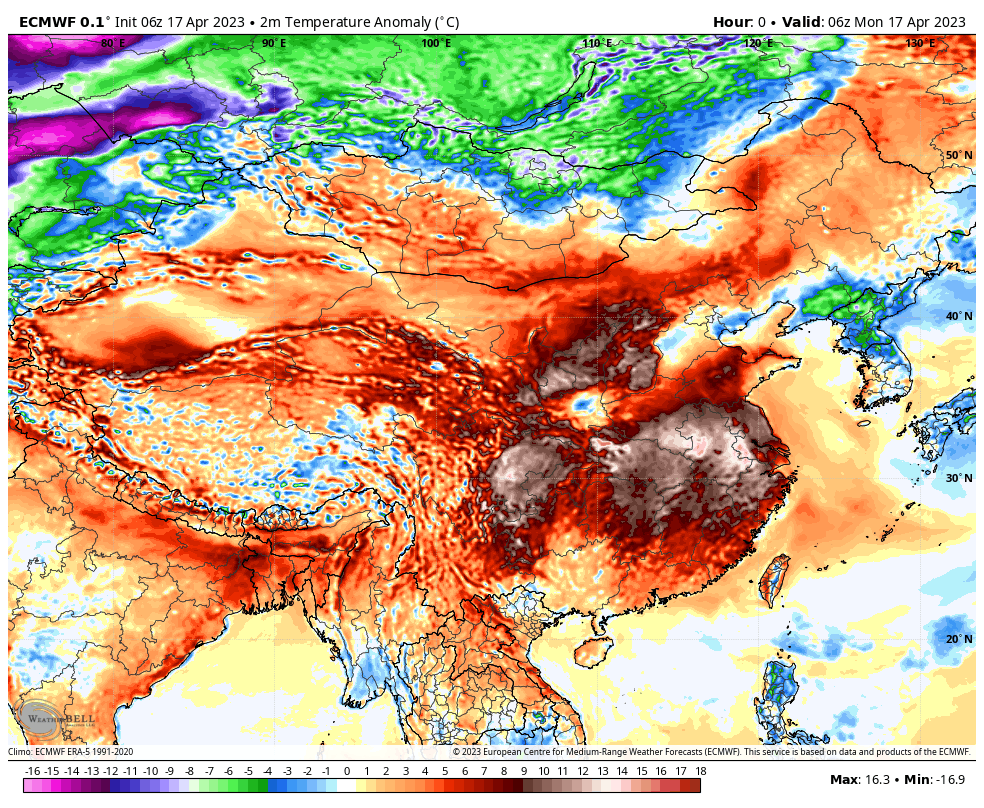
By Dan Stillman 17 April 2023 (The Washington Post) – Numerous heat records have been broken across Southeast Asia, China and other parts of the continent in recent days as the region remains in the grip of a dangerously scorching heat wave, with Thailand in particular experiencing unusually extreme conditions. Weather historian Maximiliano Herrera is describing […]