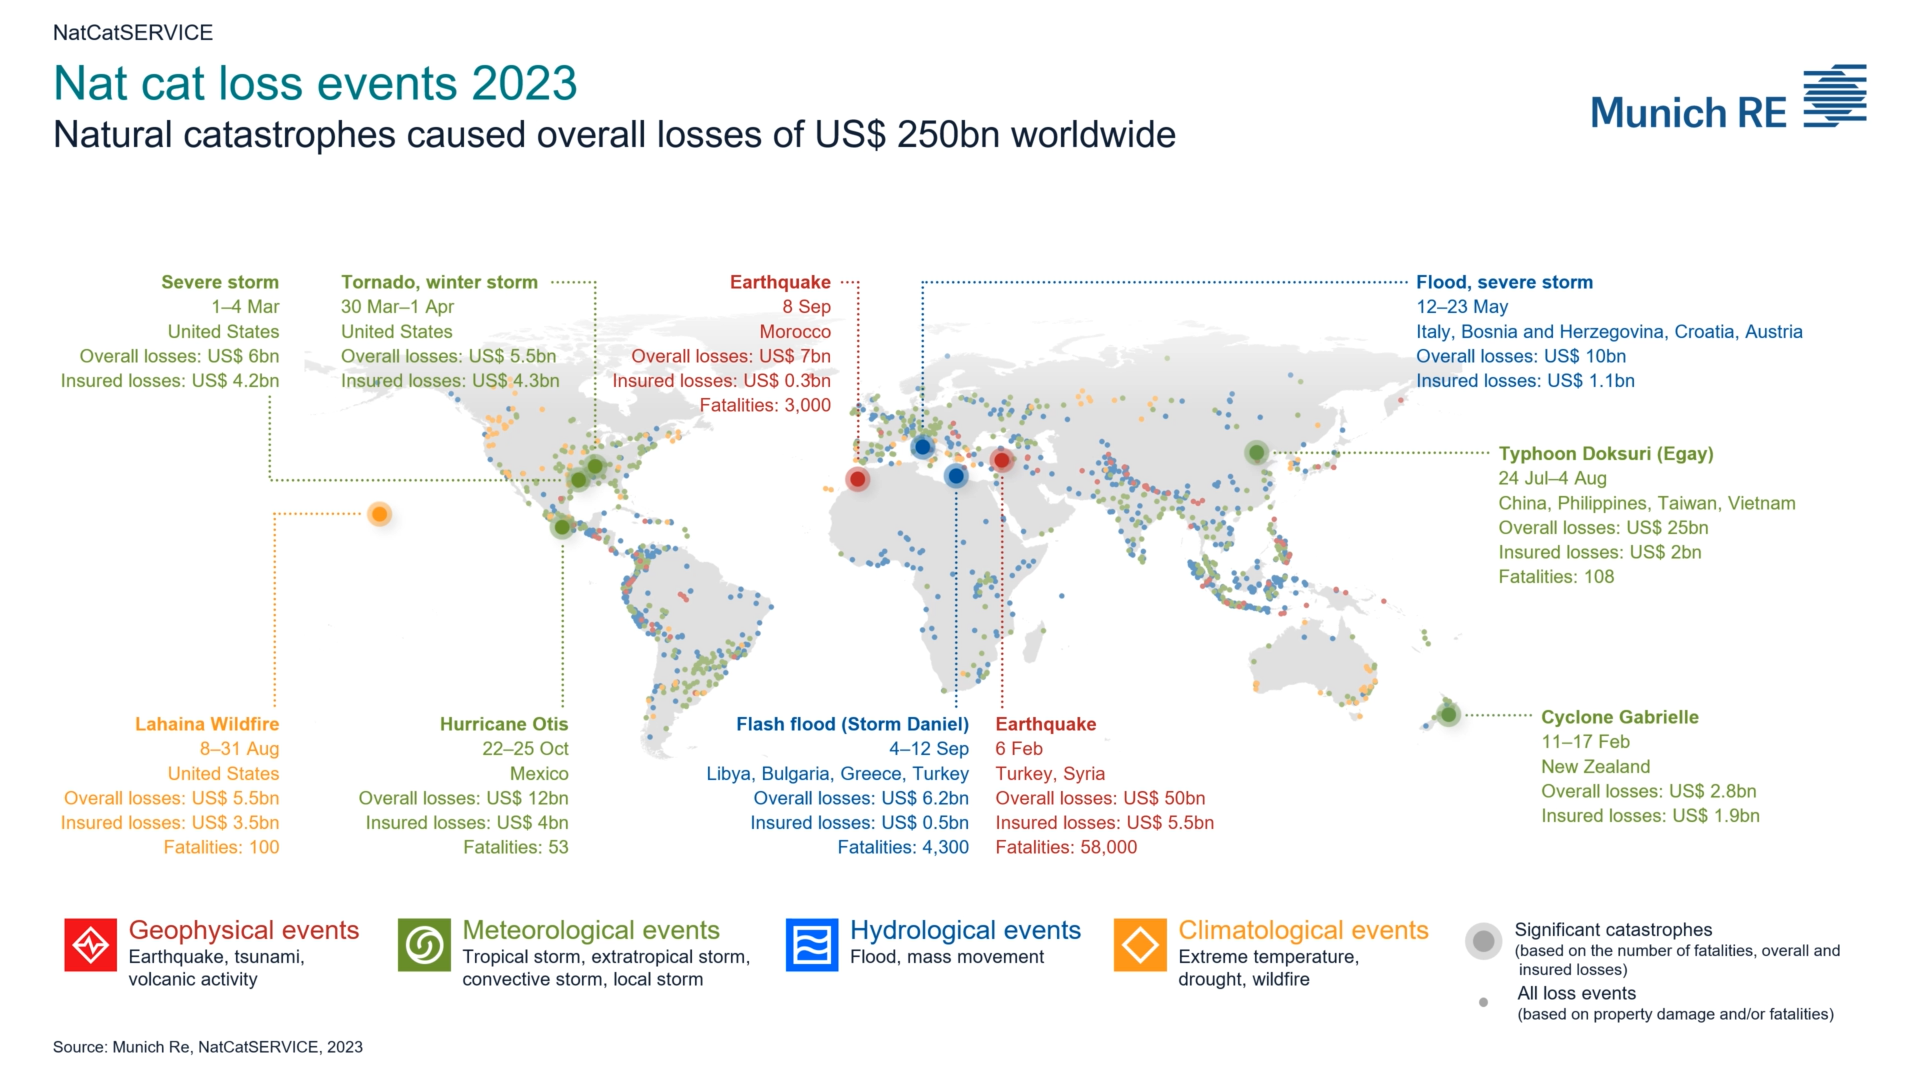
(a) Linear trends in sea surface temperature (SST) (°C per decade) over the period 1982–2022. (b) Area-averaged time series of SST anomalies (°C) relative to the 1982–2022 reference period for the areas indicated in grey dashed lines in 5(a). Source: Derived from the Copernicus Marine Service remote sensing products available at https://doi.org/10.48670/moi-00168 (for 1982–2021) and https://doi.org/10.48670/moi-00165 (for 2022). Graphic: WMO

Pacific island sea levels rising faster than global average, WMO says – Economic damage in Southwest Pacific due to flooding in 2022 was $8.5 billion, almost triple compared to the previous year

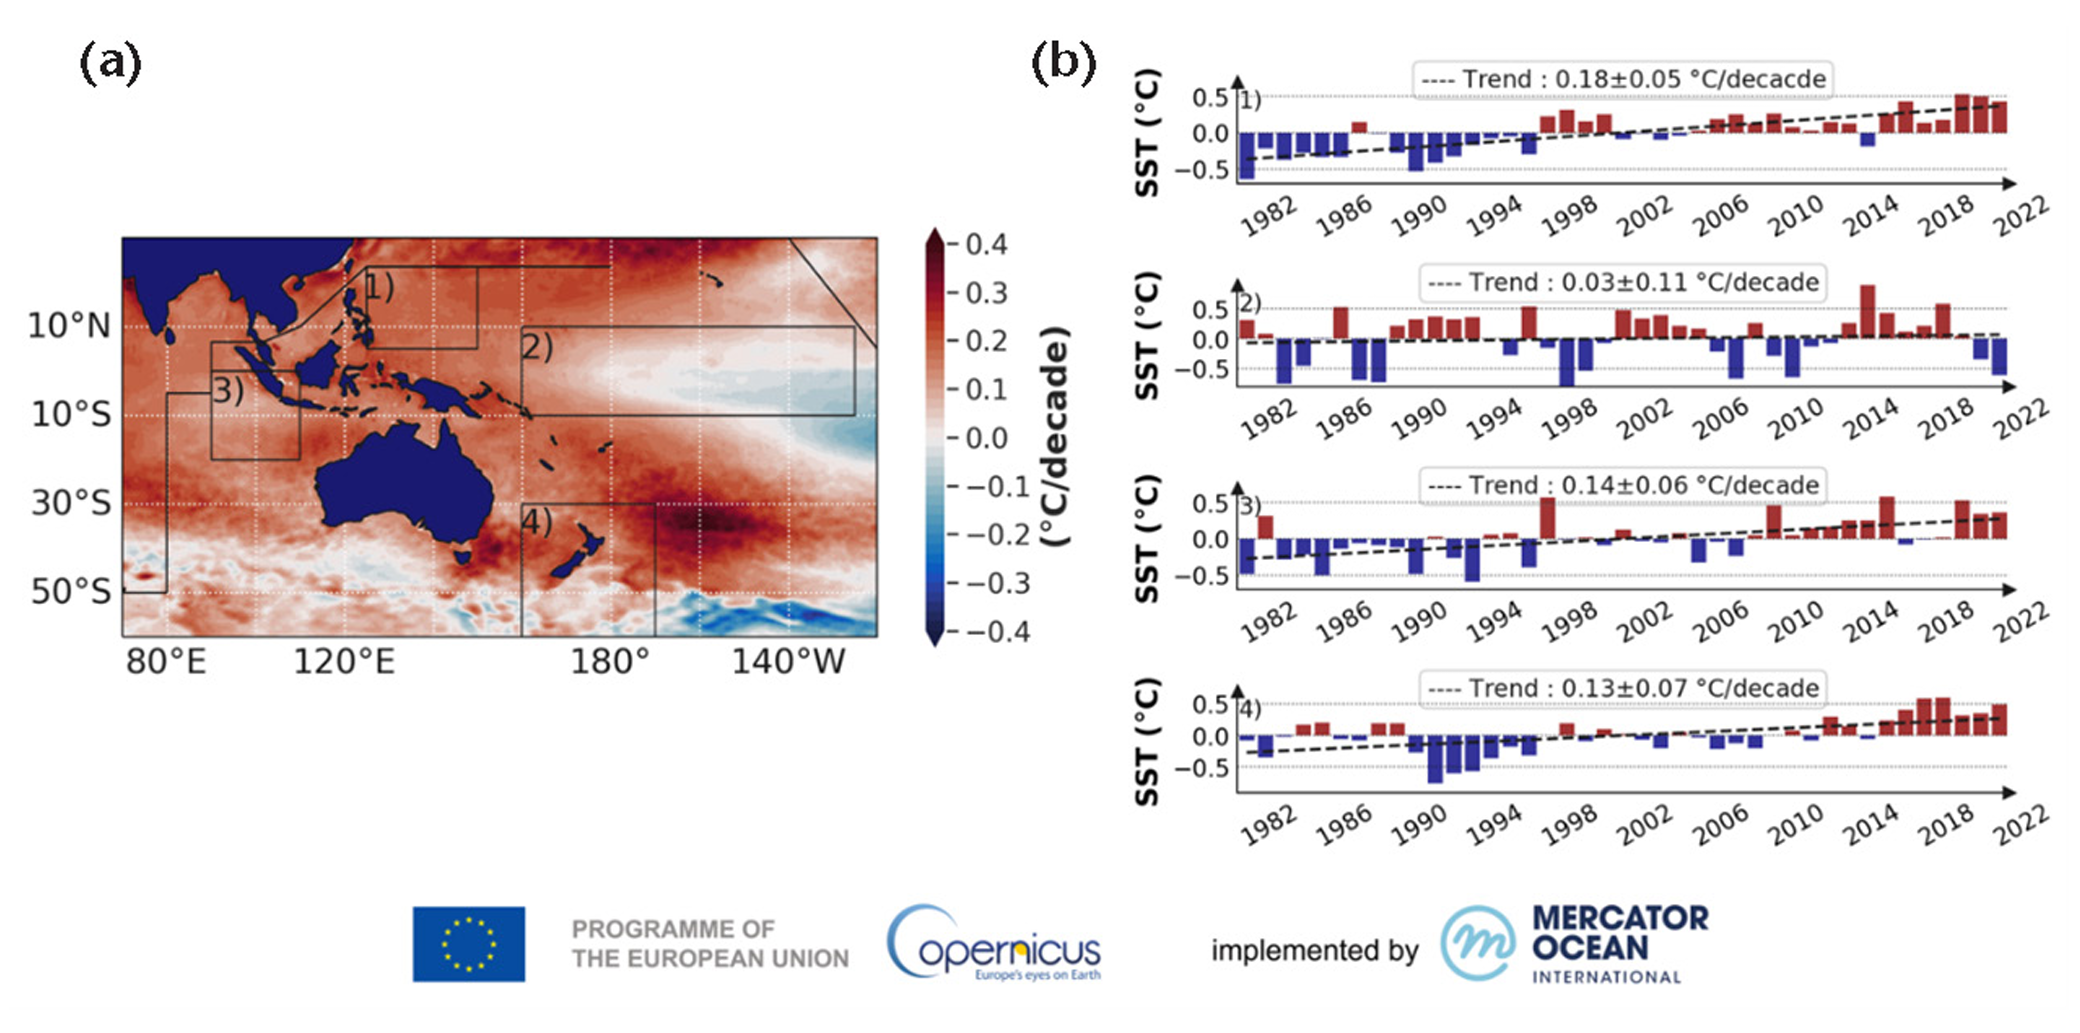
By Gabrielle Tétrault-Farber 17 August 2023 GENEVA (Reuters) – Sea levels in the South-West Pacific are rising faster than the global average, threatening low-lying islands while heat damages marine ecosystems, the U.N. meteorological agency said on Friday. In its State of the Climate in the South-West Pacific 2022 report, the World Meteorological Organization (WMO) said […]

Graphic showing the years in which the gender gap will be closed in various world regions, as measured in the year 2023. In Latin America, the gap is estimated to close in 53 years. In East Asia and the Pacific, the gap is estimated to close in 189 years. Graphic: World Economic Forum

It could take 131 years for the world to close the gender gap – “Not only are millions of women and girls losing out on economic access and opportunity, but these reversals also have wide-ranging consequences for the global economy”

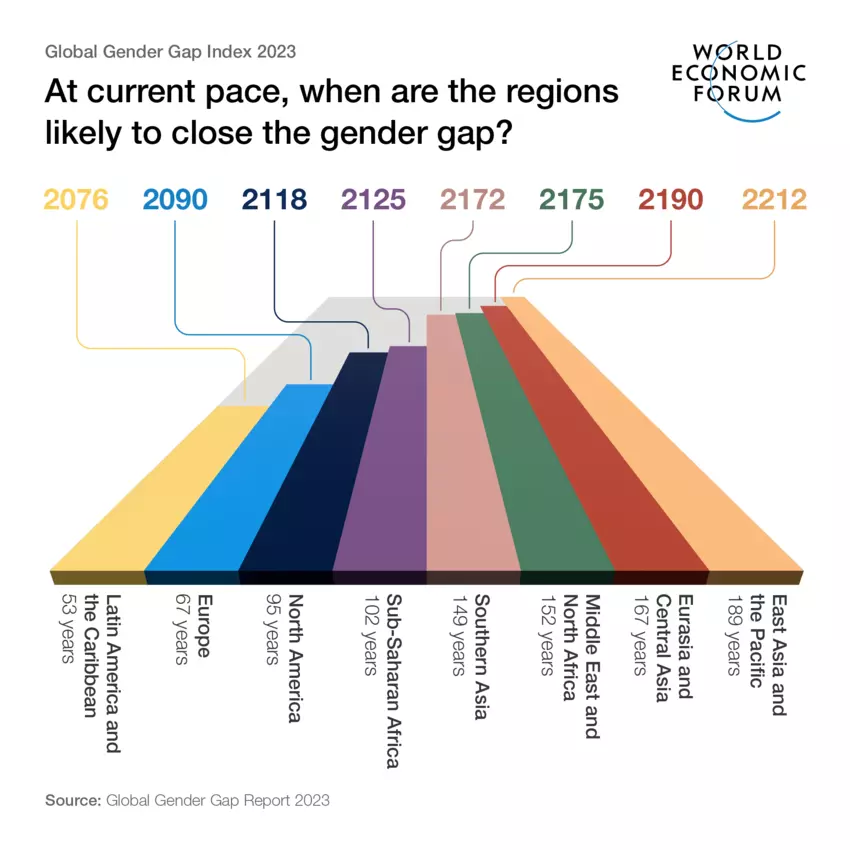
By Alicia Wallace 20 June 2023 Minneapolis (CNN) – Progress on achieving global gender equality is languishing. A new report from the World Economic Forum estimates that women won’t attain parity with men for another 131 years. In other words, not until 2154. The overall gender gap — a measurement of equality across the realms of the economy, politics, […]

Change Over Time in (a) US Life Expectancy and (b) US Life Expectancy Gap and Rank Relative to Populous Countries (Population>500000), 1950-2021. Phase 1=1950–1954; phase 2=1955–1973; phase 3=1974–1982; phase 4=1983–2009; phase 5=2010–2019; phase 6=2020–2021. Bars plot the difference in life expectancy between the United States and the populous country (population >500000) with the highest life expectancy in the given year. The country with the highest life expectancy was Norway in 1950–1962 and 1976–1977, Sweden in 1963 and 1965–1975, the Netherlands in 1964, Japan in 1978–2007, Macao in 2008–2010, and Japan in 2011–2021. The line graph plots US rank relative to other populous countries, with higher rank denoting lower US life expectancy. Source: Author’s calculations based on UN data. Graphic: Steven H. Woolf MD, MPH, 2023 / AJPH

U.S. has been falling behind on life expectancy for decades – Between 1933 and 2021, 56 countries achieved higher life expectancy than U.S. – “Americans are sicker and die earlier than people in dozens of countries”

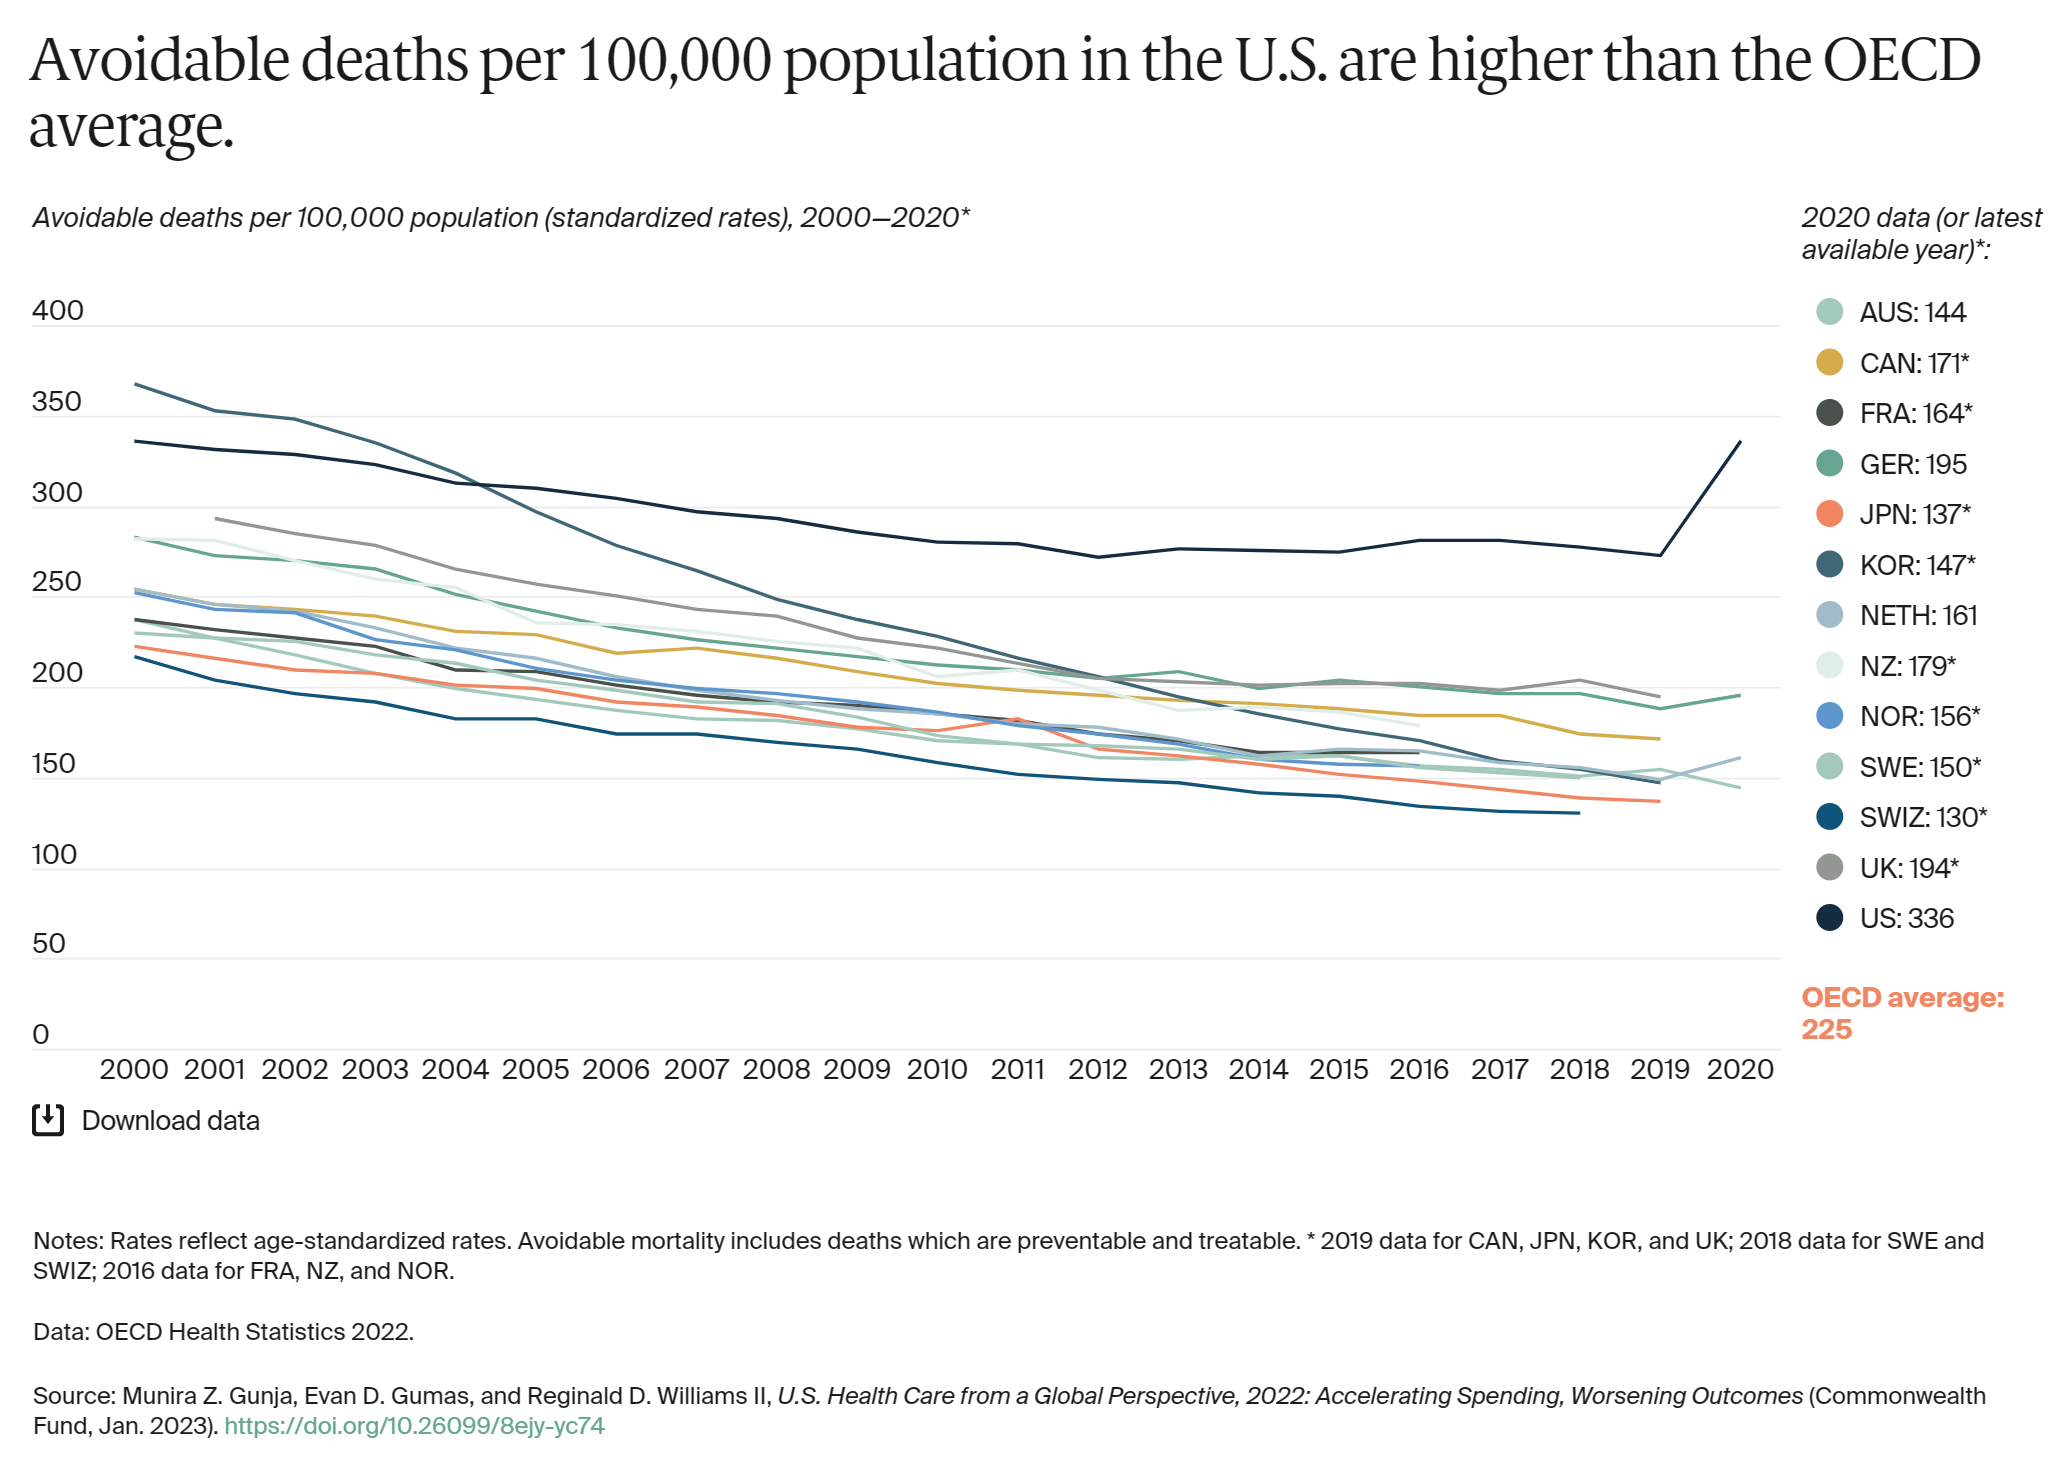
By Olivia Trani 1 June 2023 (VCU) – When it comes to public health, the United States is at a disadvantage compared with other developed countries. Americans experience more illness, have less access to health care and pay more for health services than citizens in other high-income countries. Americans also die earlier – and have been doing so […]

EIU Democracy Index 2022, global map by regime type. The average global index score stagnated in 2022. Despite expectations of a rebound after the lifting of pandemic-related restrictions, the score was almost unchanged, at 5.29 (on a 0-10 scale), compared with 5.28 in 2021. The positive effect of the restoration of individual freedoms was cancelled out by negative developments globally. The scores of more than half of the countries measured by the index either stagnated or declined. Western Europe was a positive outlier, being the only region whose score returned to pre-pandemic levels. Graphic: EIU

EIU Democracy Index 2022: Frontline democracy and the battle for Ukraine – “Overall the story is one of stagnation. This is a dismal result given that in 2022 the world started to move on from the pandemic-related suppression of individual liberties that persisted through 2020 and 2021”

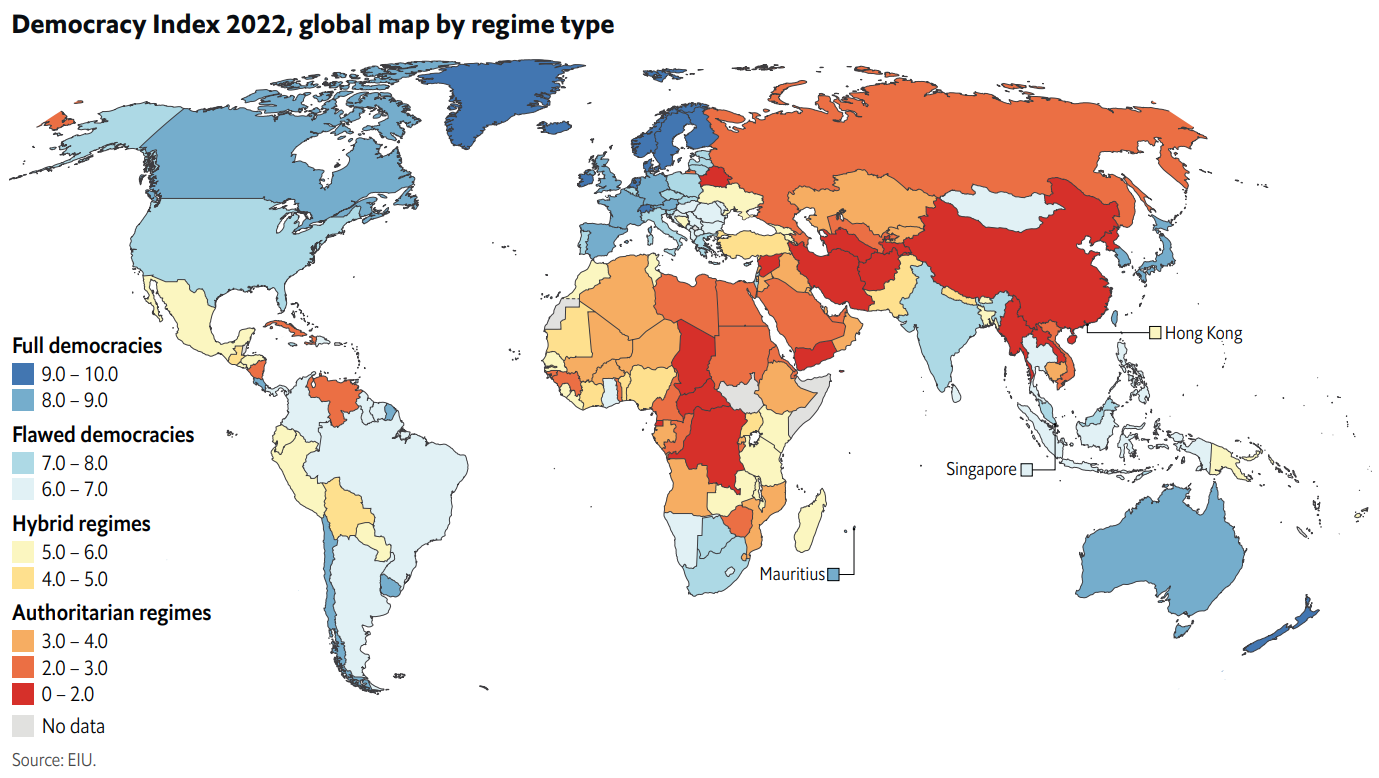
1 February 2023 (EIU) – The Democracy Index, which began in 2006, provides a snapshot of the state of democracy worldwide in 165 independent states and two territories. This covers almost the entire population of the world and the vast majority of the world’s states (microstates are excluded). The Democracy Index is based on five […]

Avoidable deaths per 100,000 population (standardized rates) in OECD nations, 2000-2020. Avoidable deaths per 100,000 population in the U.S. are higher than the OECD average. Graphic: The Commonwealth Fund

U.S. Health Care from a Global Perspective, 2022: Accelerating spending, worsening outcomes – “Americans are more likely to die younger, and from avoidable causes, than residents of peer countries”

By Munira Z. Gunja, Evan D. Gumas, and Reginald D. Williams II 31 January 2023 (The Commonwealth Fund) – In the previous edition of U.S. Health Care from a Global Perspective, we reported that people in the United States experience the worst health outcomes overall of any high-income nation.1 Americans are more likely to die younger, and […]

Map showing 28-day COVID-19 cases in U.S. counties on 26 January 2023. Graphic: Johns Hopkins University

Greg Olear: The Plague turns three – More than a million Americans are dead of COVID-19. Where is the outrage? “U.S. performance at the level of South Korea, Australia, New Zealand, or Japan in containing the pandemic would have saved over 300,000 American lives in 2020 alone”

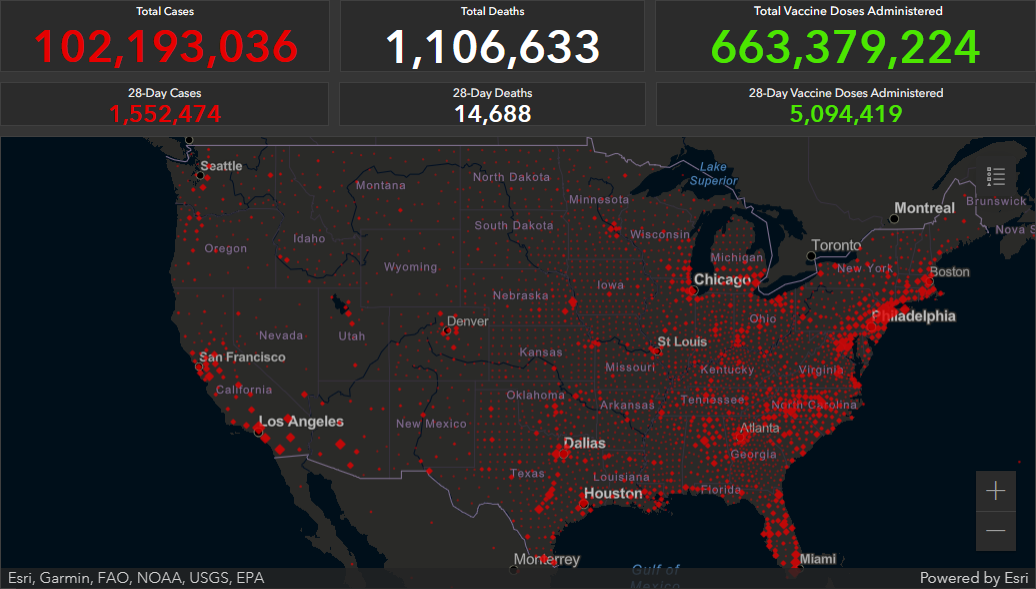
By Greg Olear 24 January 2023 (Substack) – Three years ago today, the Centers for Disease Control confirmed a second travel-related infection of the SARS-CoV-2 virus in the United States, this time in Illinois. The Illinois case was the epidemiological equivalent of the second airplane hitting the World Trade Center. It meant that the first U.S. […]

Regional glacier mass change and contributions to sea level rise from 2015 to 2100. Discs show global and regional projections of glacier mass remaining by 2100 relative to 2015 for global mean temperature change scenarios. Discs are scaled based on each region’s contribution to global mean sea level rise from 2015 to 2100 for the +2°C scenario by 2100 relative to preindustrial levels, and nested rings are colored by temperature change scenarios showing normalized mass remaining in 2100. Regional sea level rise contributions >1 mm SLE for the +2°C scenario are printed in the center of each disc. The horizontal bars below each disc show time series of area-averaged annual mass balance from 2015 to 2100 for +1.5°C (top bar) and +3°C (bottom bar) scenarios. The colorbar is saturated at −2.5 m w.e., but minimum annual values reach −4.2 m w.e. in Scandinavia. Graphic: Rounce, et al., 2022 / Science

Half of glaciers will be gone by 2100 even under Paris 1.5C accord, study finds

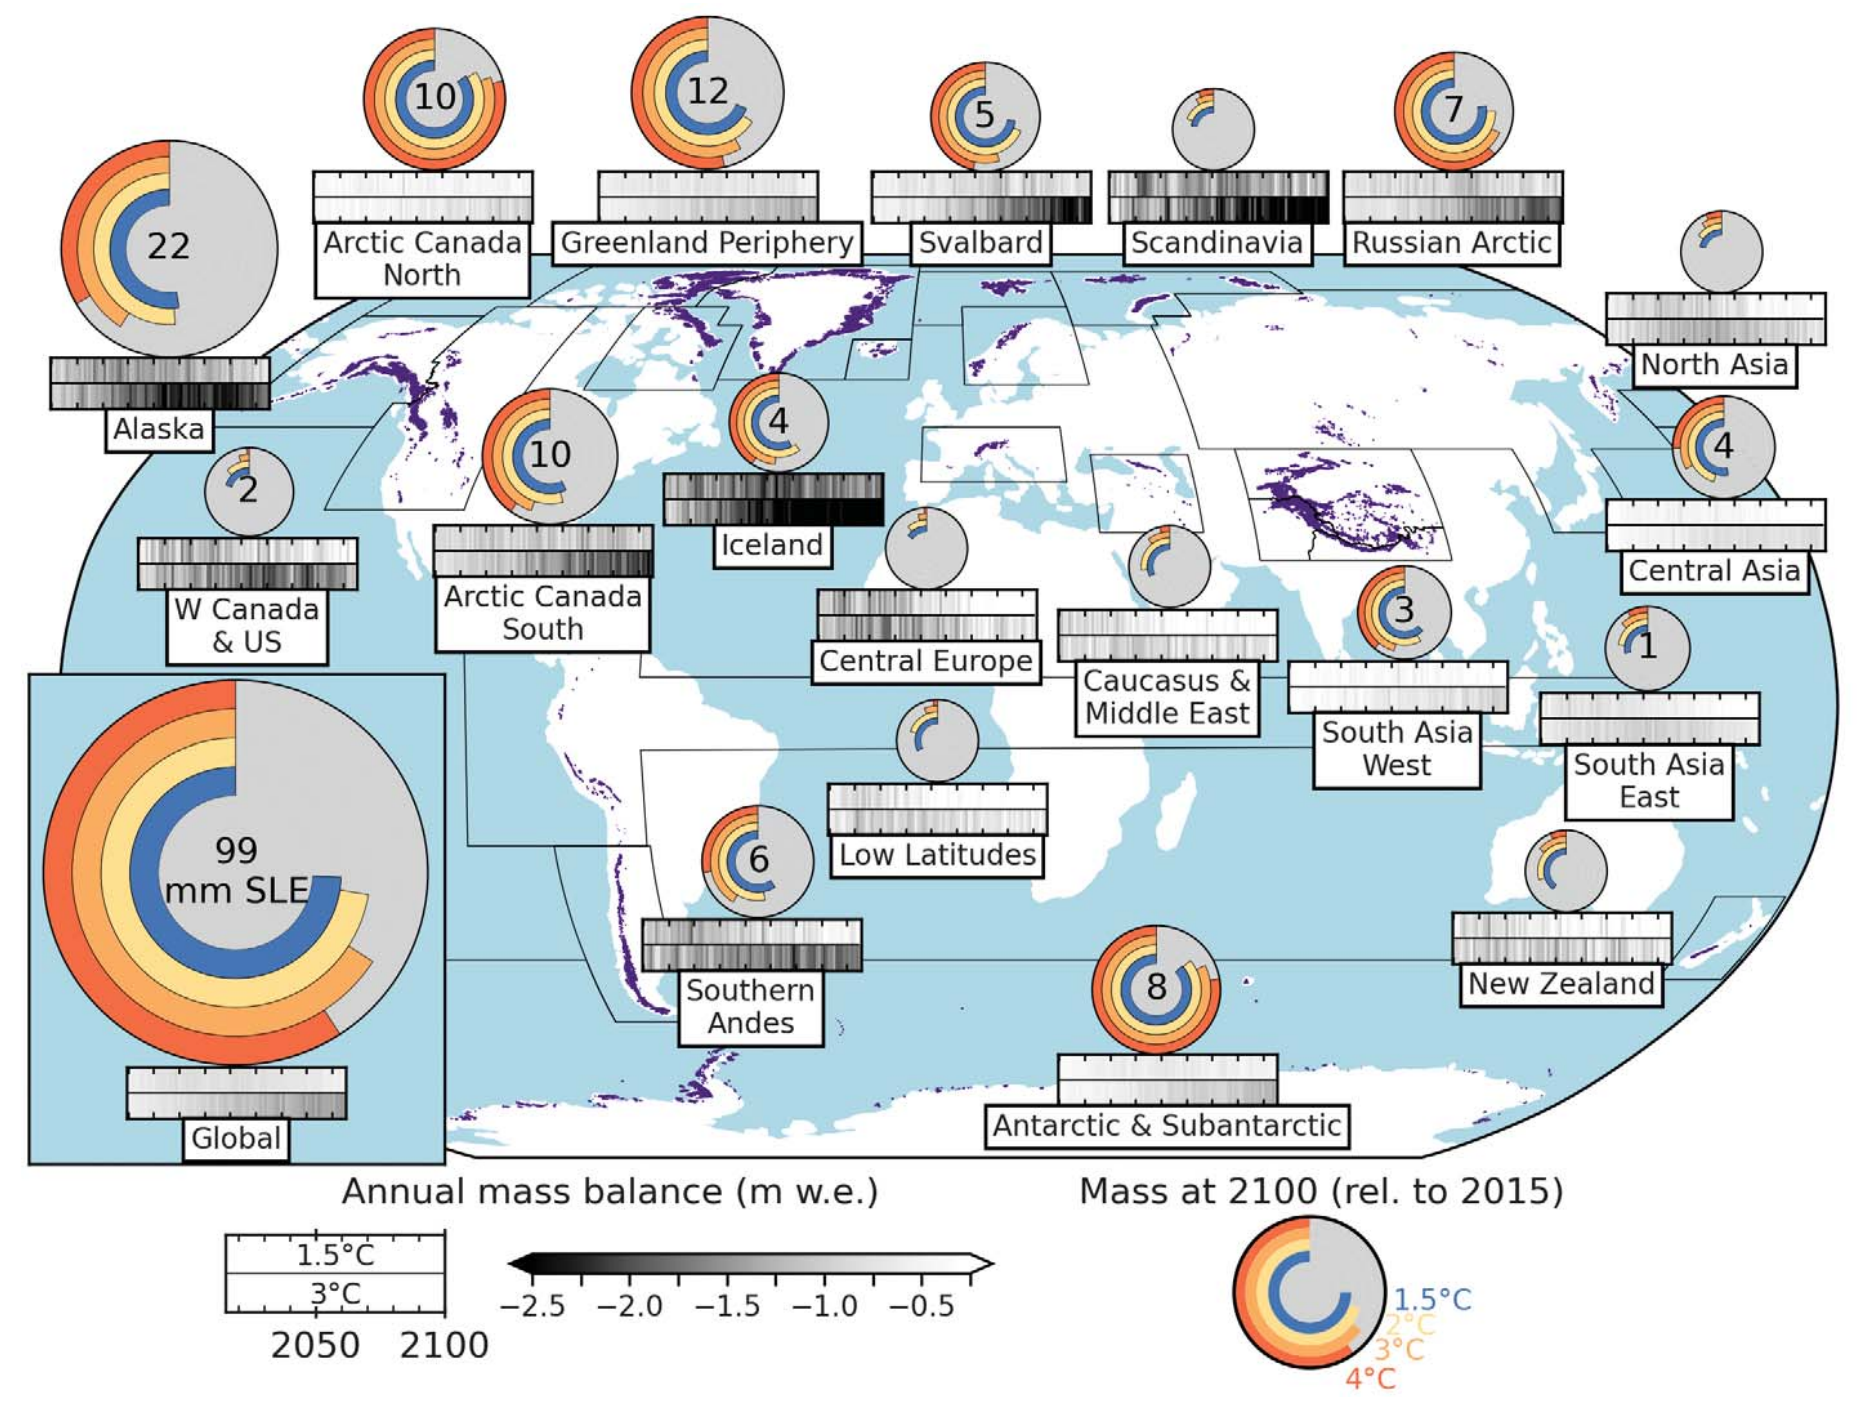
By Phoebe Weston 5 January 2023 (The Guardian) – Half the planet’s glaciers will have melted by 2100 even if humanity sticks to goals set out in the Paris climate agreement, according to research that finds the scale and impacts of glacial loss are greater than previously thought. At least half of that loss will happen […]

U.S. President Joe Biden departs after speaking at the COP27 U.N. Climate Summit, Friday, 11 November 2022, at Sharm el-Sheikh, Egypt. Photo: Alex Brandon / AP Photo

COP27 ends in tears and frustration – Reactions from participants – “The world will not thank us”

By Camilla Hodgson 20 November 2022 Sharm el-Sheikh, Egypt (Financial Times) – Choking back his emotions, Tuvalu finance minister Seve Paeniu held up a photo of five youth delegates from his country and expressed his “deep regret and disappointment” that COP27 had been a “missed opportunity”. More than 80 countries had supported a proposal to […]

Landsat images from 21 February 2000 (left) and 27 July 2019 (right) illustrating glacier retreat on top of Mount Kilimanjaro (United Republic of Tanzania). Photo: U.S. Geological Survey

Kilimanjaro’s and Africa’s last glaciers to go by 2050, says UN – “What is quite unprecedented in the historical record is how quickly this is happening”

By Patrick Hughes 3 November 2022 (BBC News) – Glaciers across the globe – including the last ones in Africa – will be unavoidably lost by 2050 due to climate change, the UN says in a report [UNESCO finds that some iconic World Heritage glaciers will disappear by 2050 –Des]. Glaciers in a third of […]

Global human population, 1700-2022. On 15 November 2022, the world’s population was estimated to reach 8 billion people, having grown by 1 billion since 2010. This is a remarkable milestone given that the human population numbered under 1 billion for millennia until around 1800, and that it took more than 100 years to grow from 1 to 2 billion. By comparison, the increase of the world’s population over the last century has been quite rapid. Despite a gradual slowing in the pace of growth, the global population is projected to surpass 9 billion around 2037 and 10 billion around 2058. Graphic: UN DESA

Global human population hits 8 billion – “We are already overstretching what we have: the housing, roads, the hospitals, schools. Everything is overstretched.”

By Dan Ikpoyi and Chinedu Asadu 15 November 2022 LAGOS, Nigeria (AP) – The world’s population will likely hit an estimated 8 billion people on Tuesday, according to a United Nations projection, with much of the growth coming from developing nations in Africa. Among them is Nigeria, where resources are already stretched to the limit. More than […]

Social media & sharing icons powered by UltimatelySocial