Half of glaciers will be gone by 2100 even under Paris 1.5C accord, study finds
![Projected global glacier changes for scenarios of global mean temperature change. (A and B) Mass remaining, (C and D) area remaining, (E and F) glaciers remaining, (G and H) sea level rise (SLR) contributed from glaciers, and (I and J) area-averaged mass change rate for all glaciers globally. Projections are shown from 2015 to 2100 (left panels), and at 2100 (right panels). Values in [(A) to (H)] are relative to 2015. Colors depict the global mean temperature change scenarios (left panels) and the SSPs corresponding to the global temperature changes (right panels). The number (n) of glacier projections with different general circulation models (GCMs) and SSPs that fall into each temperature change scenario is shown in the legend. Lines (left panels) show the ensemble median and shading indicates the 95 percent CI for each temperature change scenario. Graphic: Rounce, et al., 2022 / Science](https://desdemonadespair.net/wp-content/uploads/2023/01/Projected-global-glacier-changes-for-scenarios-of-global-mean-temperature-change-Rounce-et-al-2022-Science.png)
By Phoebe Weston
5 January 2023
(The Guardian) – Half the planet’s glaciers will have melted by 2100 even if humanity sticks to goals set out in the Paris climate agreement, according to research that finds the scale and impacts of glacial loss are greater than previously thought. At least half of that loss will happen in the next 30 years.
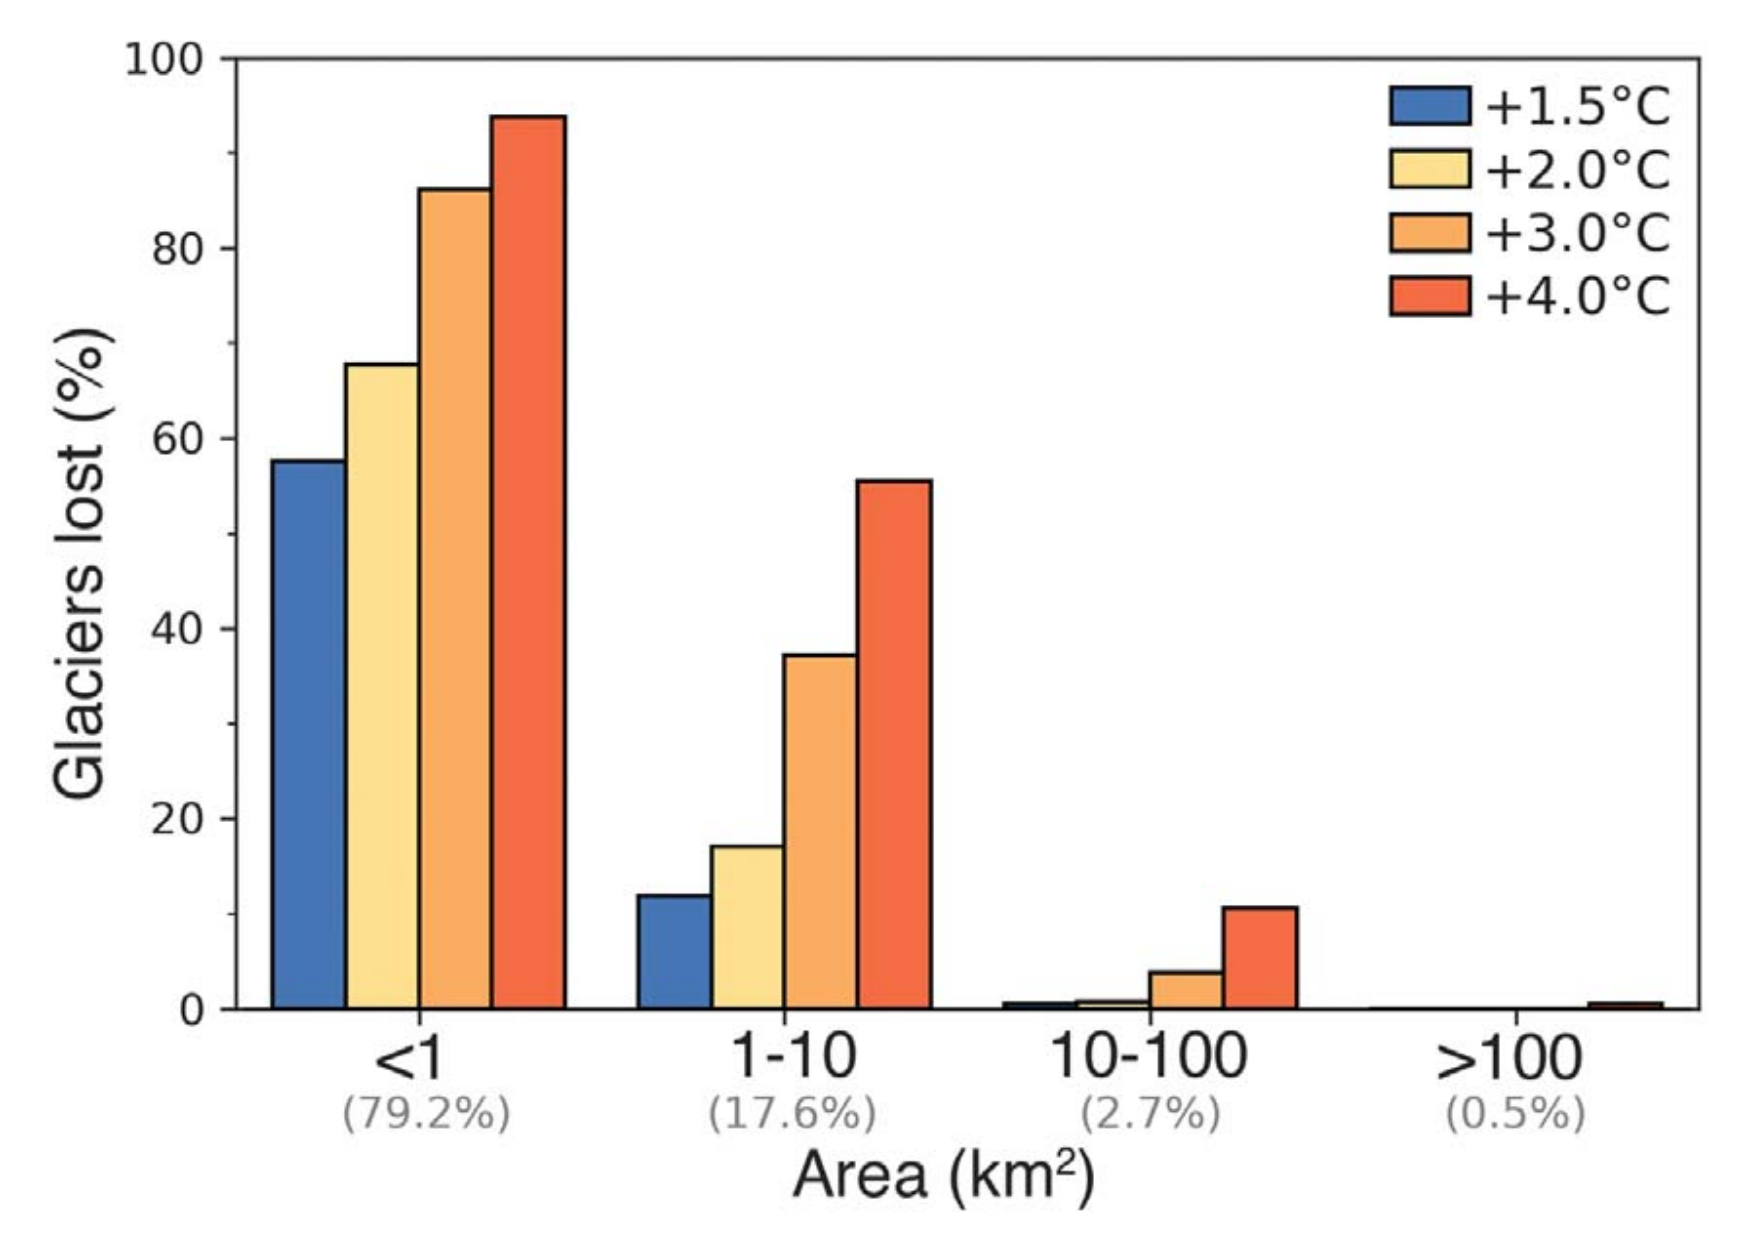
Researchers found 49% of glaciers would disappear under the most optimistic scenario of 1.5C of warming. However, if global heating continued under the current scenario of 2.7C of warming, losses would be more significant, with 68% of glaciers disappearing, according to the paper [pdf], published in Science. There would be almost no glaciers left in central Europe, western Canada, and the U.S. by the end of the next century if this happened.
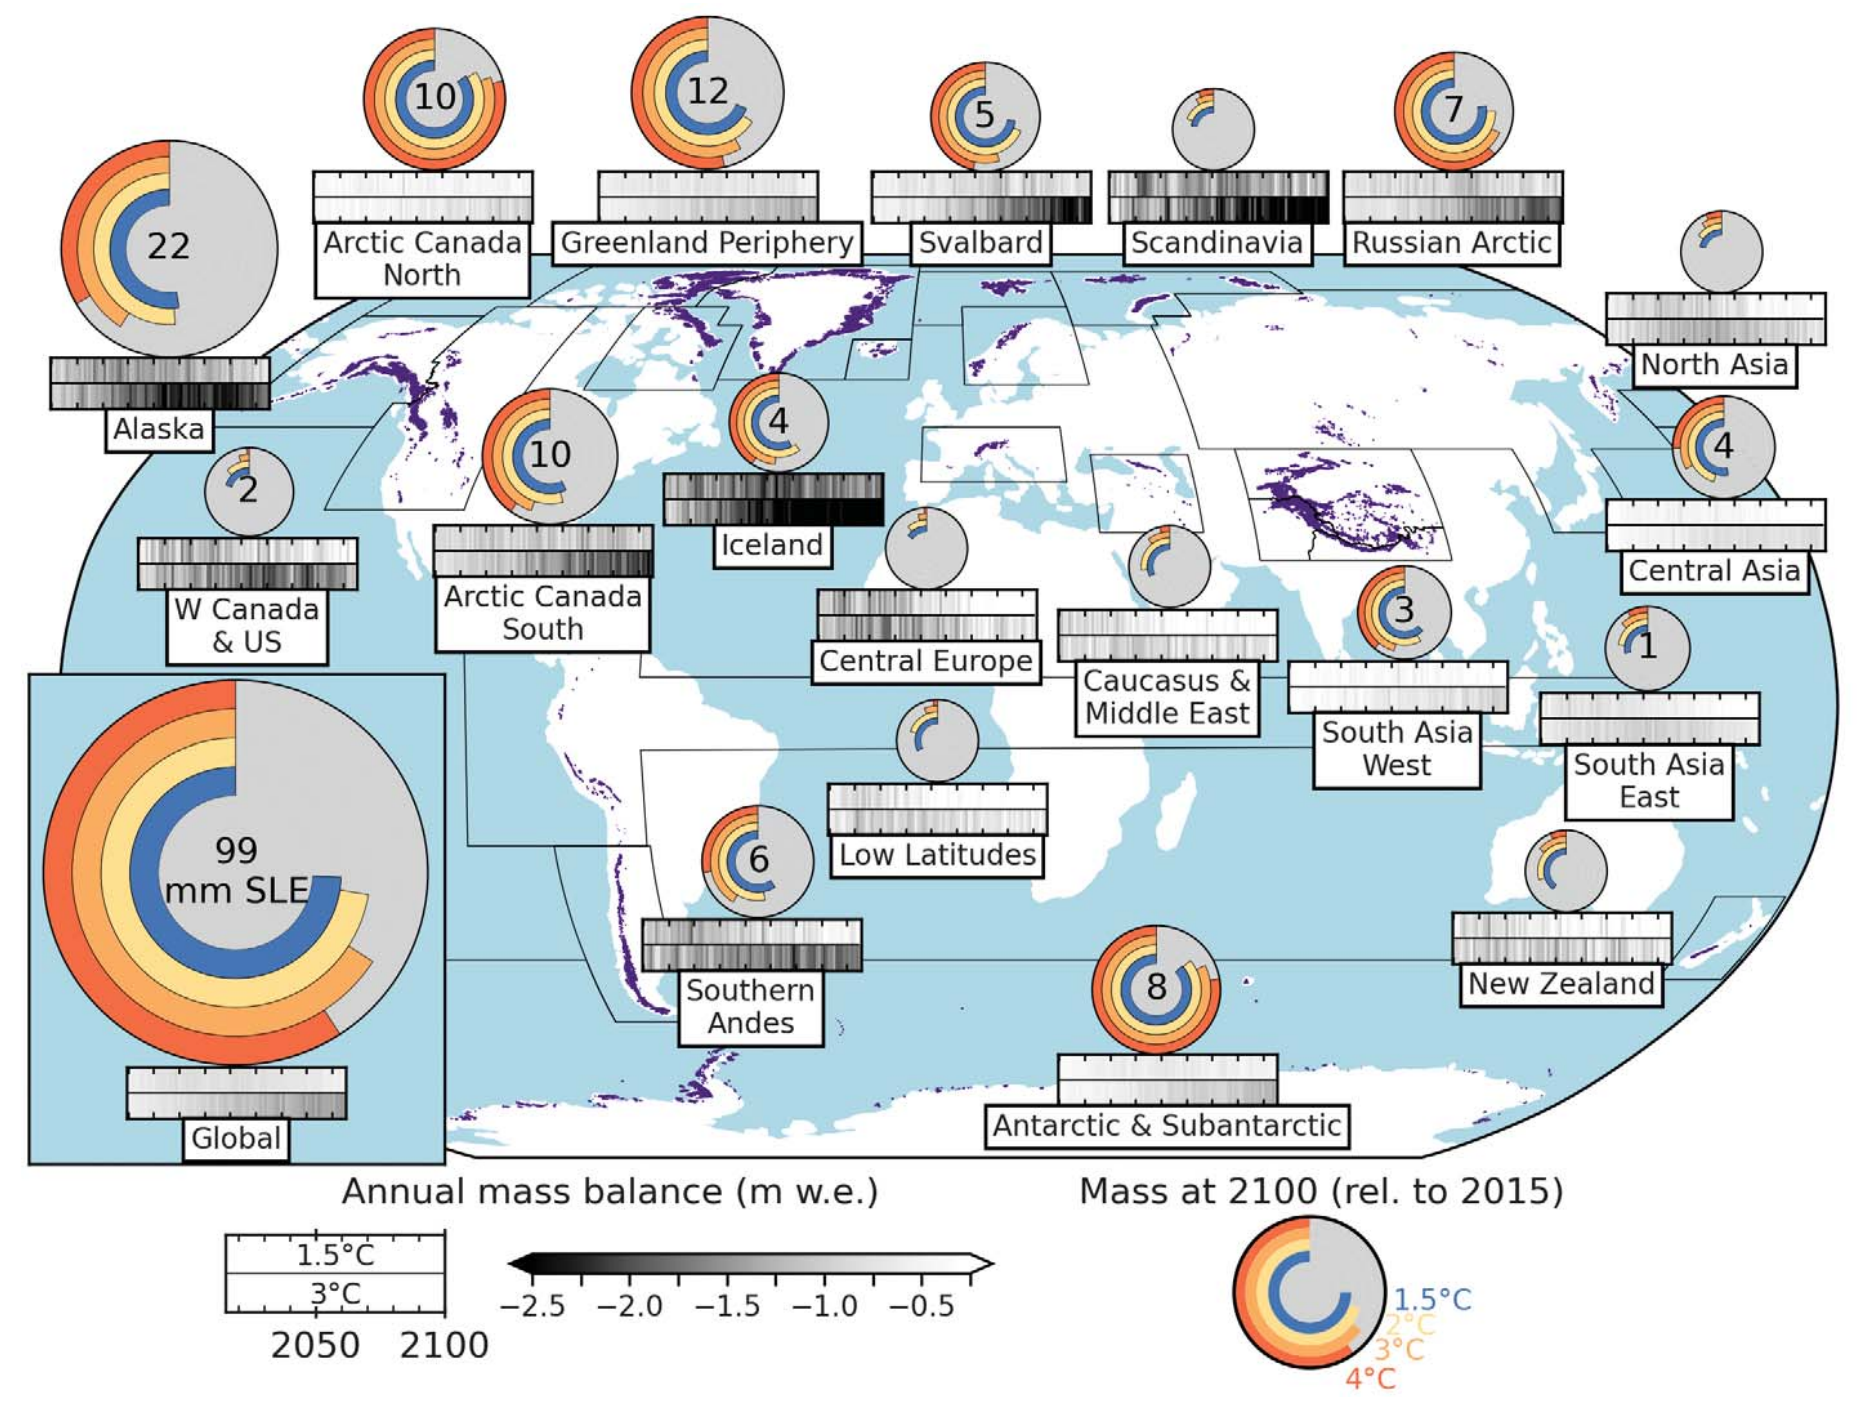
This will significantly contribute to sea level rise, threaten the supply of water of up to 2 billion people, and increase the risk of natural hazards such as flooding. The study looked at all glacial land ice except for Greenland and Antarctic ice sheets.
If temperature increases are limited to 1.5C of warming, average sea levels would increase by 90mm (3.5in) from 2015 to 2100, but with 2.7C of warming, glacial melt would lead to around 115mm of sea level rise. These scenarios are up to 23% more than previous models had estimated.
Mountain glacier melt is believed to contribute to more than a third of sea level rise. A lot of this loss is unavoidable, but the magnitude of loss is directly related to temperature increases, so acting on the climate crisis is key. Researchers wrote in the paper: “The rapidly increasing glacier mass losses as global temperature increases beyond 1.5C stresses the urgency of establishing more ambitious climate pledges to preserve the glaciers in these mountainous regions.”
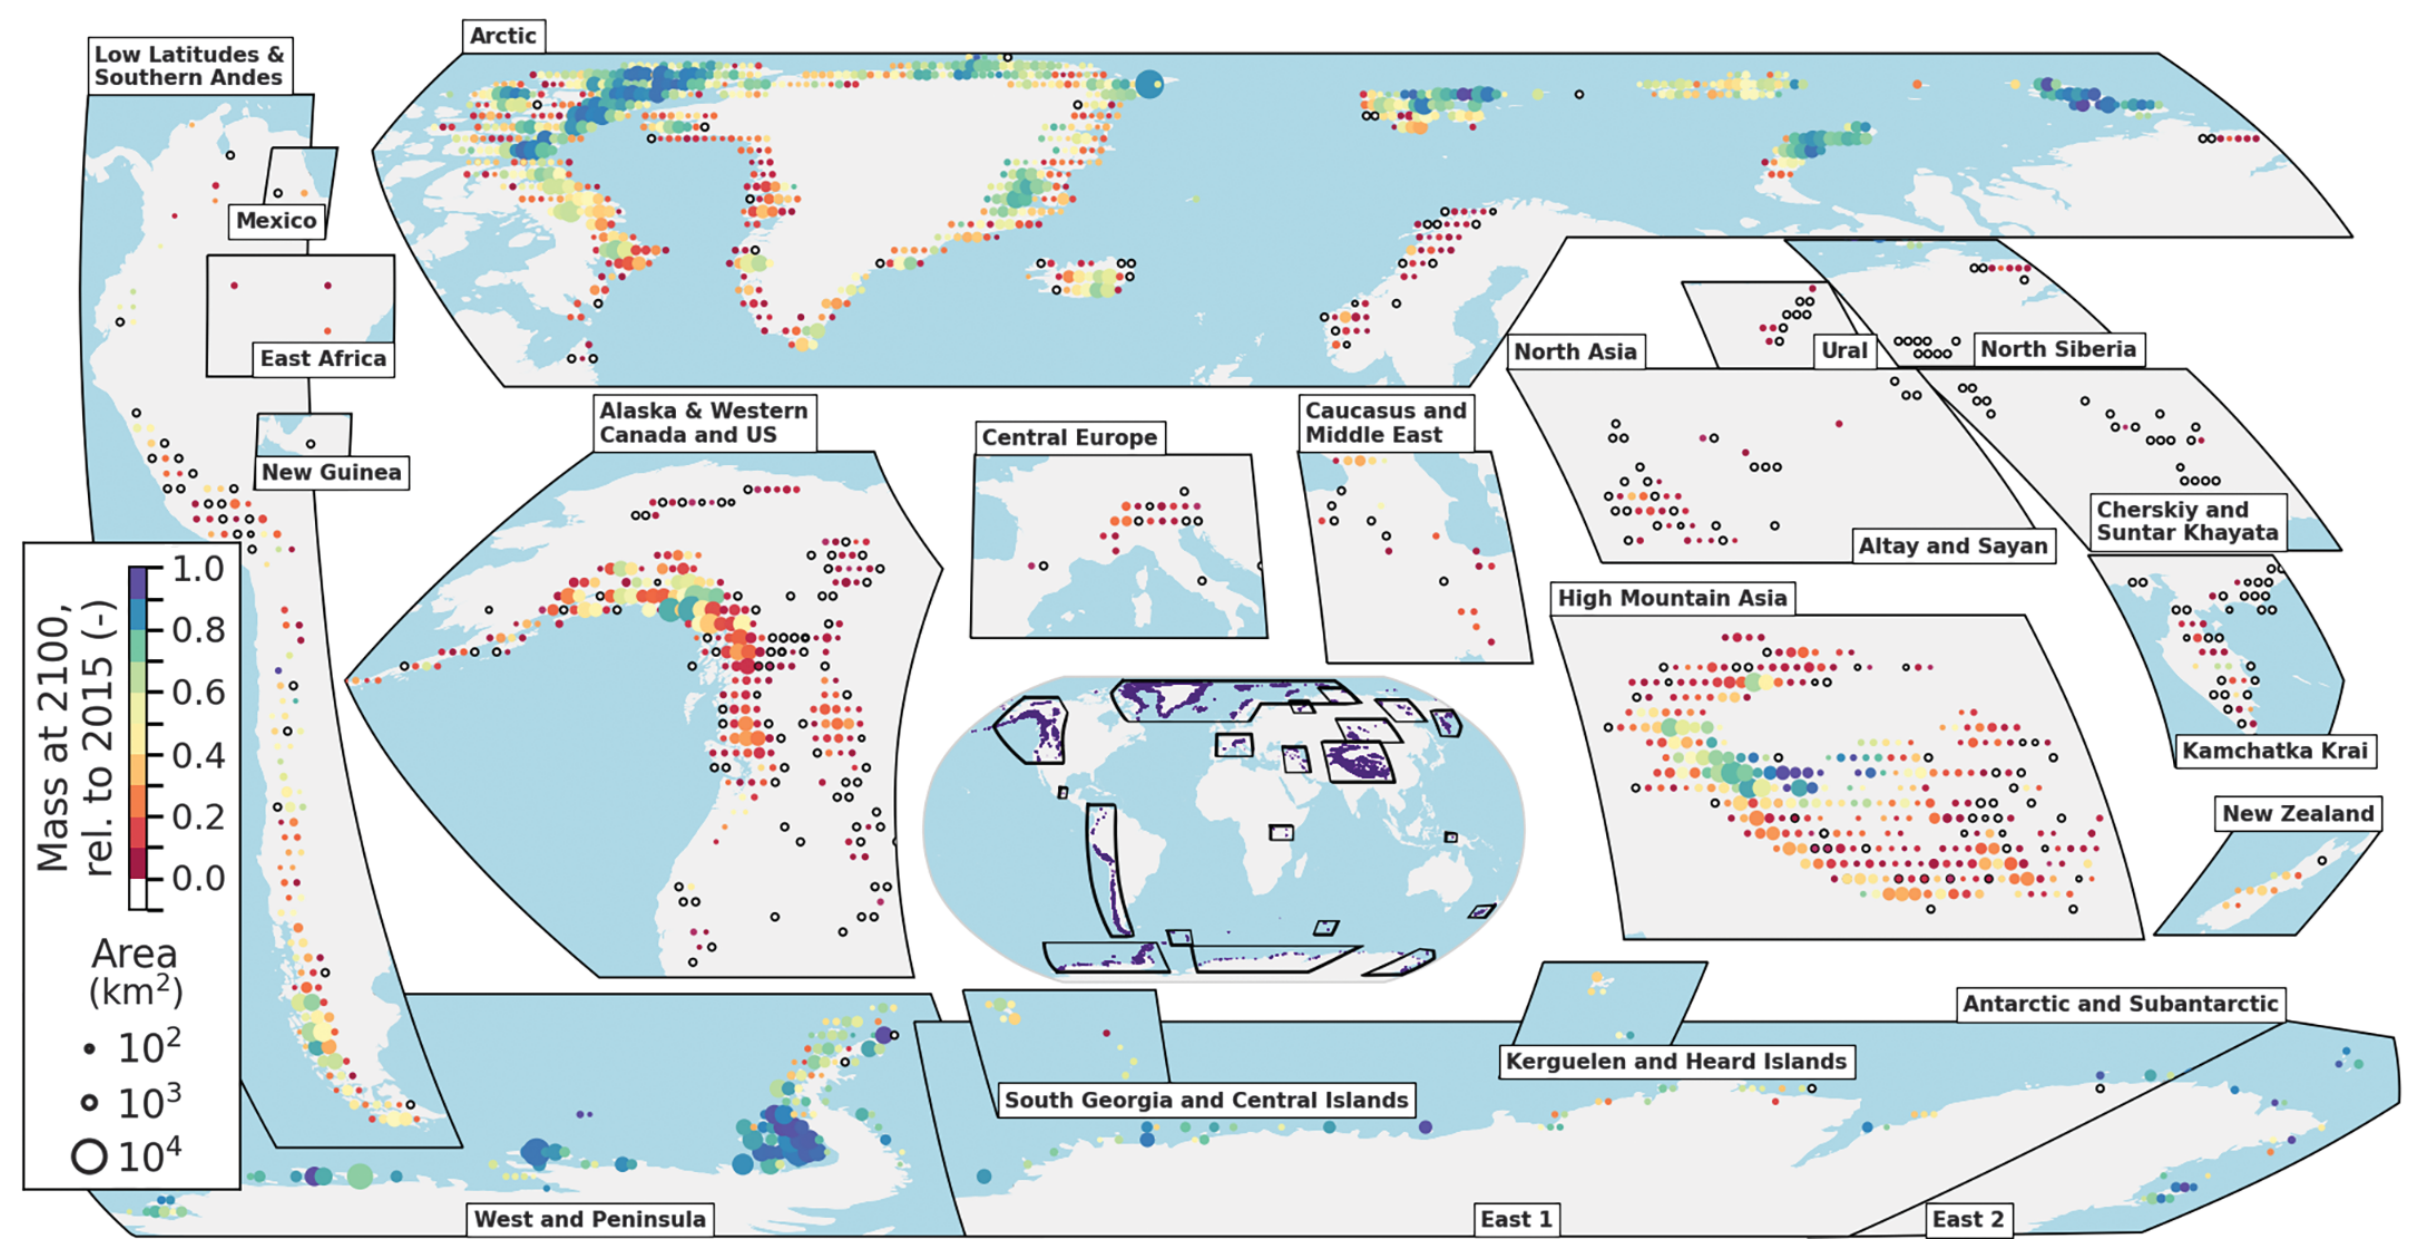
The team used two decades of satellite data to map the planet’s glaciers with greater precision than ever before. Previous models had relied on measurements of specific glaciers, and that information was then extrapolated, but now researchers could get data points on each of the planet’s 200,000 glaciers. For the first time, this gave them insight into how many would be lost under different climate change scenarios.
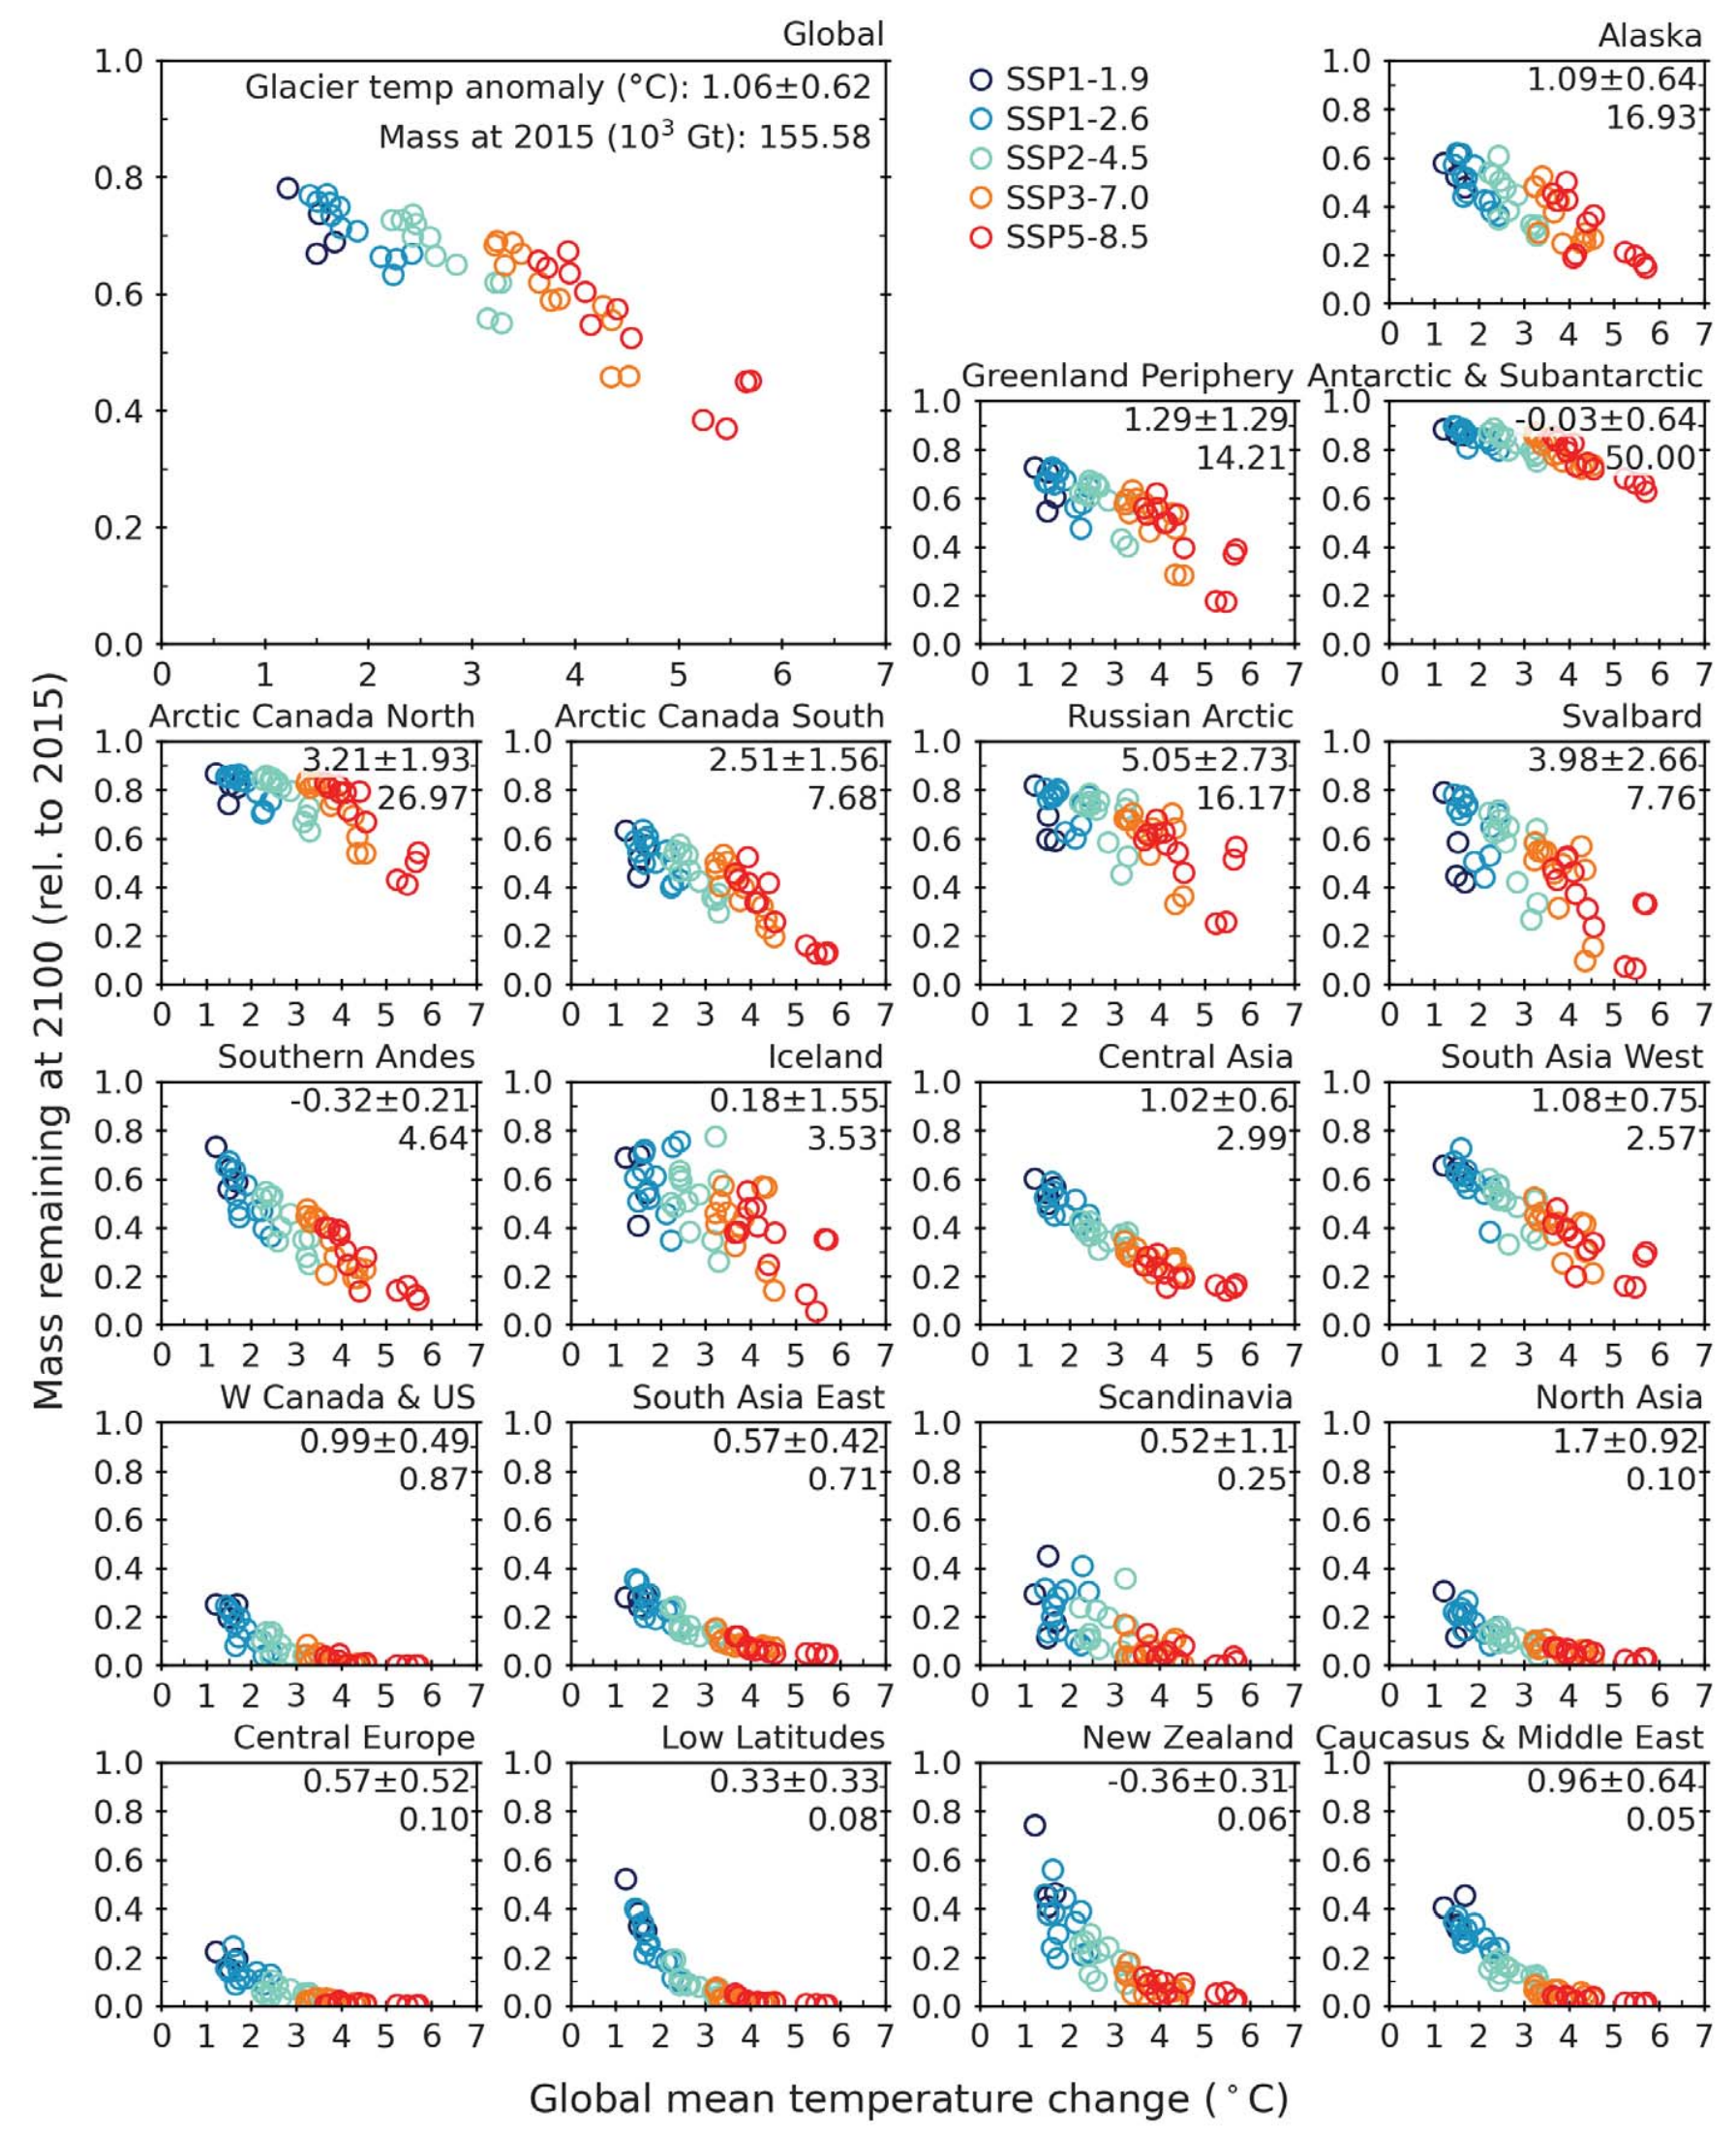
The study’s lead author, Dr. David Rounce, a civil and environmental engineer from Carnegie Mellon University and the University of Alaska Fairbanks, said: “This is the first time we have isolated the number of glaciers that will be lost – before it was the total mass loss.” Most of the glaciers that will be lost are small, currently less than 1 sq km. Although they contribute less to the total volume, they are most vulnerable to change. This is why the total loss of mass is less – so, for example, under the 2.7C scenario 68% of glaciers will be lost but the relative mass is less – projected to be 32%.
Small glaciers are an important source of water and livelihood for millions of people. Rounce said: “When we think about the locations where most people see and visit glaciers, it’s really in locations where they’re accessible, like in central Europe, or in high mountain Asia. In these regions there are a lot of smaller glaciers. They’re really at the core of the societies and economies of those locations.”
Lower mountain ranges such as the Alps and the Pyrenees are among those worst affected. In the Alps, for example, by 2050, glaciers are expected to be on average 70% smaller, many of the smaller ones would have already disappeared, with snow tops replaced by bare rock in some locations, and with significant losses in biodiversity as a result. Alpine flowers could become extinct after glaciers disappear as more competitive species colonise terrain higher up the mountain. Proglacial environments are highly sensitive to global heating, and mountain species are subject to the “escalator to extinction”. [more]
Half of glaciers will be gone by 2100 even under Paris 1.5C accord, study finds
Global glacier change in the 21st century: Every increase in temperature matters
ABSTRACT: Glacier mass loss affects sea level rise, water resources, and natural hazards. We present global glacier projections, excluding the ice sheets, for shared socioeconomic pathways calibrated with data for each glacier. Glaciers are projected to lose 26 ± 6% (+1.5°C) to 41 ± 11% (+4°C) of their mass by 2100, relative to 2015, for global temperature change scenarios. This corresponds to 90 ± 26 to 154 ± 44 millimeters sea level equivalent and will cause 49 ± 9 to 83 ± 7% of glaciers to disappear. Mass loss is linearly related to temperature increase and thus reductions in temperature increase reduce mass loss. Based on climate pledges from the Conference of the Parties (COP26), global mean temperature is projected to increase by +2.7°C, which would lead to a sea level contribution of 115 ± 40 millimeters and cause widespread deglaciation in most mid-latitude regions by 2100.
Global glacier change in the 21st century: Every increase in temperature matters