By Jonathan Watts 14 August 2024 (The Guardian) – A record 15 national heat records have been broken since the start of this year, an influential climate historian has told the Guardian, as weather extremes grow more frequent and climate breakdown intensifies. An additional 130 monthly national temperature records have also been broken, along with […]
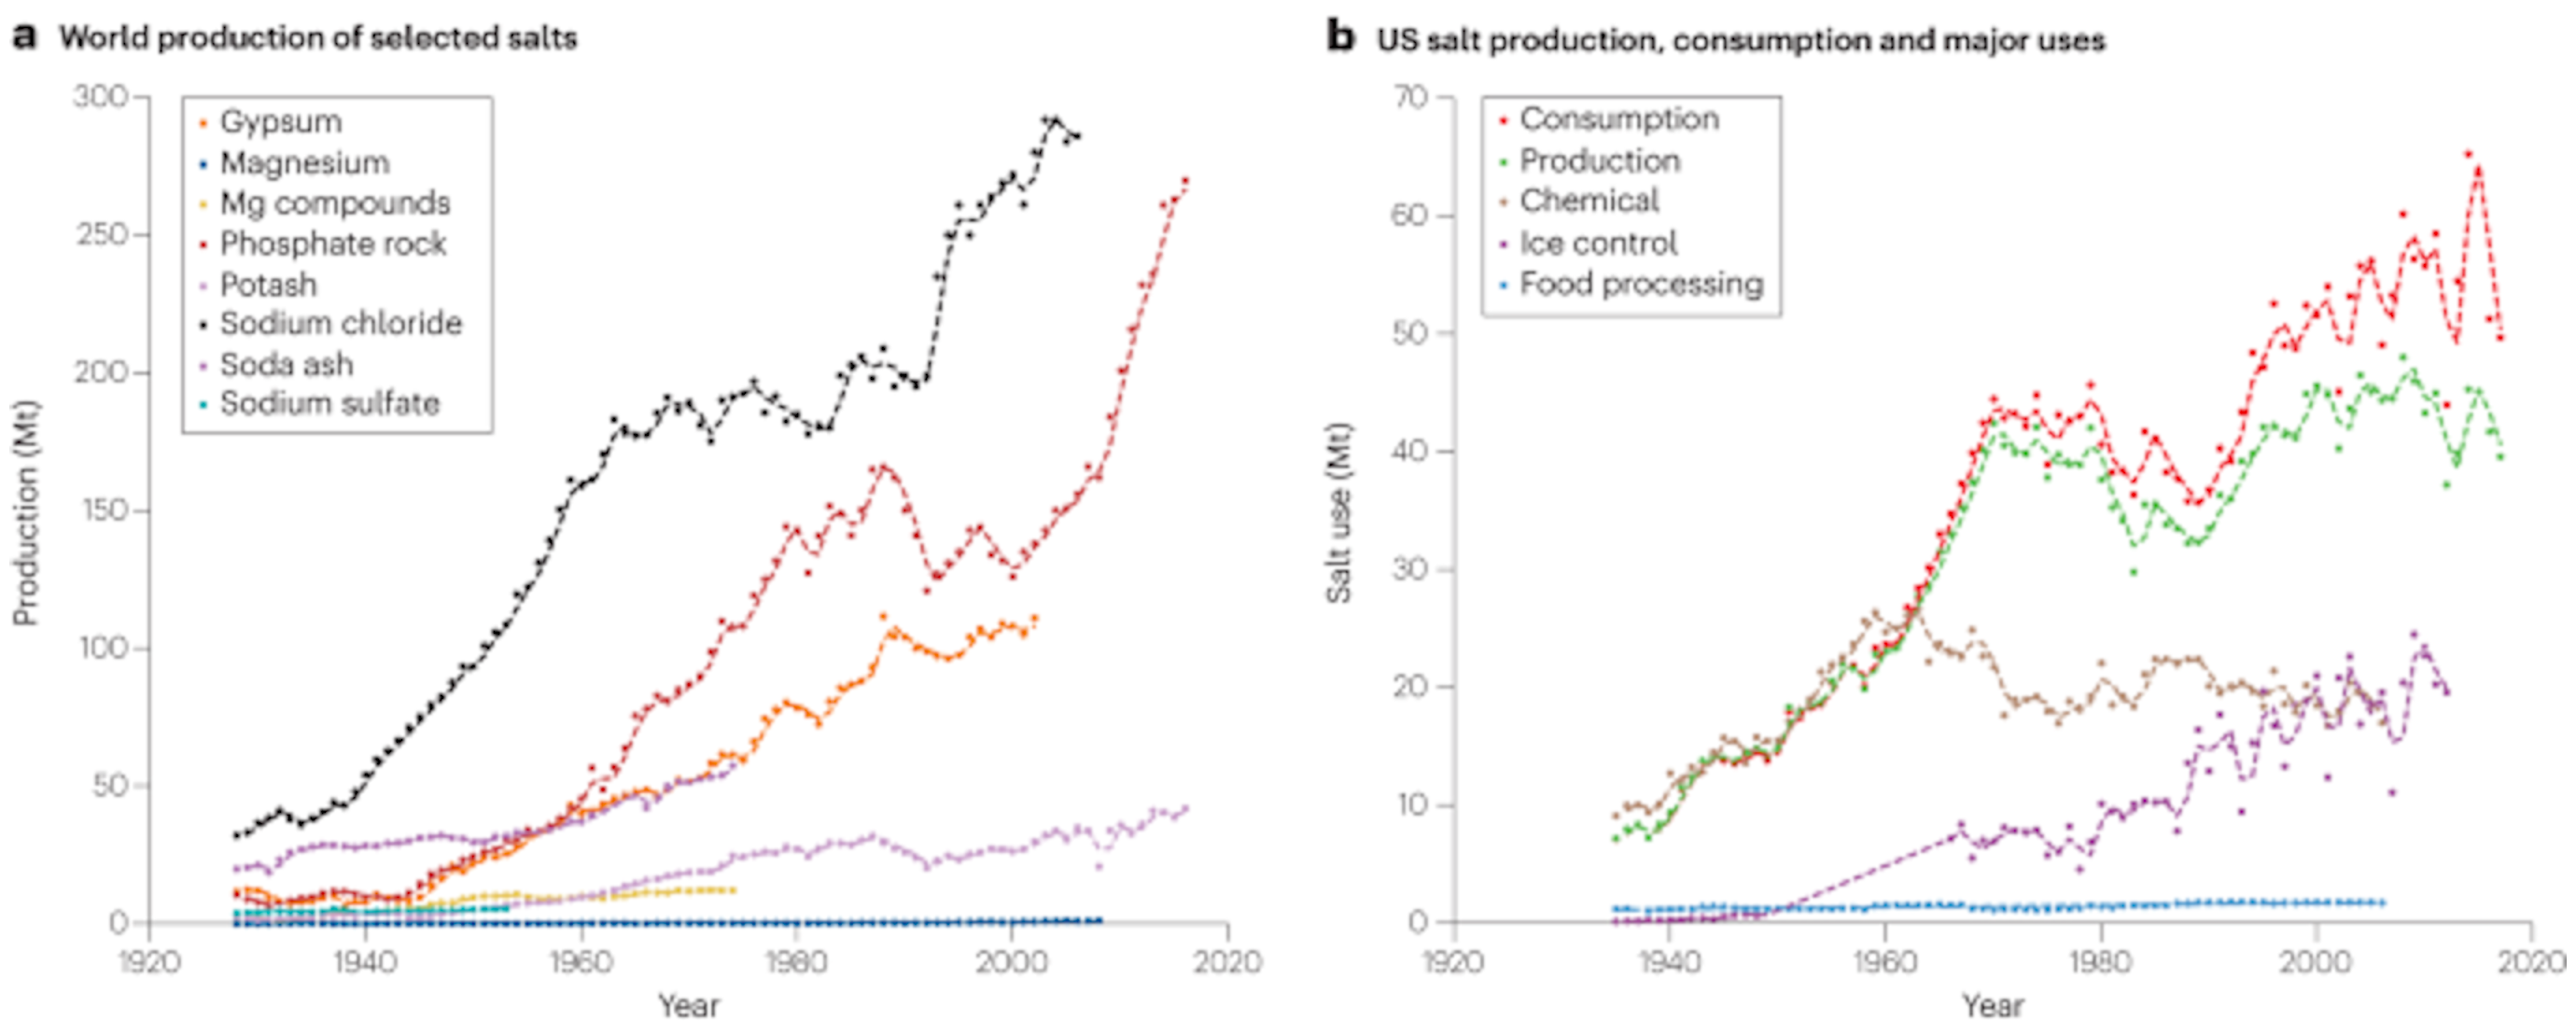
31 October 2023 (University of Maryland) – The influx of salt in streams and rivers is an ‘existential threat,’ according to a research team led by a UMD geologist. The planet’s demand for salt comes at a cost to the environment and human health, according to a new scientific review led by University of Maryland Geology Professor Sujay Kaushal. Published […]
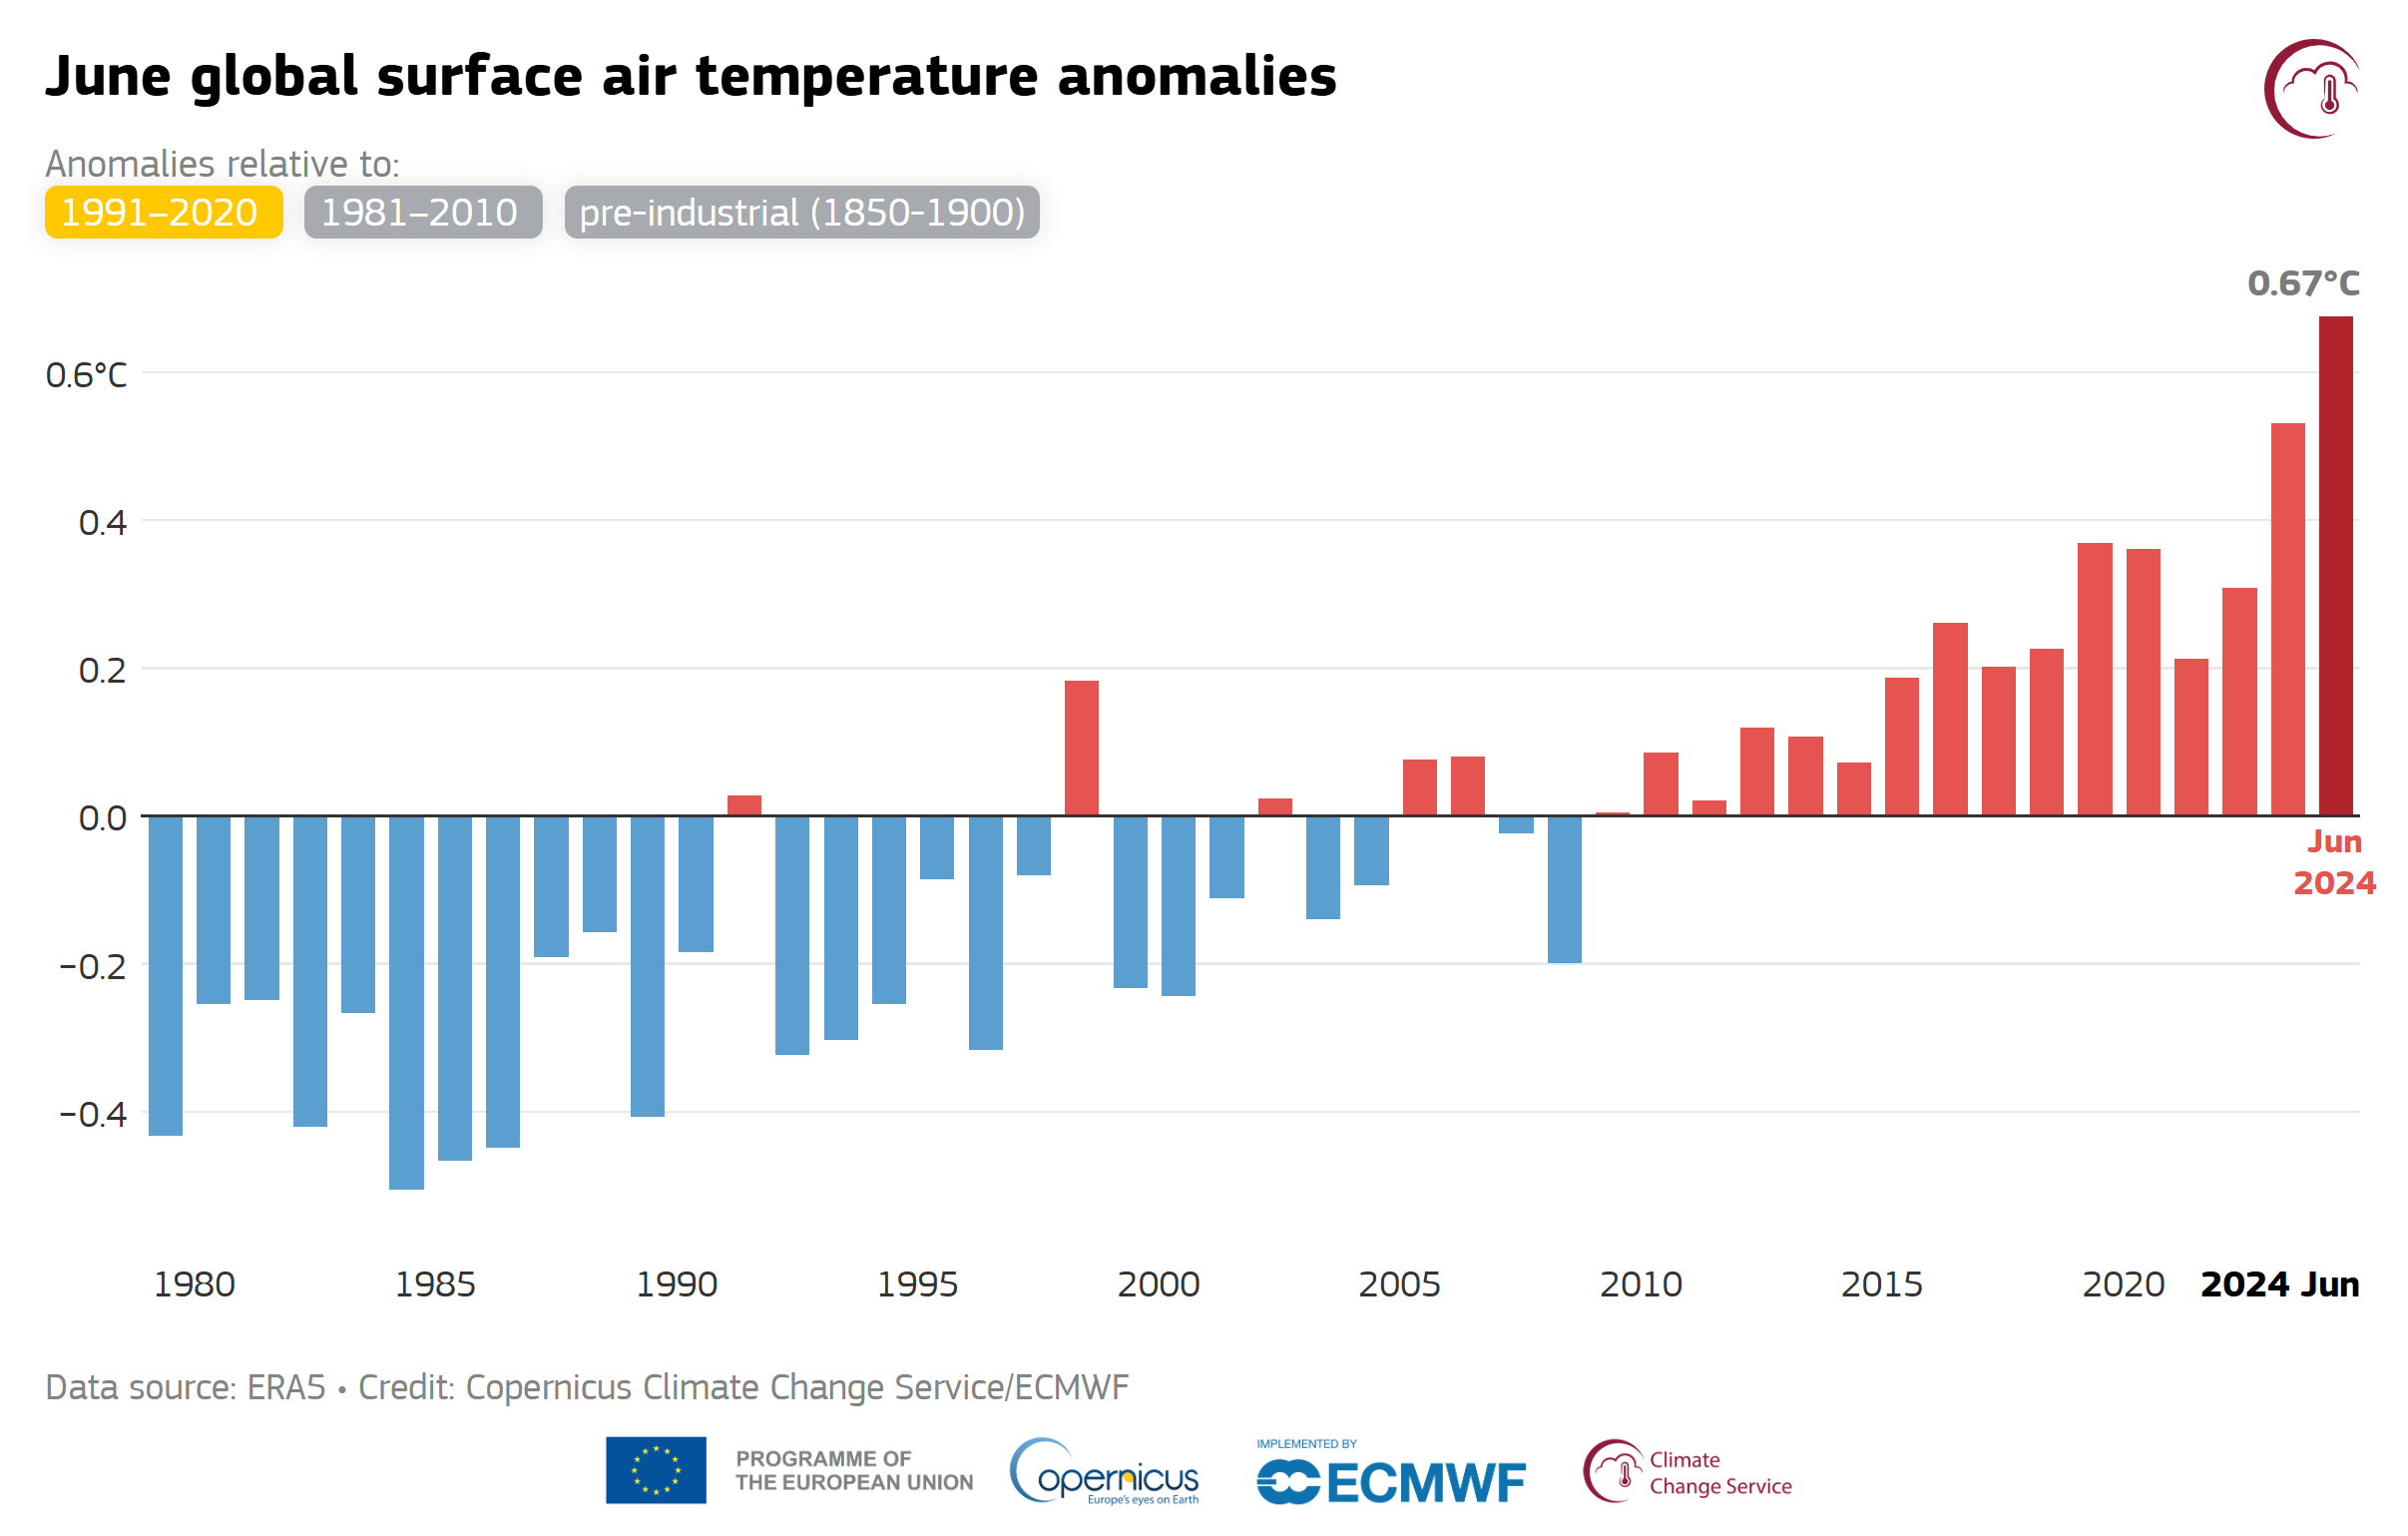
By Seth Borenstein 7 July 2024 (AP) – Earth’s more than year-long streak of record-shattering hot months kept on simmering through June, according to the European climate service Copernicus. There’s hope that the planet will soon see an end to the record-setting part of the heat streak, but not the climate chaos that has come […]
By Max Matza and Eloise Alanna 26 July 2024 MONTREAL (BBC News) – Tears welled in Tasha Porttin’s eyes as she reminisced on the sheer beauty of the place she’s called home for 10 years. Jasper’s mountain peaks and the picture-perfect pine trees that frame its vivid baby-blue lakes make it a popular tourist destination […]
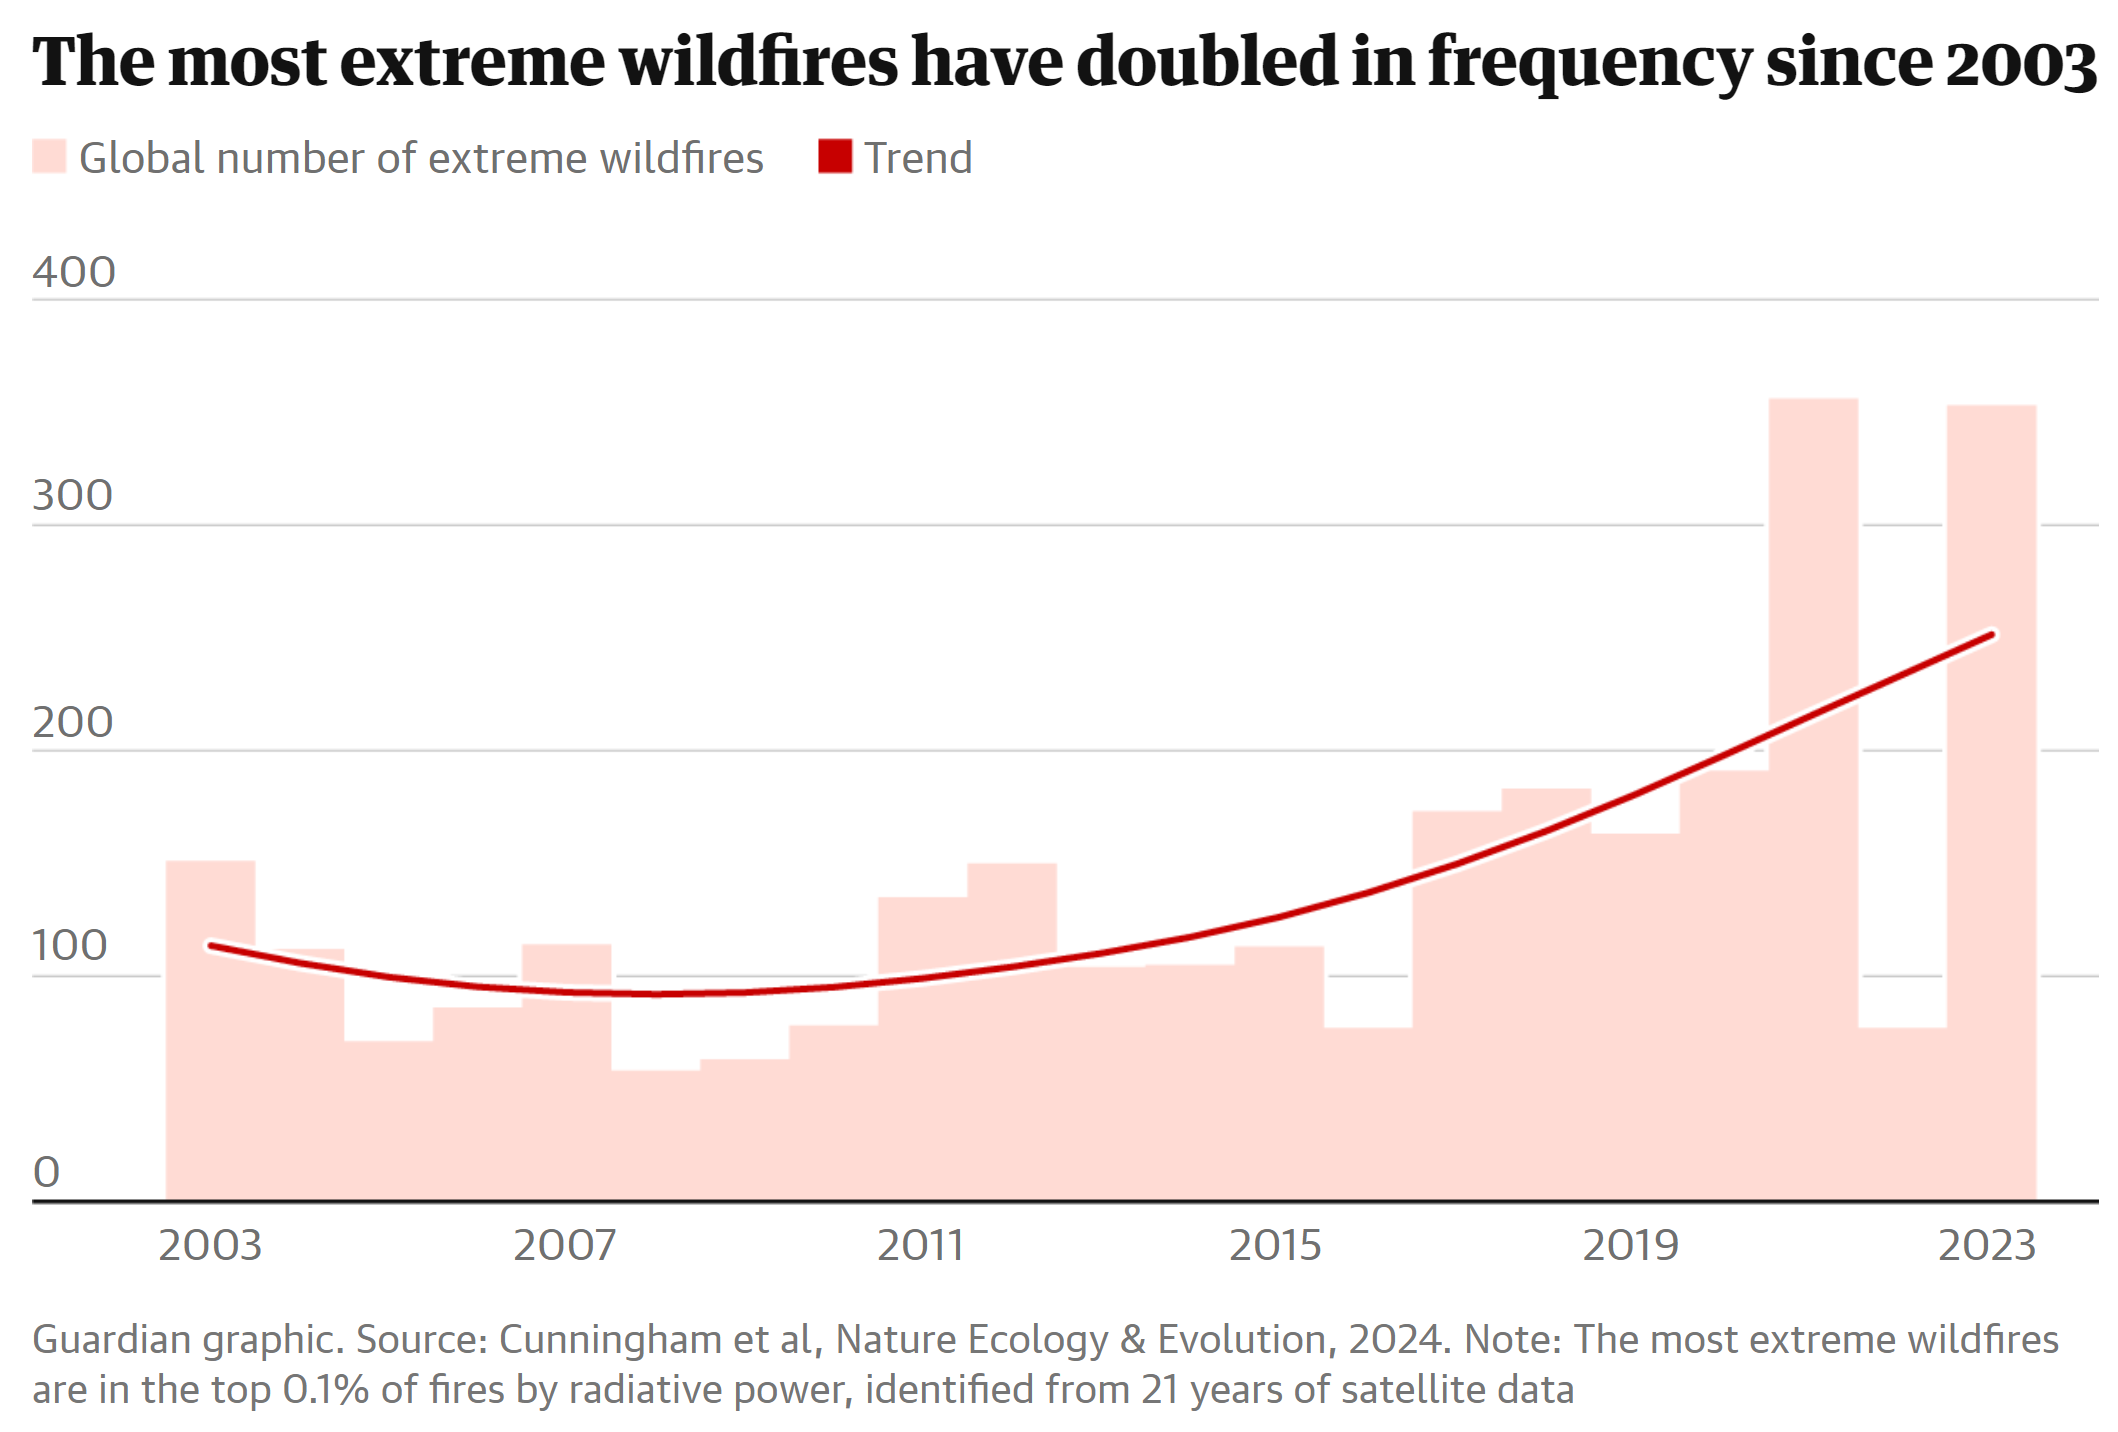
By Damian Carrington 24 June 2024 (The Guardian) – The climate crisis is driving an exponential rise in the most extreme wildfires in key regions around the world, research has revealed. The wildfires can cause catastrophic loss of human life, property and wildlife and cause billions of dollars of damage. Scientists say this is climate […]
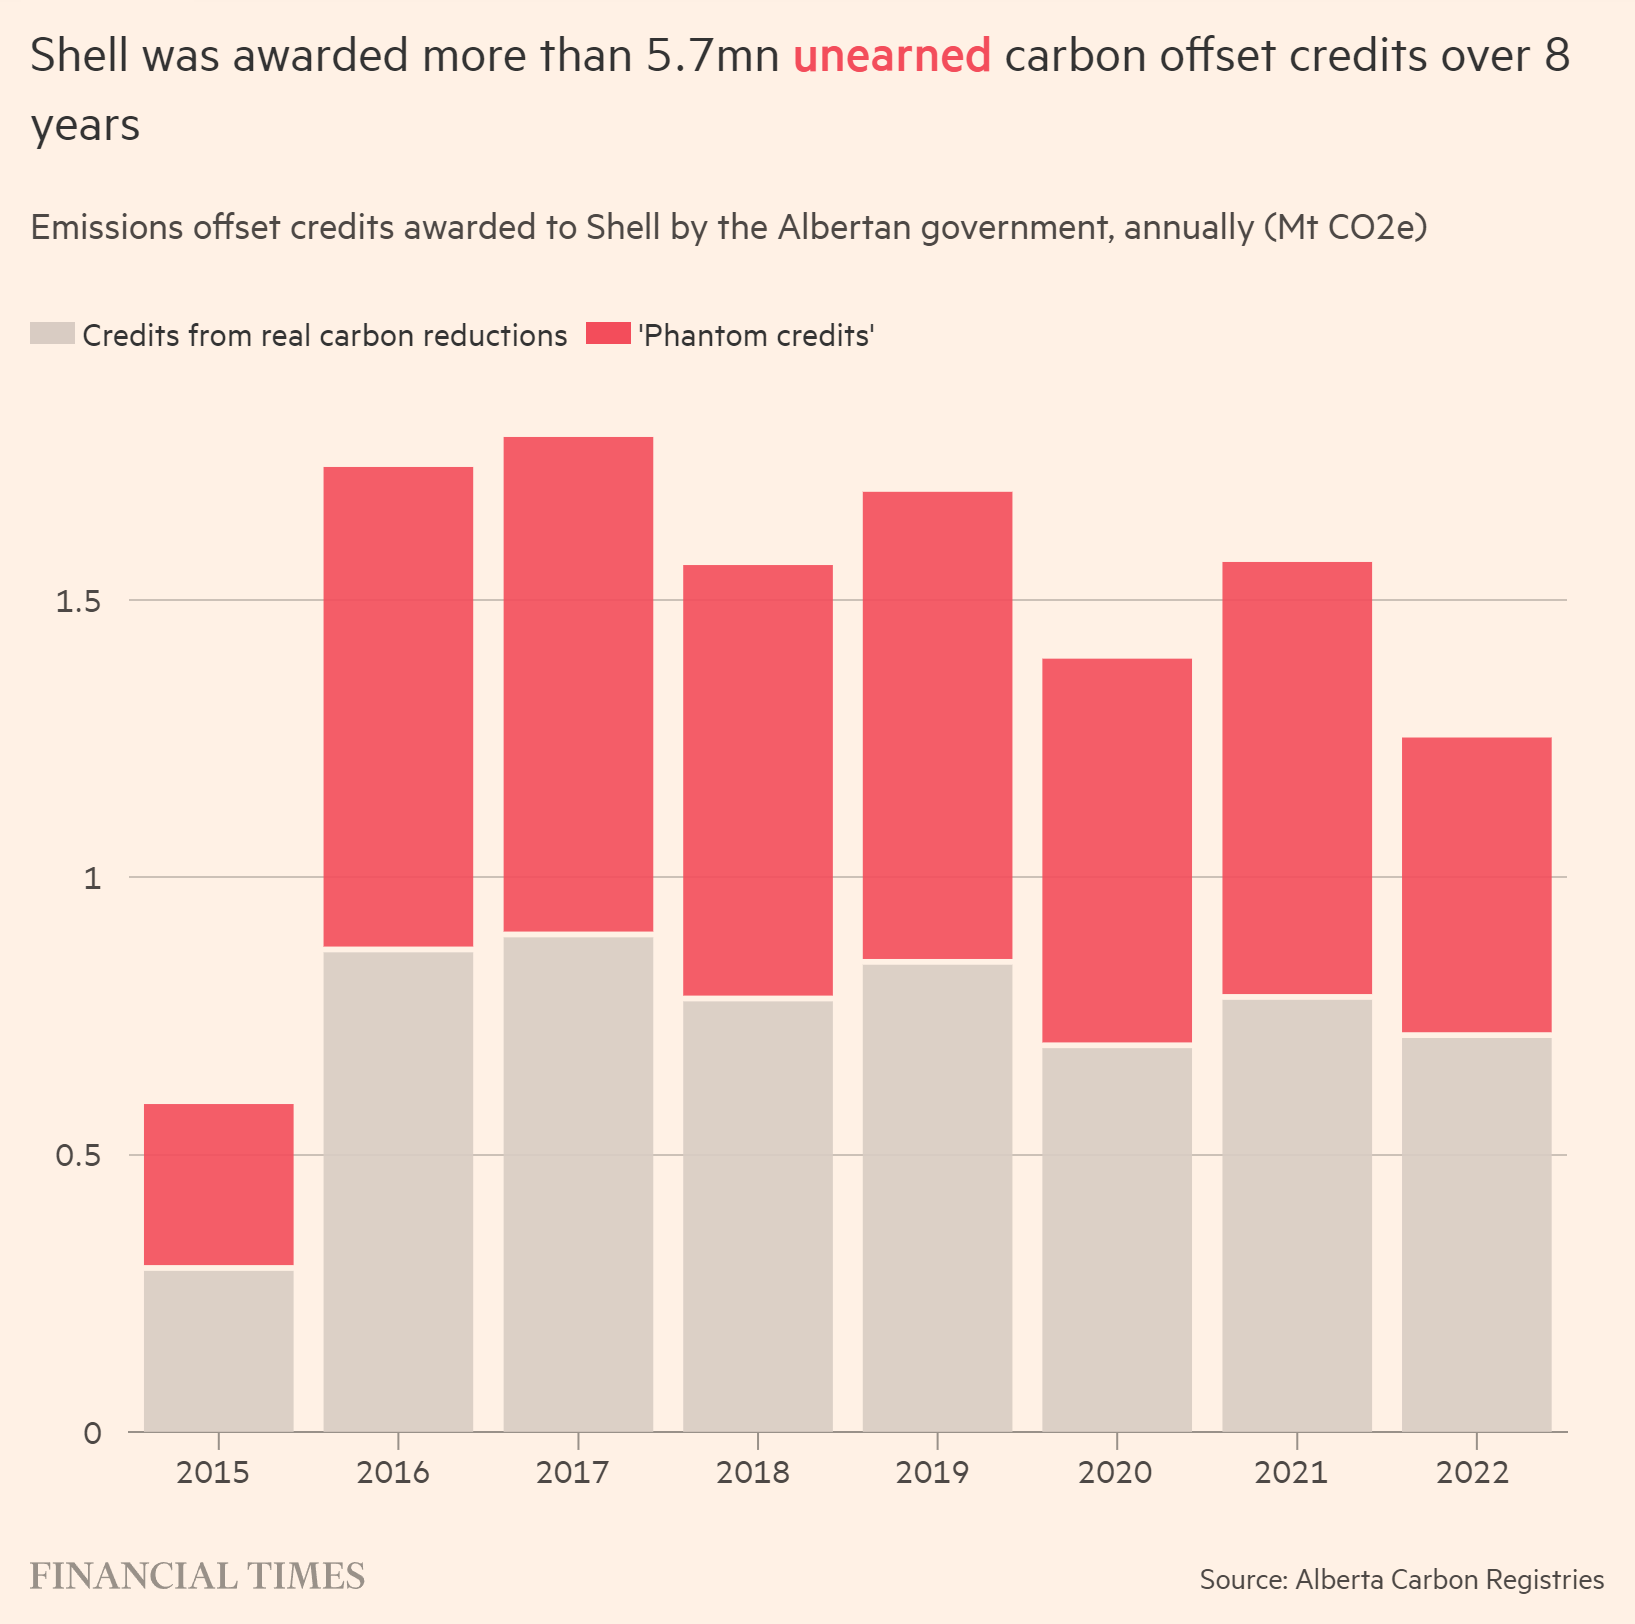
By Kenza Bryan and Clara Murray 4 May 2024 LONDON (Financial Times) – A Shell-operated plant reported millions of carbon credits tied to CO₂ removal that never took place but were used by Canada’s largest oil sands companies, raising new doubts about a technology seen as crucial to mitigating greenhouse gas emissions. As part of […]
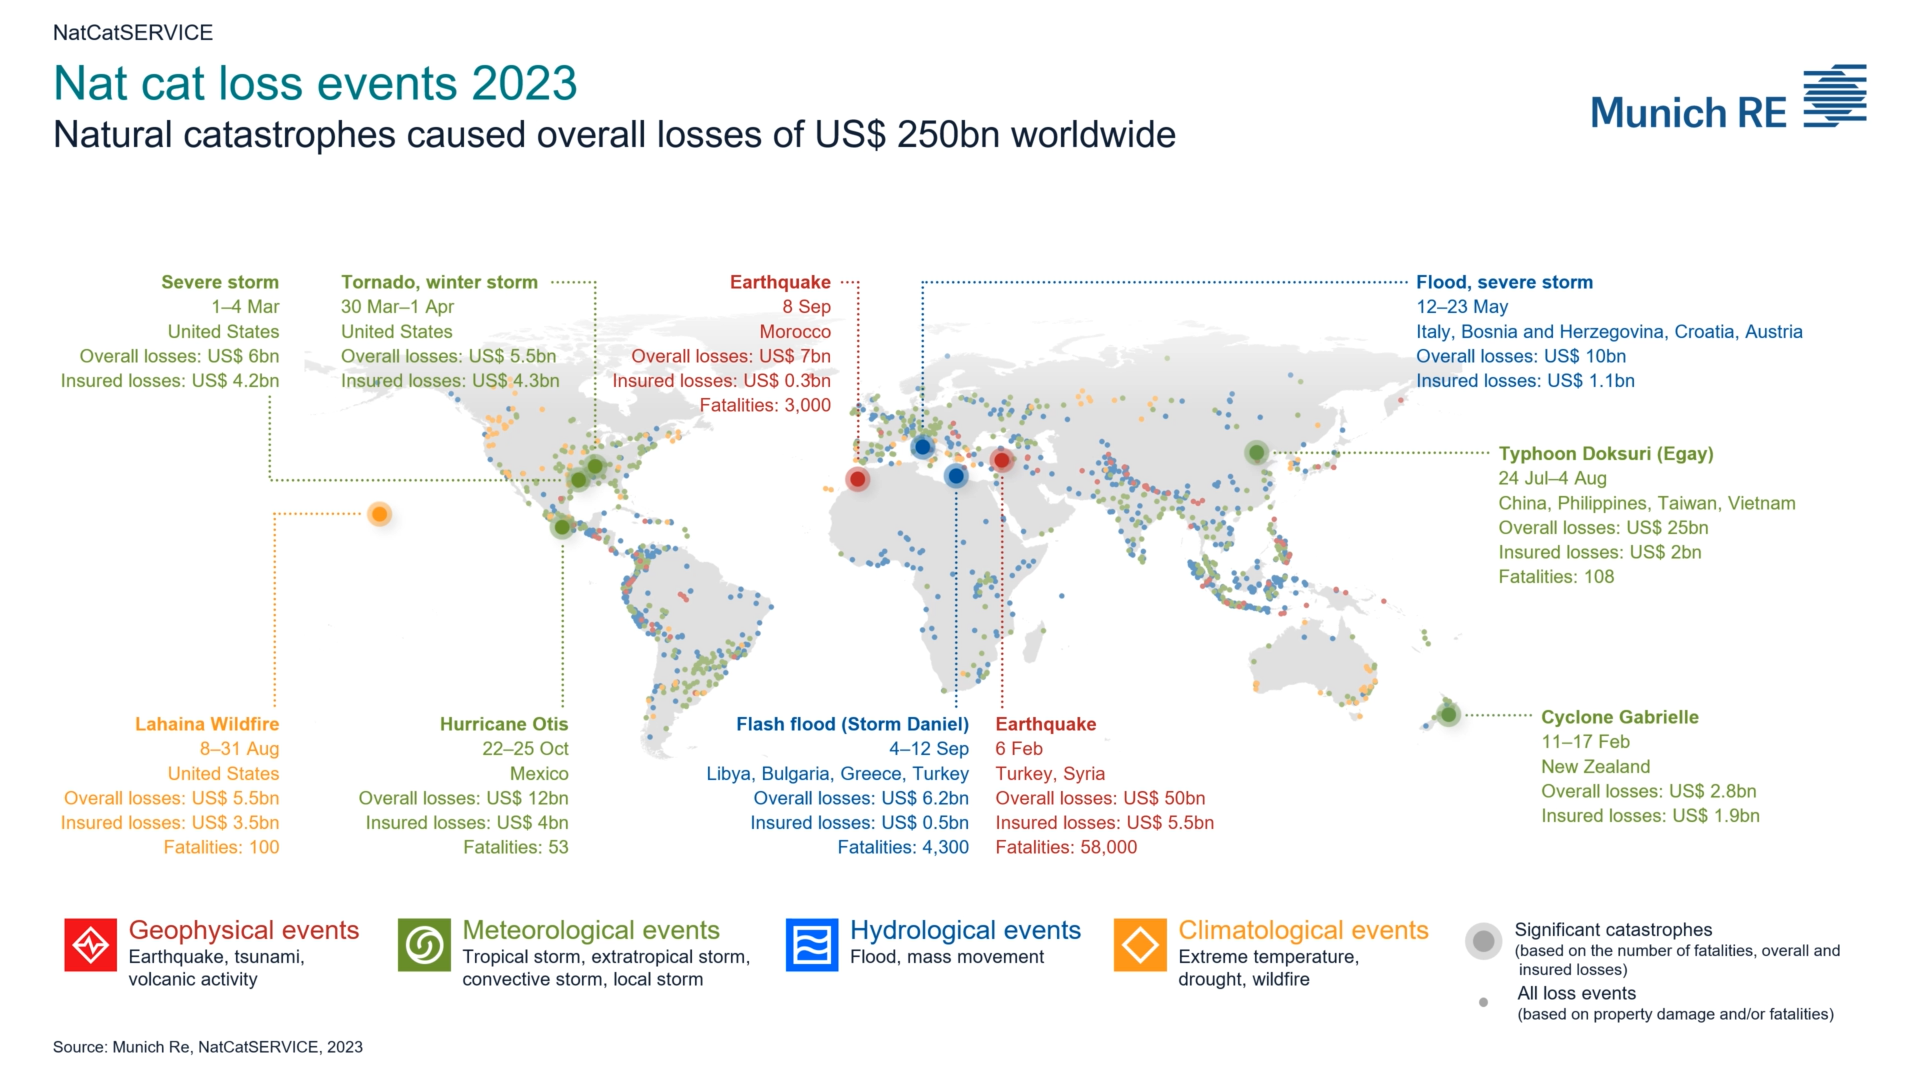
9 January 2024 (Munich Re) – Worldwide, natural disasters in 2023 resulted in losses of around US$ 250bn (previous year US$ 250bn), with insured losses of US$ 95bn (previous year US$ 125bn). Overall losses tally with the five-year average, while insured losses were slightly below the average figure of US$ 105bn. Unlike in previous years, […]
By Sara-Lena Brännström 17 April 2024 (Umeå University) – A team of over 70 scientists from different countries used so called open-top chambers (OTCs) to experimentally simulate the effects of warming on 28 tundra sites around the world. OTCs basically serve as mini-greenhouses, blocking wind and trapping heat to create local warming. The warming experiments […]
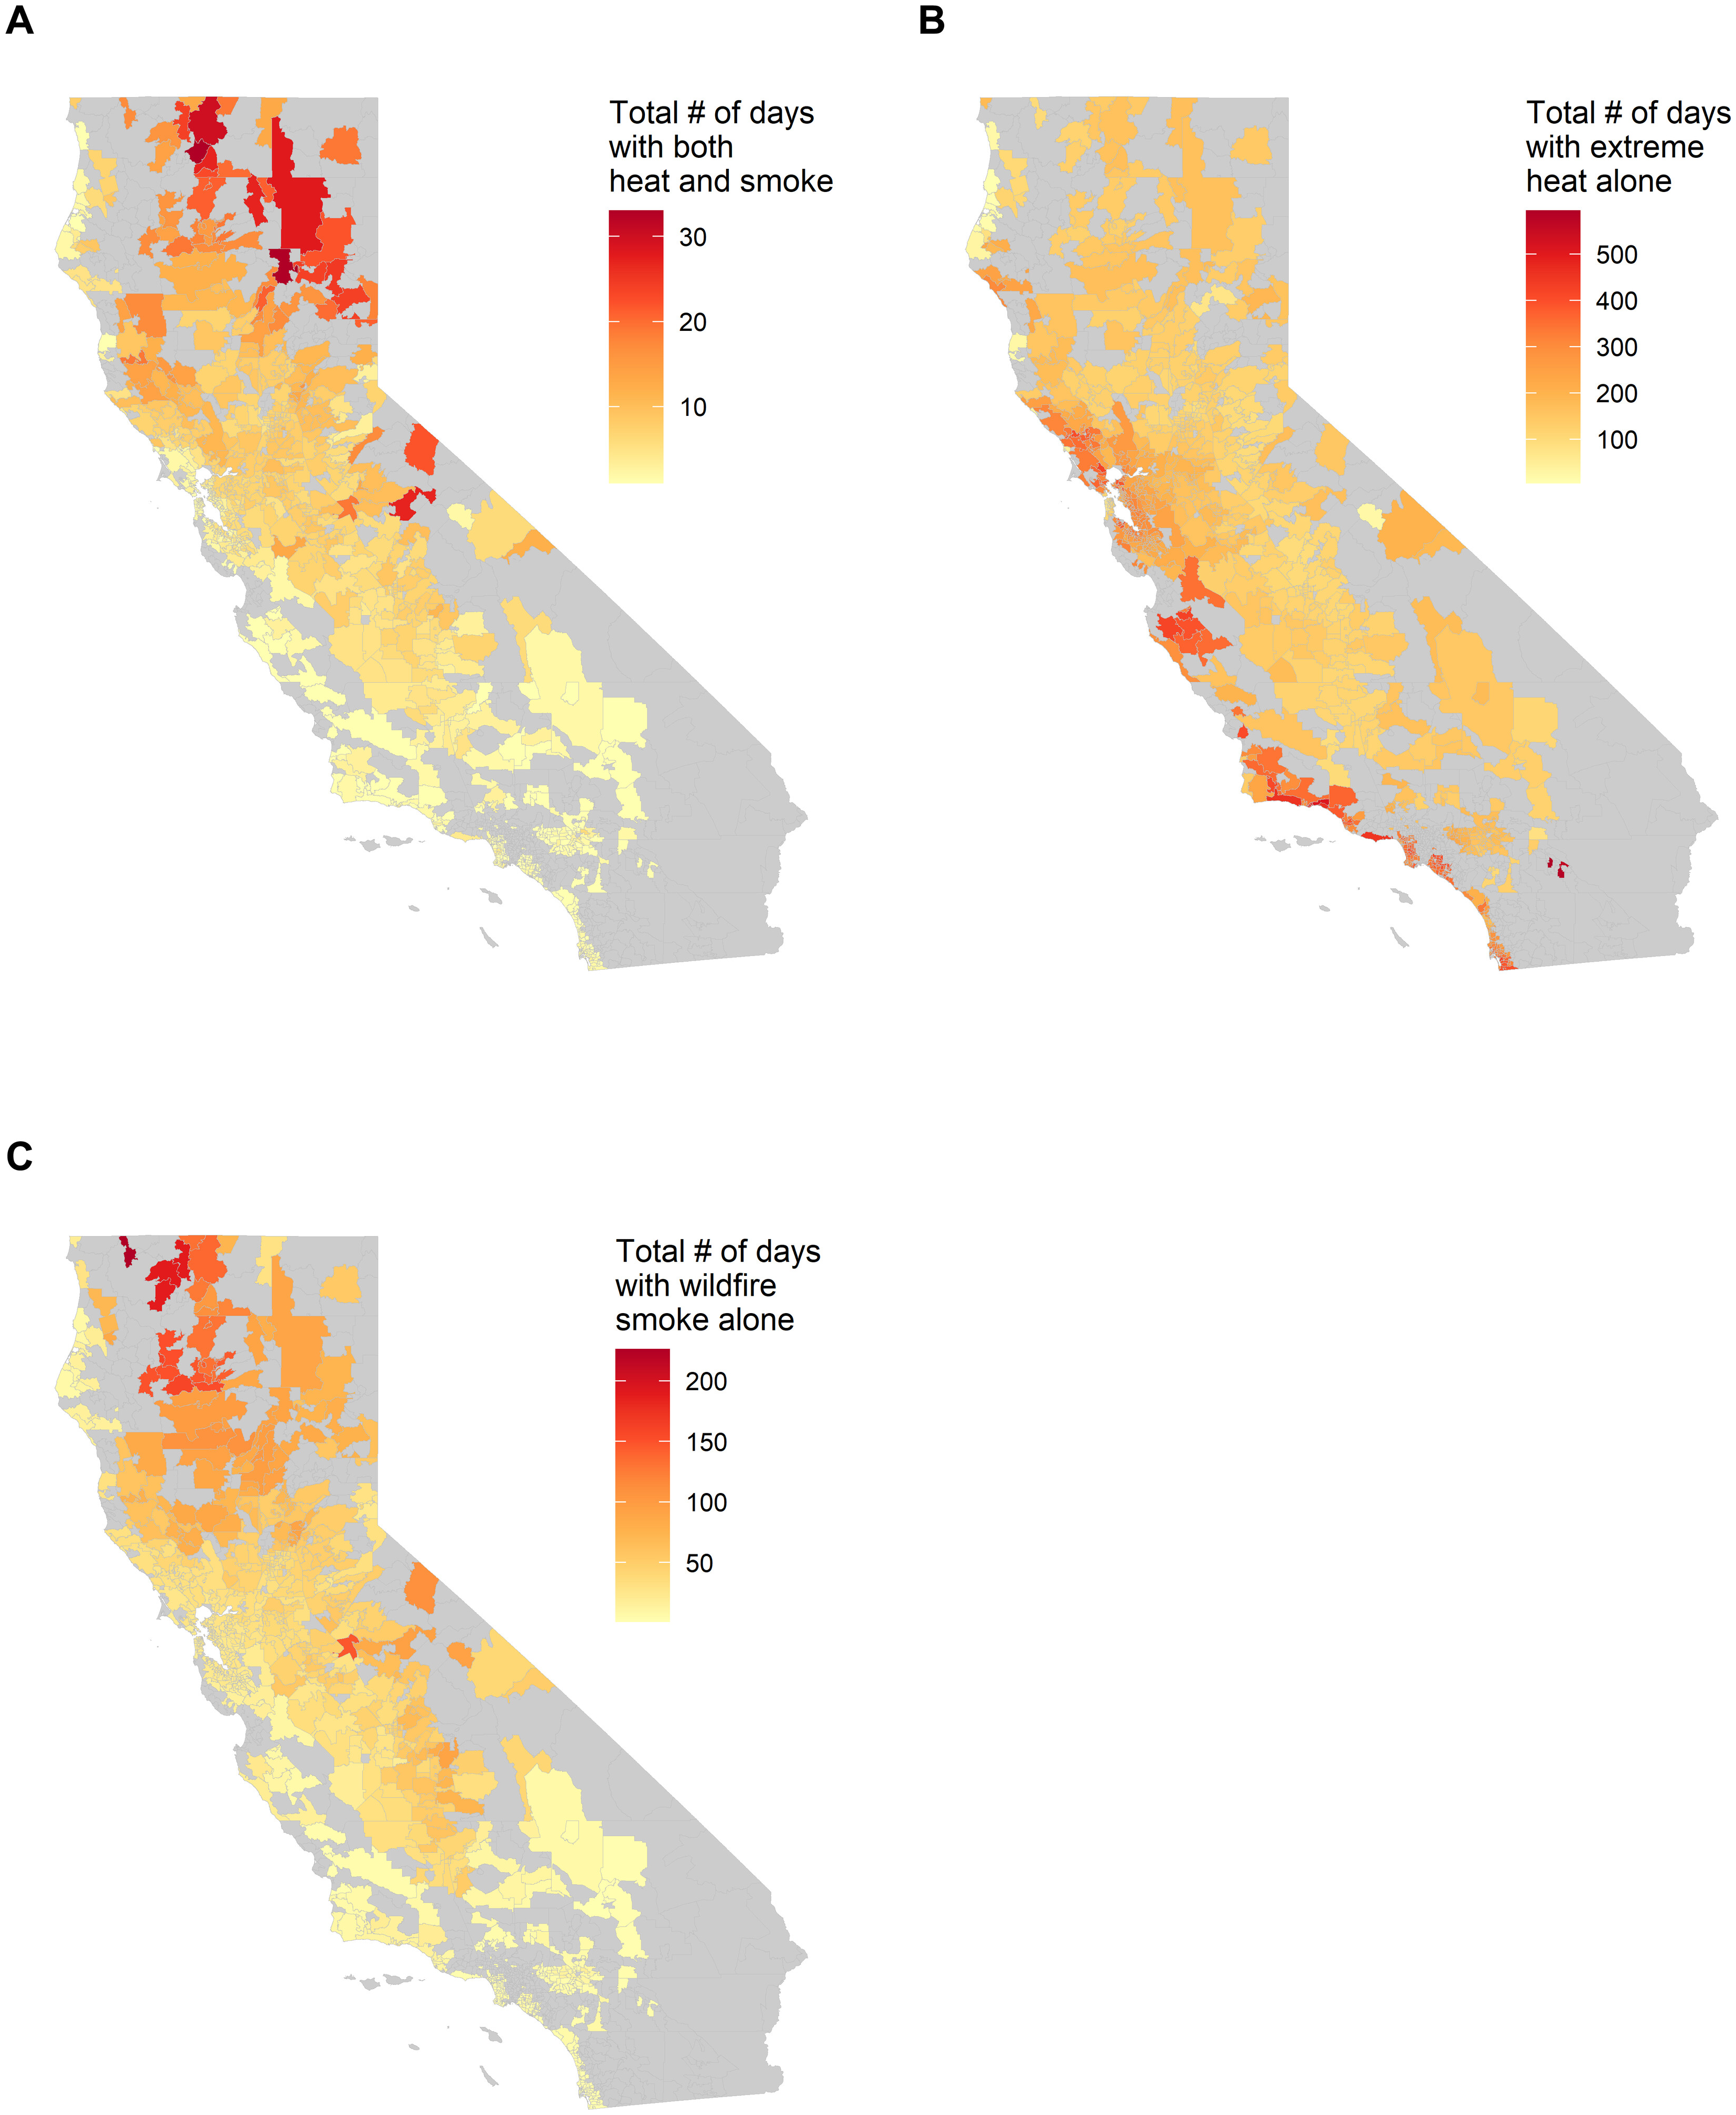
By Dorany Pineda 2 February 2024 LOS ANGELES (AP) – Extreme heat and wildfire smoke are independently harmful to the human body, but together their impact on cardiovascular and respiratory systems is more dangerous and affects some communities more than others. A study published Friday in the journal Science Advances said climate change is increasing the frequency […]
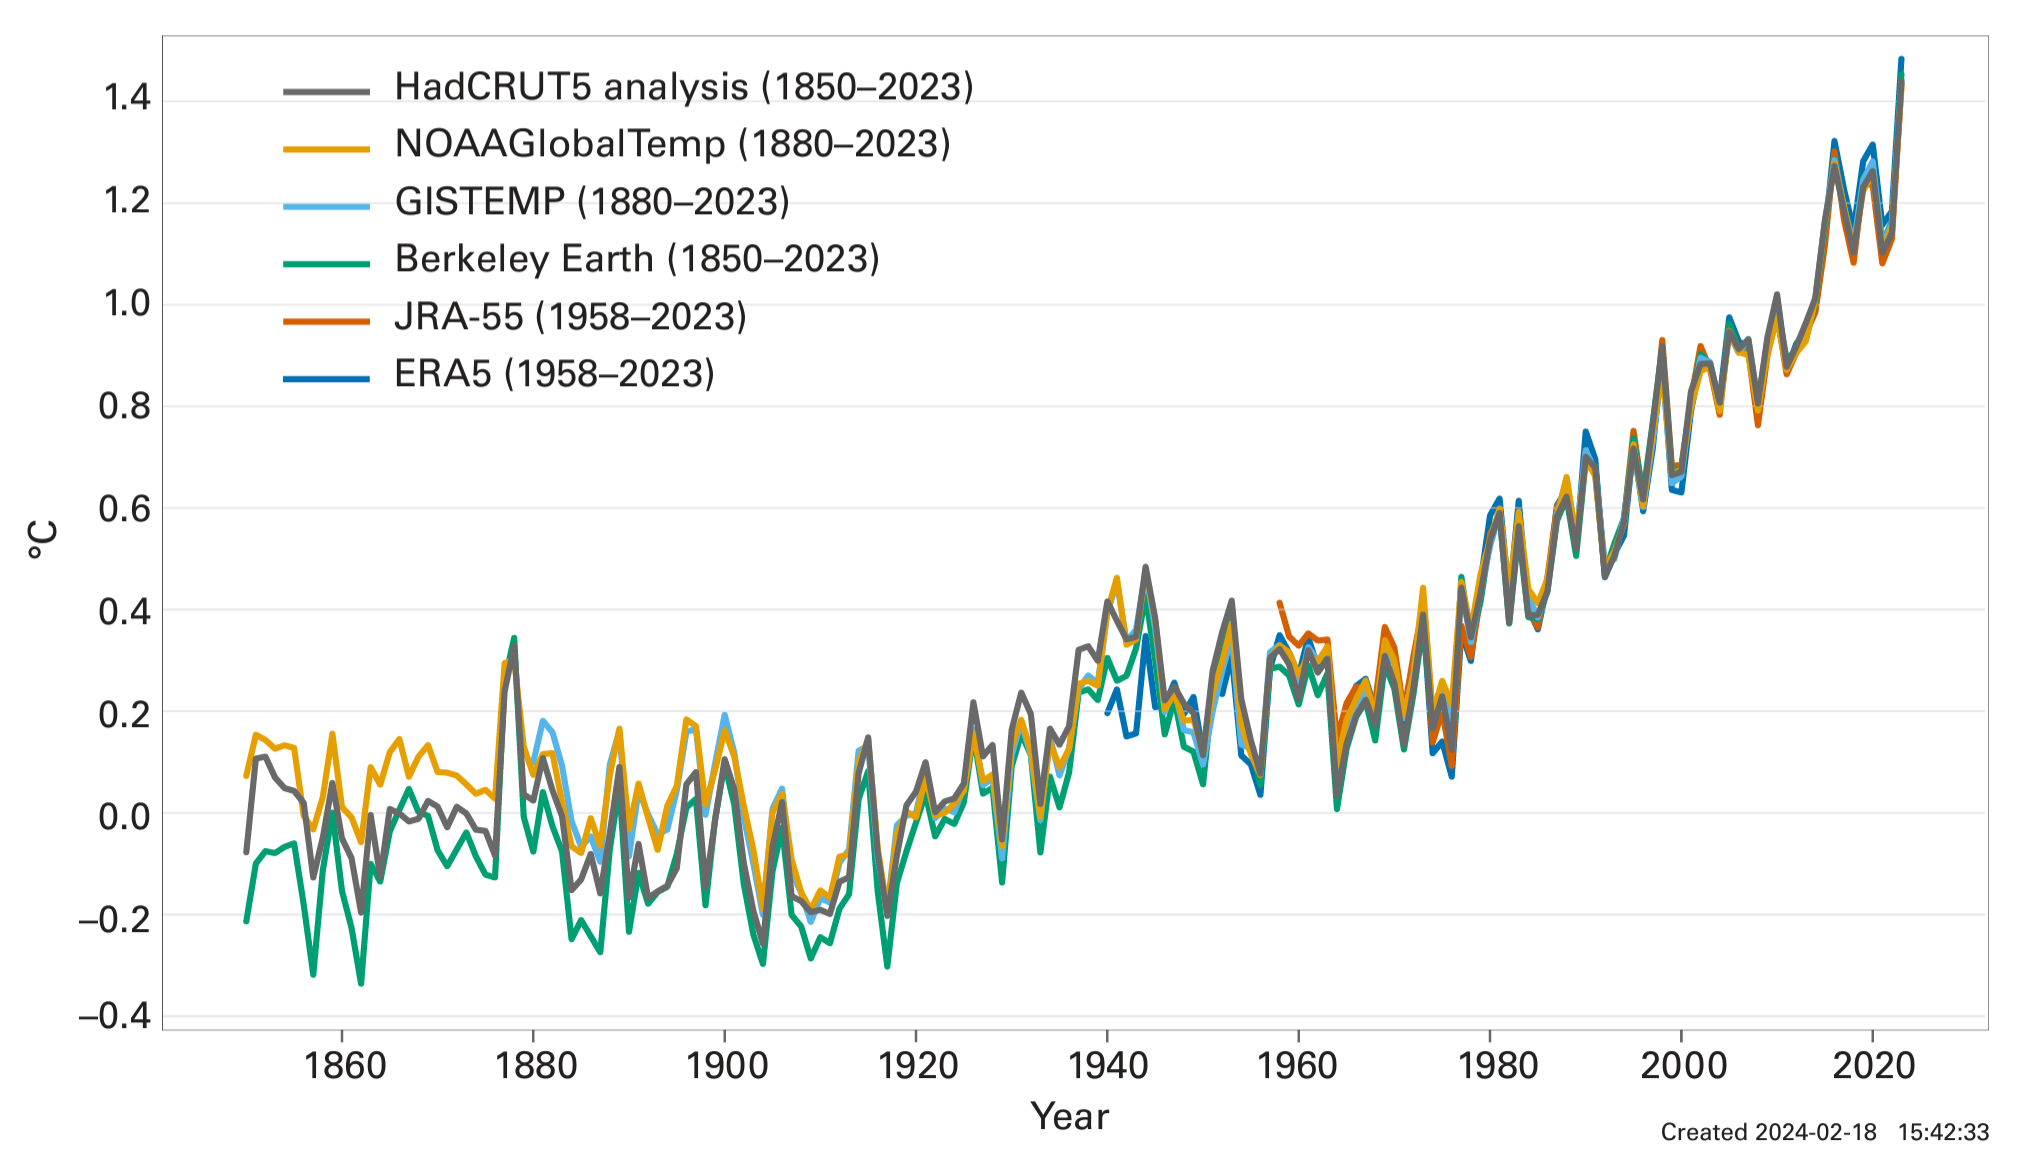
19 March 2024 (WMO) – A new report from the World Meteorological Organization (WMO) shows that records were once again broken, and in some cases smashed, for greenhouse gas levels, surface temperatures, ocean heat and acidification, sea level rise, Antarctic sea ice cover and glacier retreat. Heatwaves, floods, droughts, wildfires, and rapidly intensifying tropical cyclones […]

![Effects of experimental open-top chamber (OTC) warming on ecosystem respiration (ER). Experimental warming increased ER across the tundra biome but the magnitude of the response varied across time and space. Effect of OTC warming on ER Hedges’ SMD calculated as (mean ER of the warmed plots − mean ER of the control plots)/pooled standard deviation across the 136 growing season datasets (that is, unique experiment × ER measurement year combinations). On the top of the graph, a blue diamond shows the mean estimate (est. = 0.57 and 95% CI [0.44–0.70], error bars) of the ER response across the 136 datasets, as well as the Q value testing for heterogeneity and P value from the meta-analysis. Black dots represent ER Hedges’ SMDs of individual datasets and 95% CIs (black error bars) in alphabetical and chronological order. Individual datasets are represented by the experiment ID in black (left) and ER measurement year (right) in a colour scale ranging from dark blue, light blue, orange to red which represents increasingly longer warming duration at the time of ER measurements. Experiments with more than 1 year of ER data are grouped. See Supplementary Tables 1, 2 and 4 for details on the datasets and SMD and CI values. The black dashed vertical line (SMD = 0) represents no change in ER with warming whereas the areas to the right and left of it represent increased (SMD > 0) versus decreased (SMD](https://desdemonadespair.net/wp-content/uploads/2024/04/image-47.png)