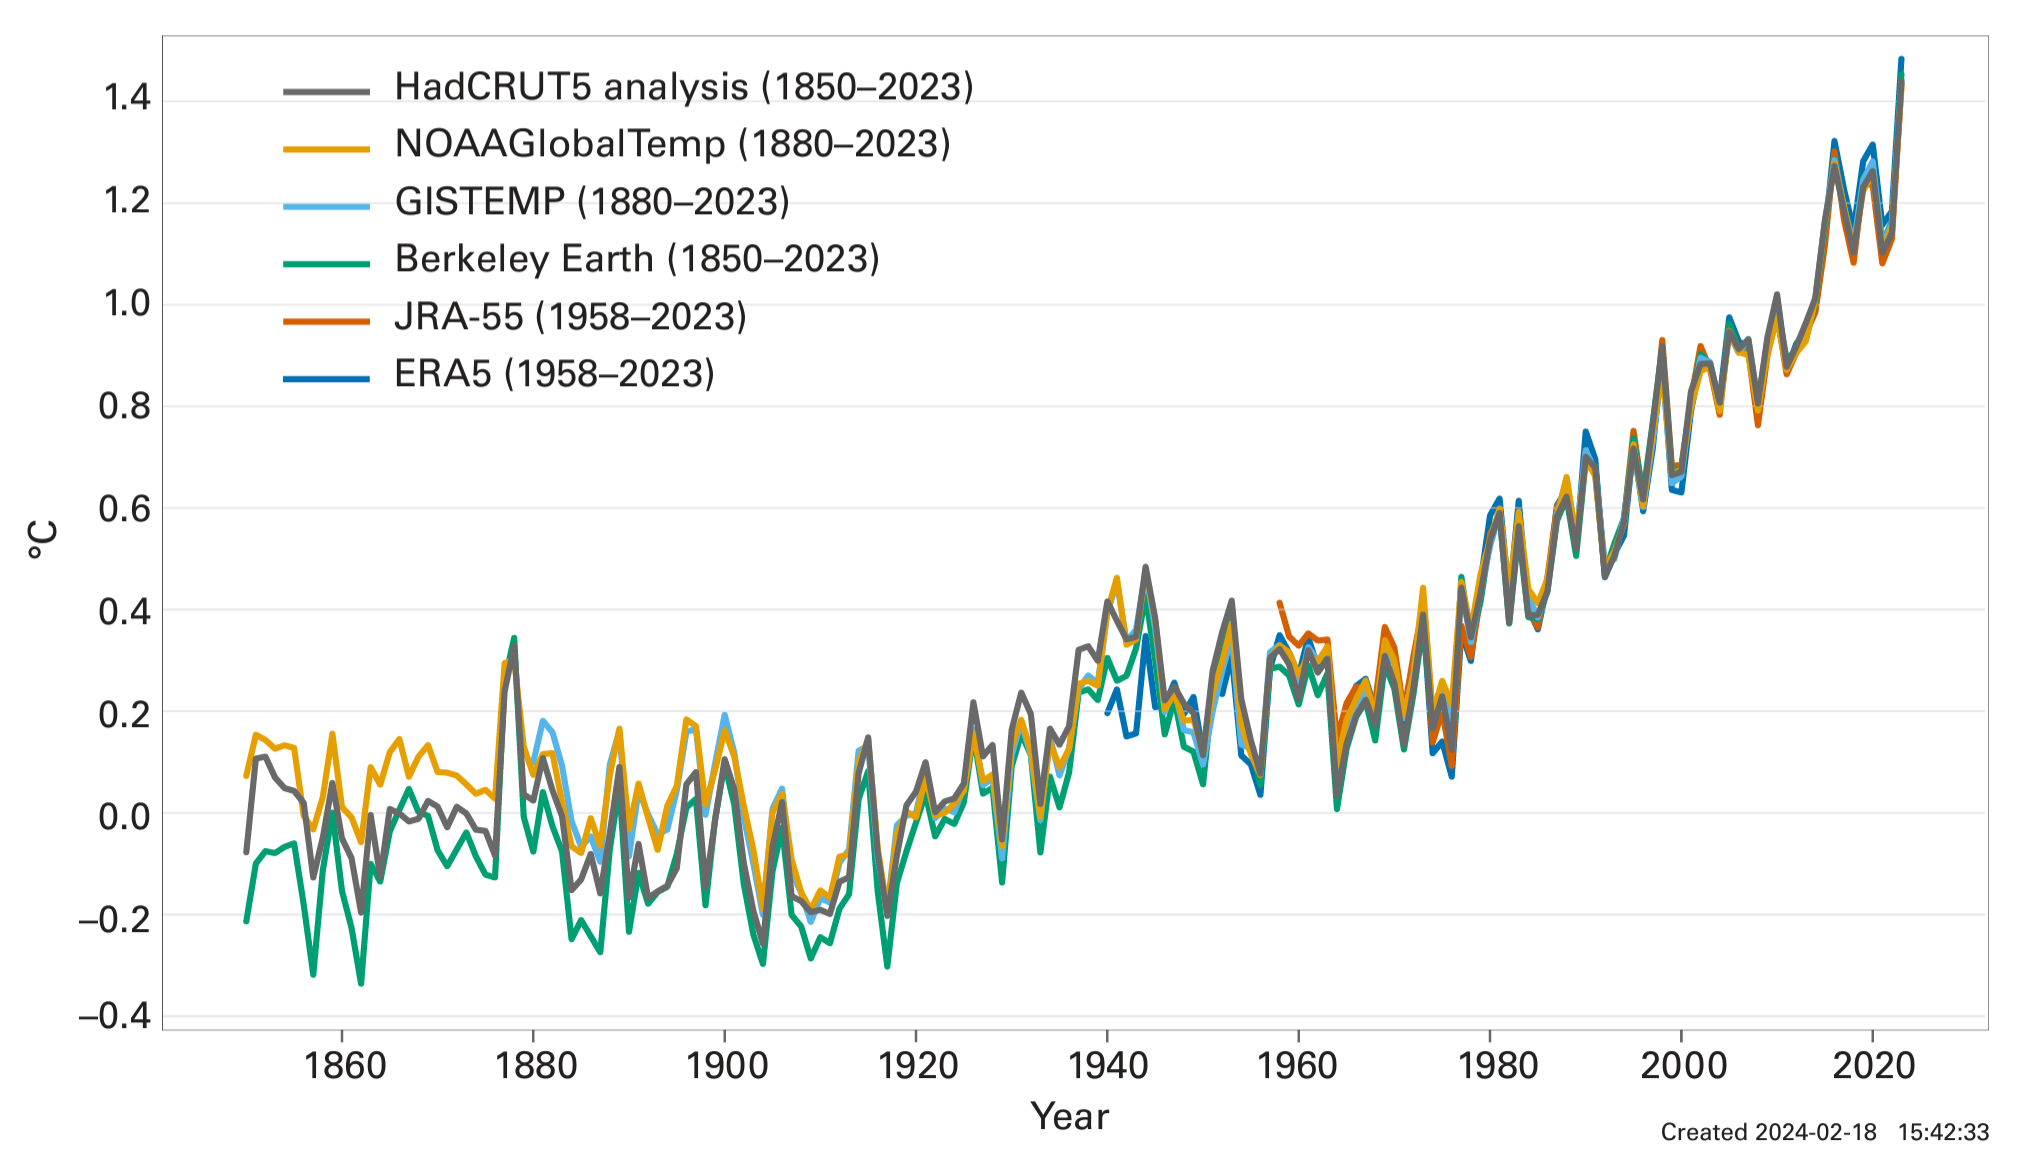
(a) Linear trends in sea surface temperature (SST) (°C per decade) over the period 1982–2022. (b) Area-averaged time series of SST anomalies (°C) relative to the 1982–2022 reference period for the areas indicated in grey dashed lines in 5(a). Source: Derived from the Copernicus Marine Service remote sensing products available at https://doi.org/10.48670/moi-00168 (for 1982–2021) and https://doi.org/10.48670/moi-00165 (for 2022). Graphic: WMO

Pacific island sea levels rising faster than global average, WMO says – Economic damage in Southwest Pacific due to flooding in 2022 was $8.5 billion, almost triple compared to the previous year

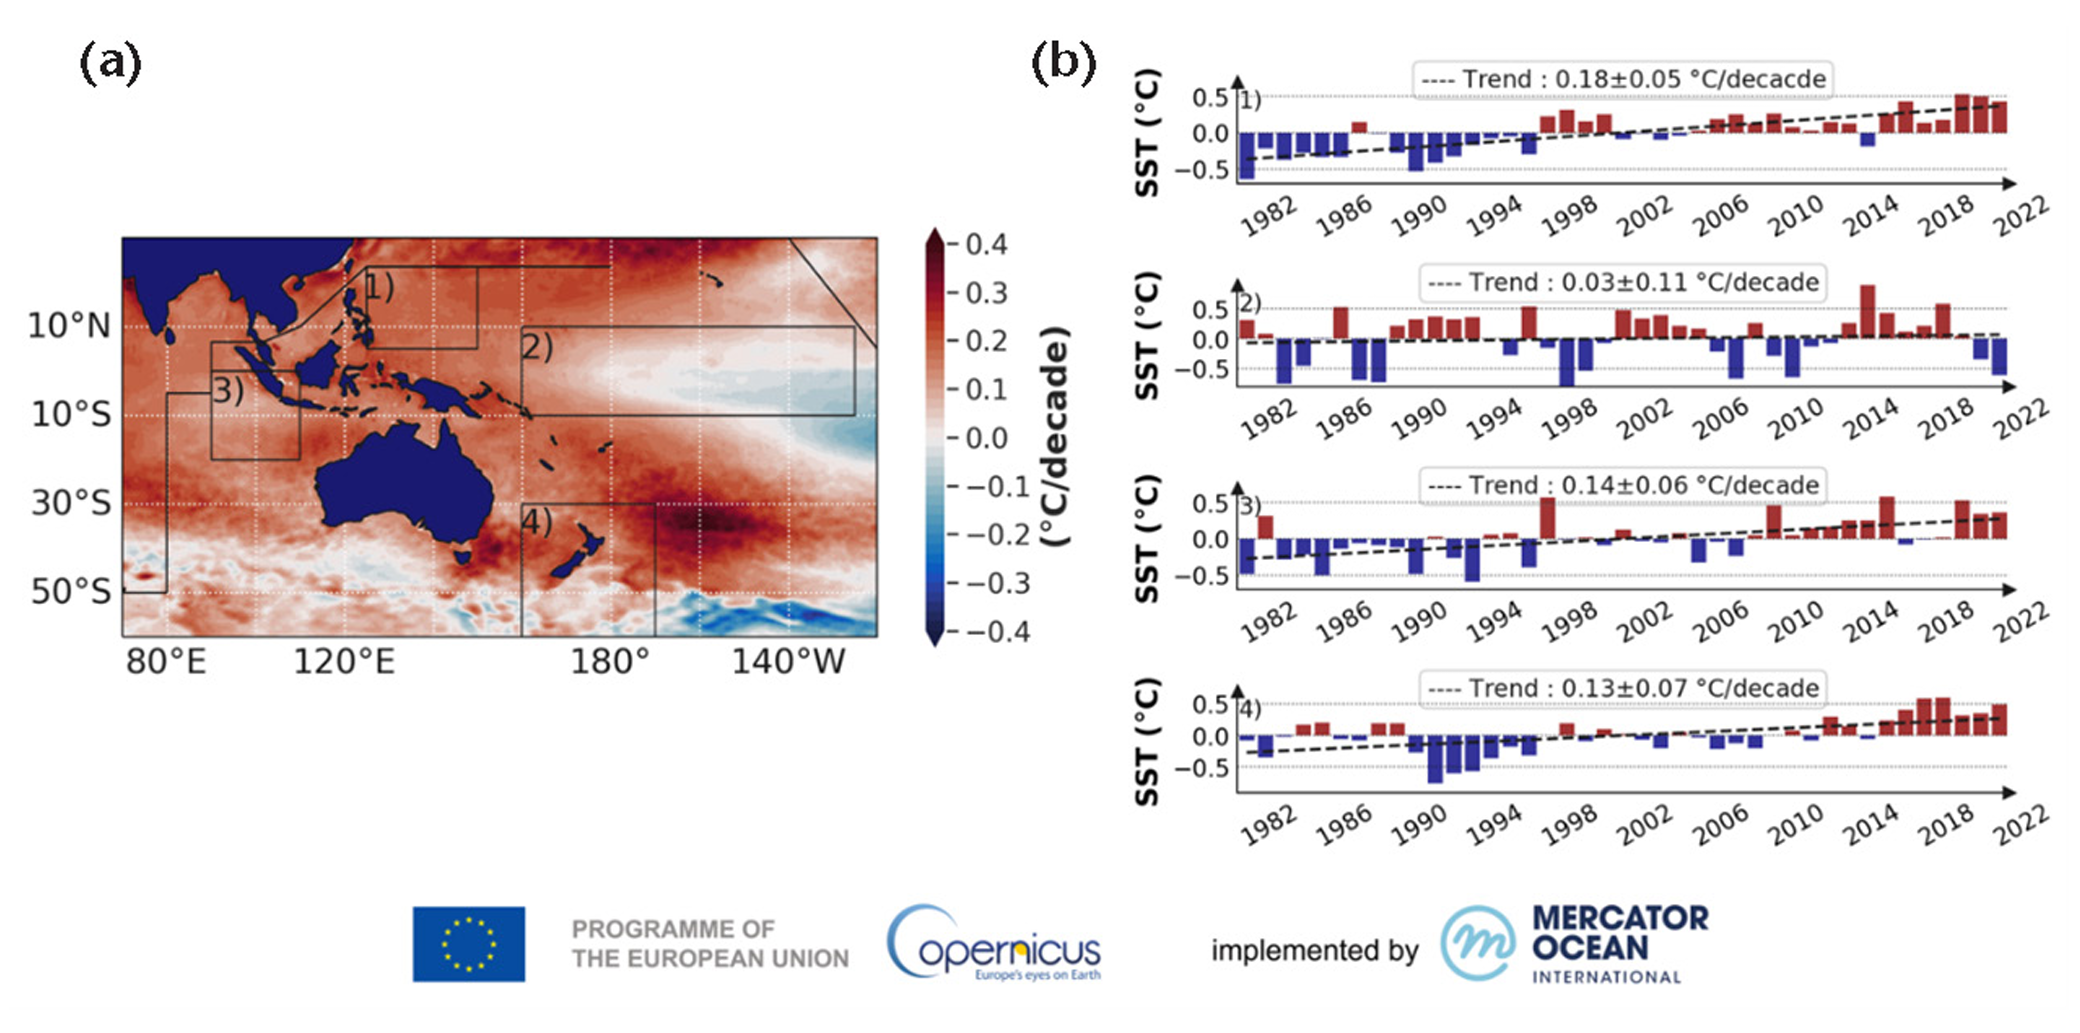
By Gabrielle Tétrault-Farber 17 August 2023 GENEVA (Reuters) – Sea levels in the South-West Pacific are rising faster than the global average, threatening low-lying islands while heat damages marine ecosystems, the U.N. meteorological agency said on Friday. In its State of the Climate in the South-West Pacific 2022 report, the World Meteorological Organization (WMO) said […]

Global annual mean temperature anomalies with respect to pre-industrial conditions (1850-1900) for six global temperature data sets (1850-2022). Graphic: WMO

WMO annual report highlights continuous advance of climate change – “While greenhouse gas emissions continue to rise and the climate continues to change, populations worldwide continue to be gravely impacted by extreme weather and climate events”

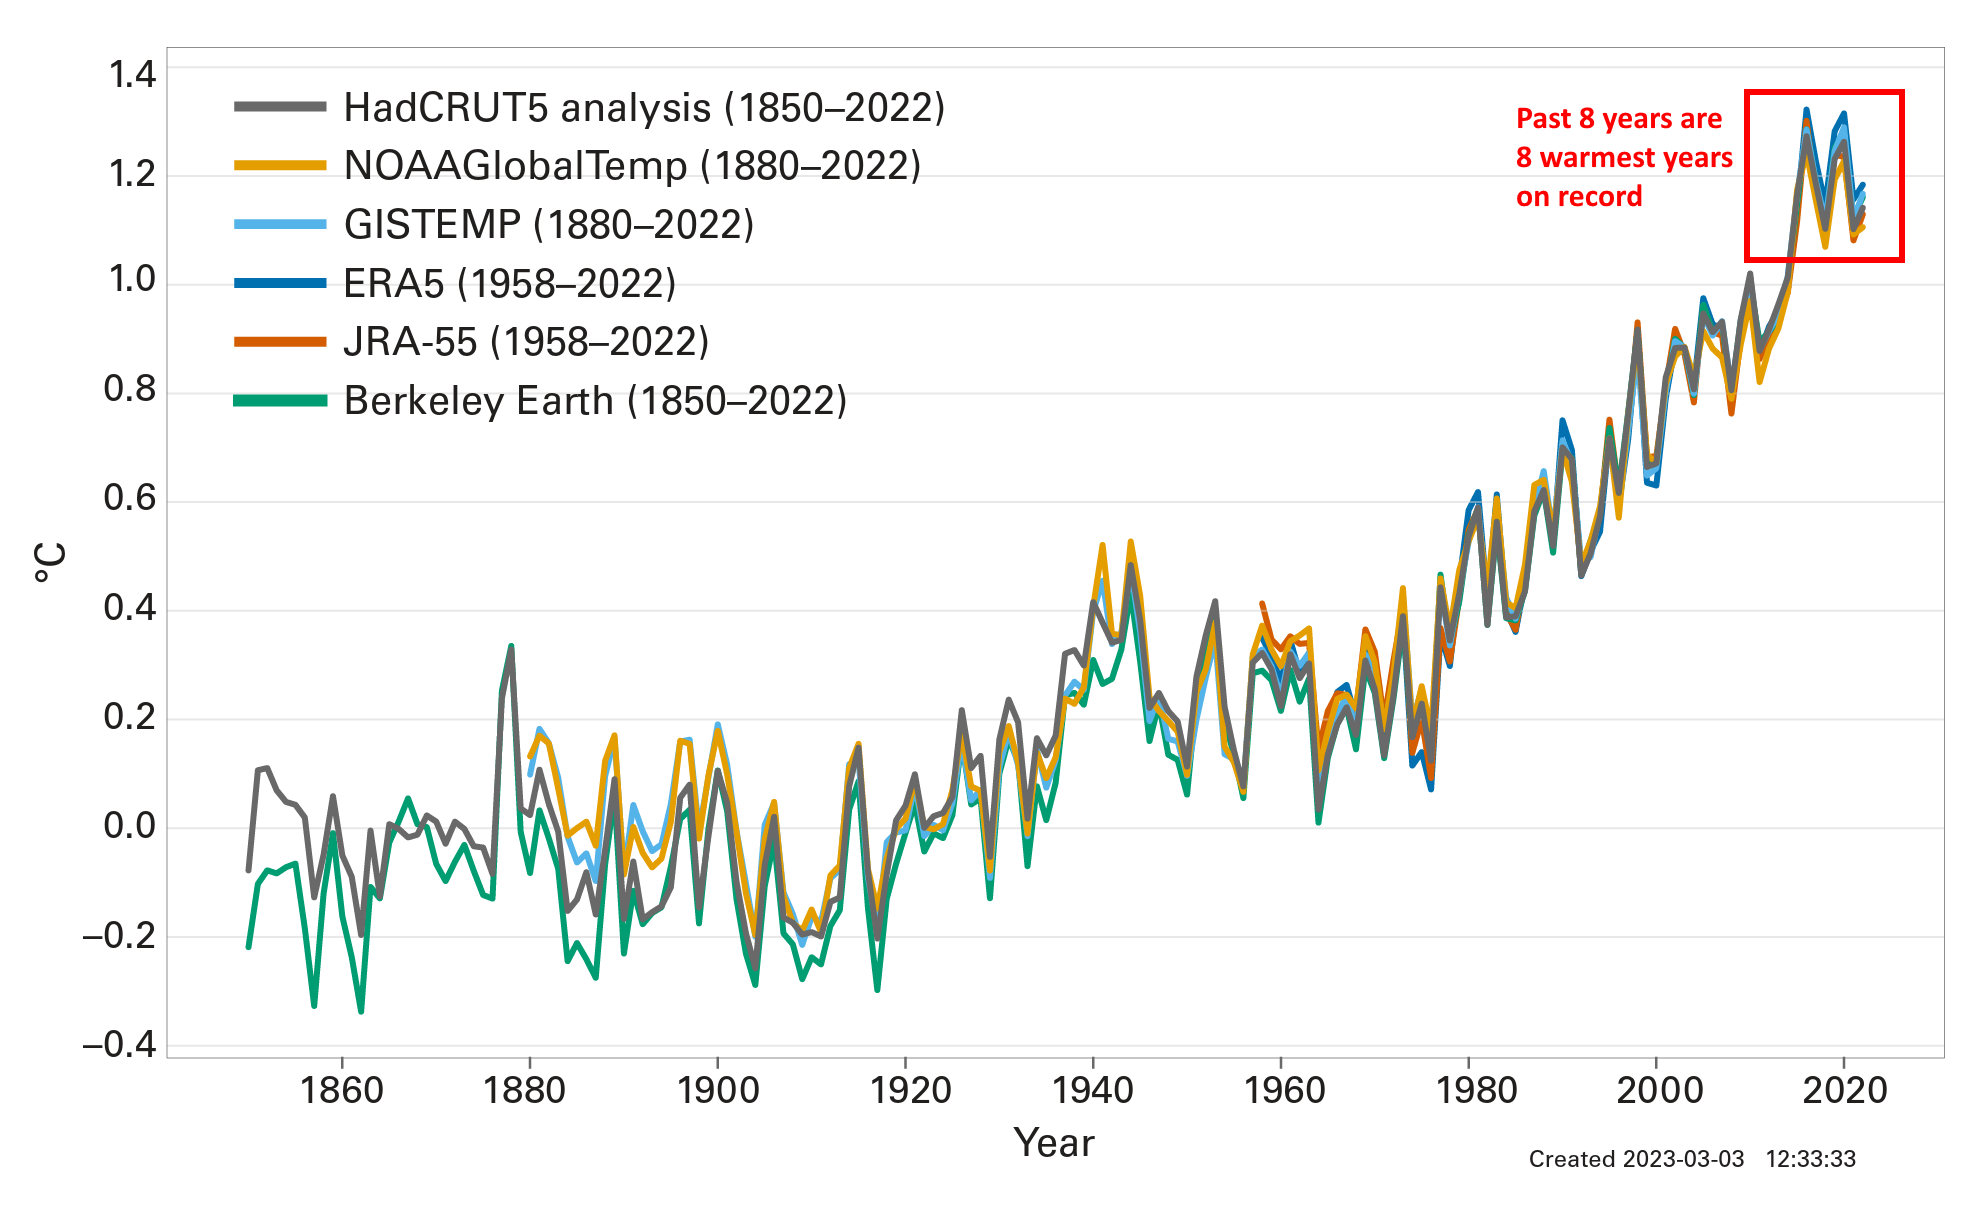
Geneva, 21 April 2023 (WMO) – From mountain peaks to ocean depths, climate change continued its advance in 2022, according to the annual report from the World Meteorological Organization (WMO). Droughts, floods, and heatwaves affected communities on every continent and cost many billions of dollars. Antarctic sea ice fell to its lowest extent on record […]

Global map showing the highest marine heatwave (MHW) category experienced at each pixel in 2021 (reference period 1982–2011). Light grey indicates that no MHW occurred in a pixel over the entire year. (b) Stacked bar plot showing the percentage of the surface of the ocean experiencing an MHW on any given day of the year. (c) Stacked bar plot showing the cumulative percentage of the surface of the ocean that experienced an MHW over the year. Note: These values are based on when in the year a pixel first experienced its highest MHW category, so no pixel is counted twice. Horizontal lines in this figure show the final percentages for each category of MHW. (d) Stacked bar plot showing the cumulative number of MHW days averaged over the surface of the ocean. Note: This average is calculated by dividing the cumulative sum of MHW days per pixel weighted by the surface area of those pixels. Data: National Oceanic and Atmospheric Administration Optimum Interpolation Sea Surface Temperature (NOAA OISST). Graphic: Robert Schlegel

WMO: Four key climate change indicators broke records in 2021 – Past seven years have been the warmest seven years on record – “A dismal litany of humanity’s failure to tackle climate disruption”

GENEVA, 18 May 2022 (WMO) – Four key climate change indicators – greenhouse gas concentrations, sea level rise, ocean heat and ocean acidification – set new records in 2021. This is yet another clear sign that human activities are causing planetary scale changes on land, in the ocean, and in the atmosphere, with harmful and […]

(a) Linear sea surface temperature (SST) trend (°C yr-1) for August of each year from 1982 to 2021. The trend is only shown for values that are statistically significant at the 95 percent confidence interval; the region is shaded gray otherwise. White shading is the August 2021 mean sea ice extent, and the yellow line indicates the median ice edge for Aug 1982-2010, (b, c) Area-averaged SST anomalies (°C) for August of each year (1982-2021) relative to the 1982-2010 August mean for (b) Baffin Bay and (c) Chukchi Sea regions shown by blue boxes in (a). The dotted lines show the linear SST anomaly trends over the period shown and trends in °C yr-1 (with 95 percent confidence intervals) are shown on the plots. Mean August SST warming trends from 1982 to 2021 persist over much of the Arctic Ocean, with statistically significant (at the 95 percent confidence interval) linear warming trends of up to +0.1°C yr-1 (a). Overall, Baffin Bay SSTs are becoming warmer in August with a linear warming trend over 1982-2021 of 0.05 ± 0.01°C yr-1 (b). Similarly, Chukchi Sea August mean SSTs are warming, with a linear trend of 0.06 ± 0.03°C yr-1 (c). Mean August SSTs for the entire Arctic (the Arctic Ocean and marginal seas north of 67° N) exhibit a linear warming trend of 0.03 ± 0.01°C yr-1. Graphic: Timmermans and Labe / NOAA

NOAA’s 2021 Arctic Report Card: Rapid and pronounced warming continues to drive the evolution of the Arctic environment

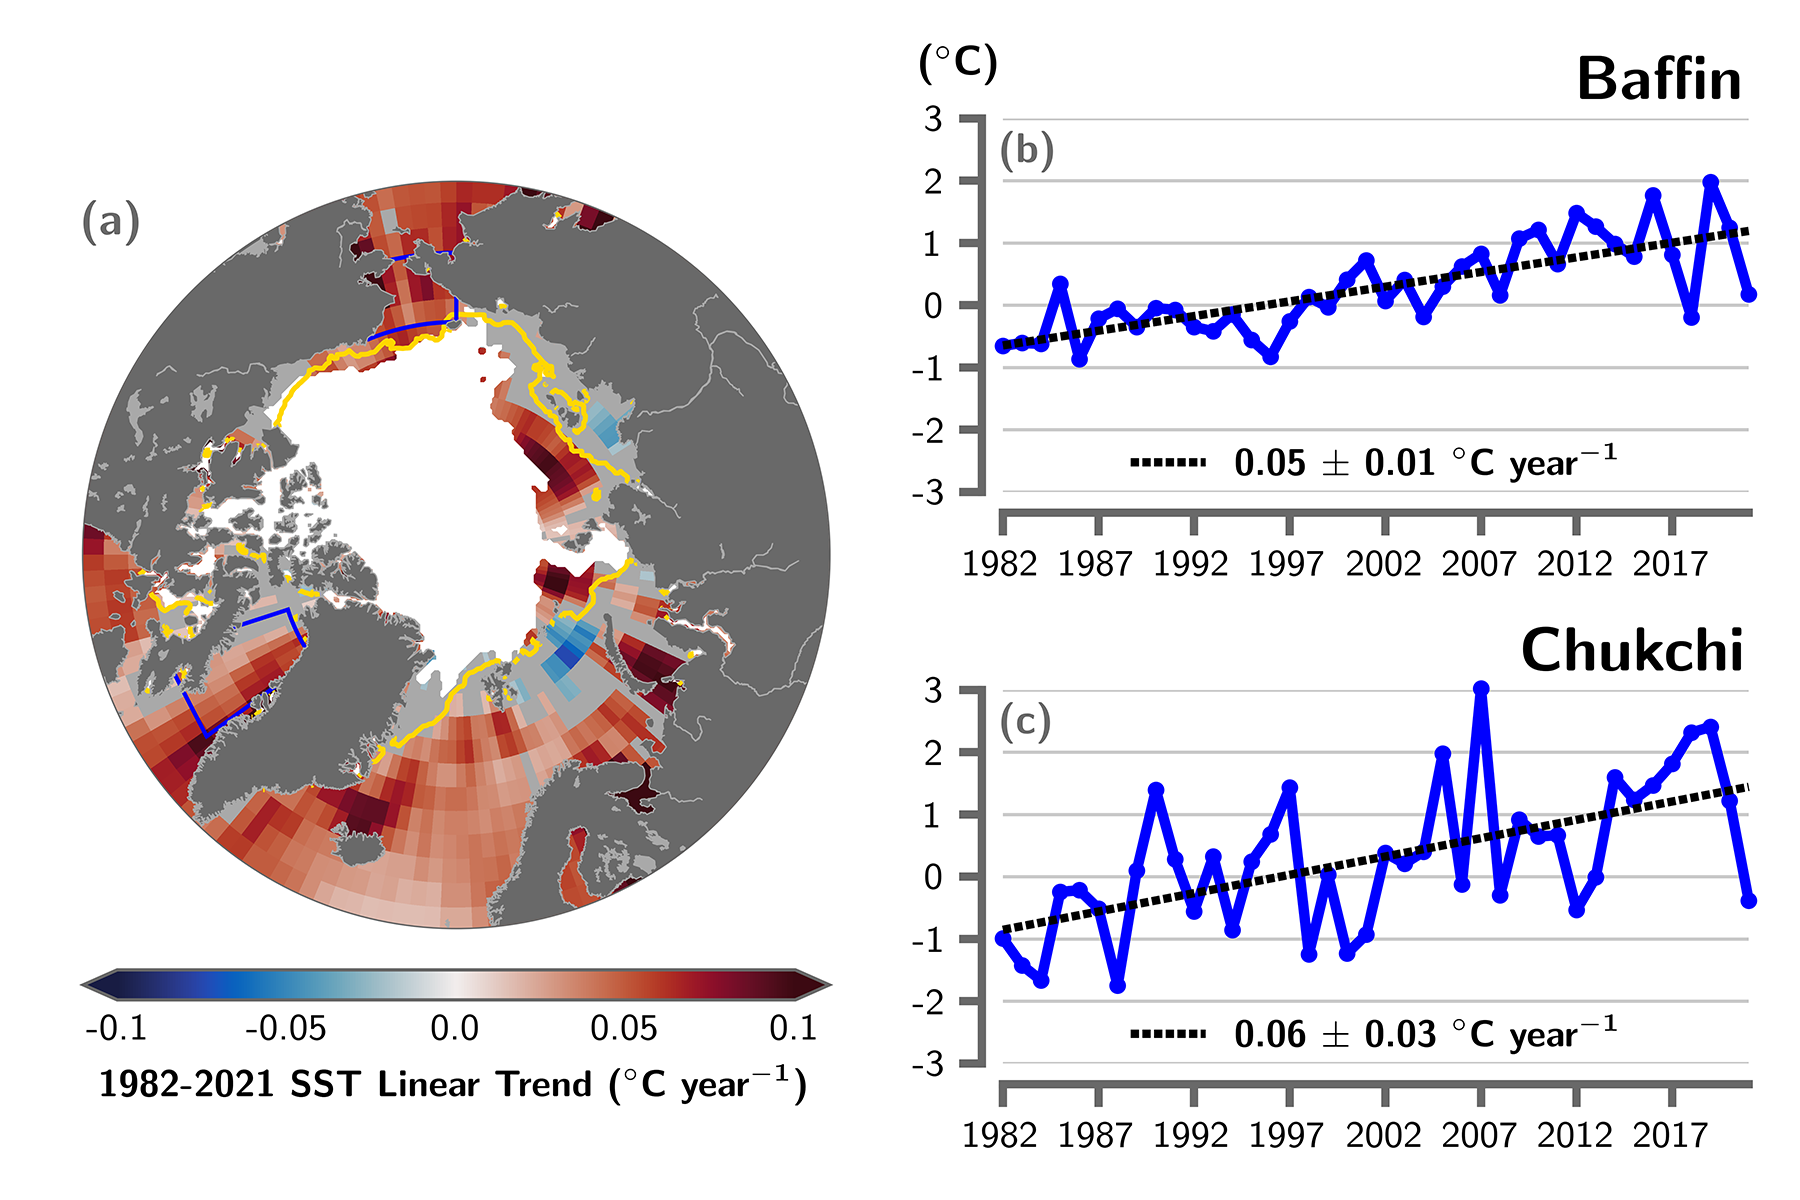
By T. A. Moon, M. L. Druckenmiller, and R. L. Thoman 6 December 2021 (NOAA) – As the influences of human-caused global warming continue to intensify, with the Arctic warming significantly faster than the globe overall, the 2021 Arctic Report Card (ARC2021) brings a broad view of the state of the Arctic climate and environment. […]

Time series of climate-related responses to anthropogenic drivers, 1990-2020. Out of the 31 tracked planetary vital signs, 18 were at new all-time record lows or highs in 2020. Data obtained before and after the publication of Ripple and colleagues (2020) are shown in gray and red respectively. For variables with relatively high variability, local regression trend lines are shown in black. The variables were measured at various frequencies (e.g., annual, monthly, weekly). The labels on the x-axis correspond to midpoints of years. Sources and additional details about each variable are provided in the supplemental material. Graphic: Ripple, et al., 2021 / BioScience

World scientists’ warning of a climate emergency 2021 – Humans face untold suffering from “the consequences of unrelenting business as usual”

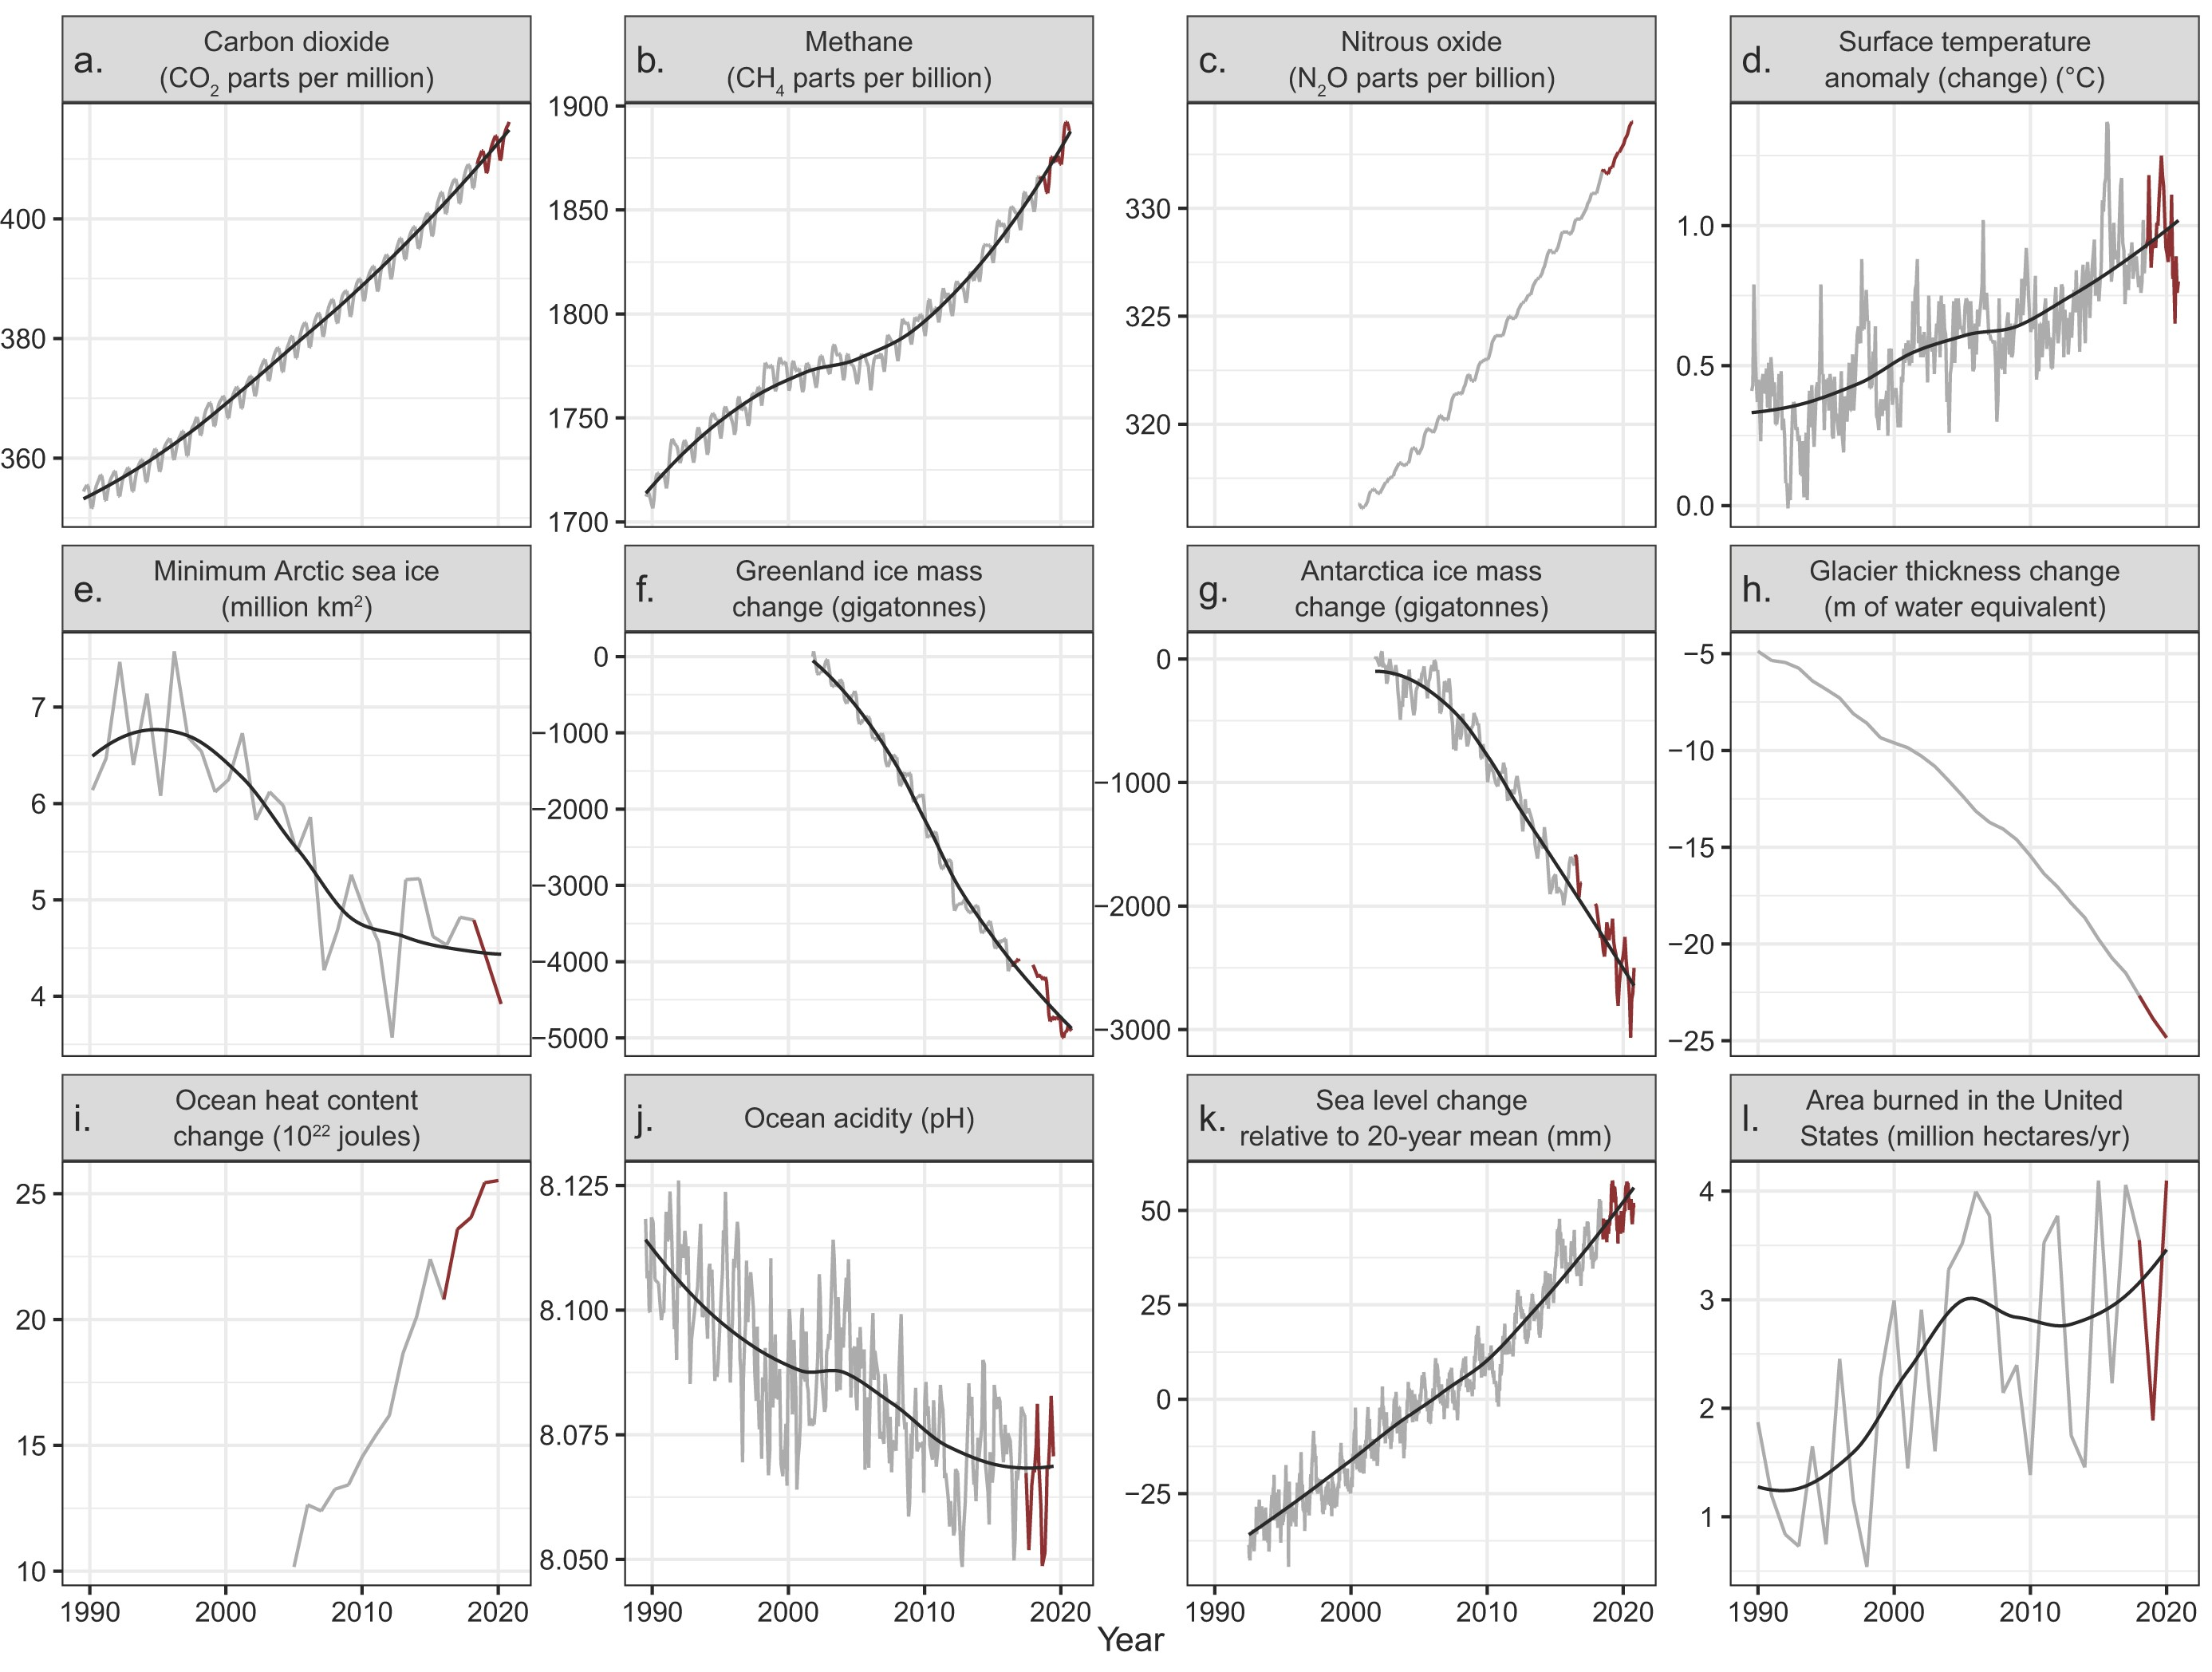
28 July 2021 (BioScience) – In 2019, Ripple and colleagues (2020) warned of untold suffering and declared a climate emergency together with more than 11,000 scientist signatories from 153 countries. They presented graphs of planetary vital signs indicating very troubling trends, along with little progress by humanity to address climate change. On the basis of […]

Risk levels for climate-sensitive health outcomes based on different greenhouse gas emissions and adaptation scenarios. Graphic: IPCC WG 2 Sixth Assessment Report / AFP

Hunger, drought, disease: UN climate report reveals dire health threats – “The basis for our health is sustained by three pillars: the food we eat, access to water, and shelter. These pillars are totally vulnerable and about to collapse.”

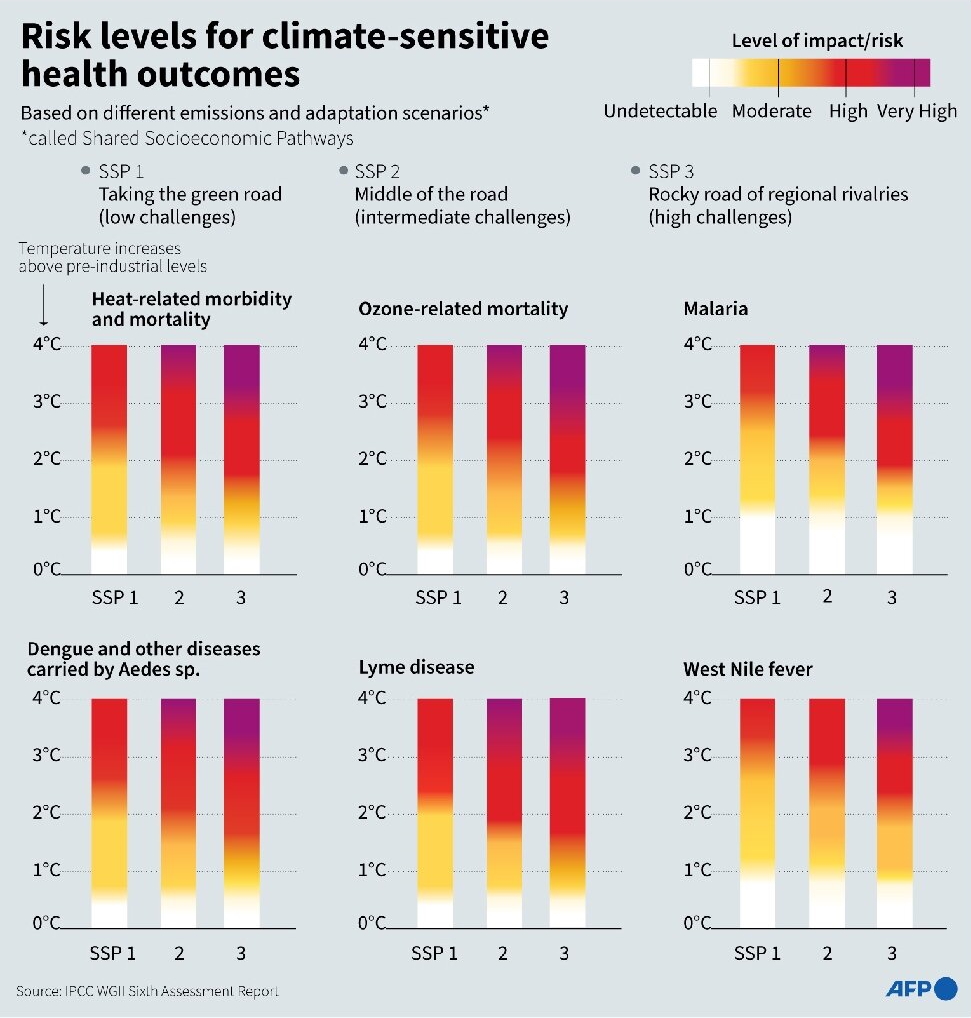
By Patrick Galey 23 June 2021 (AFP) – Hunger, drought and disease will afflict tens of millions more people within decades, according to a draft UN assessment that lays bare the dire human health consequences of a warming planet. After a pandemic year that saw the world turned on its head, a forthcoming report by […]

Global map of temperature anomalies relative to the 1981-2010 long-term average from the ERA5 reanalysis for January to October 2020. Graphic: Copernicus Climate Change Service / ECMWF

WMO: 2020 on track to be one of three warmest years on record – More than 80 percent of the global ocean experienced a marine heatwave in 2020

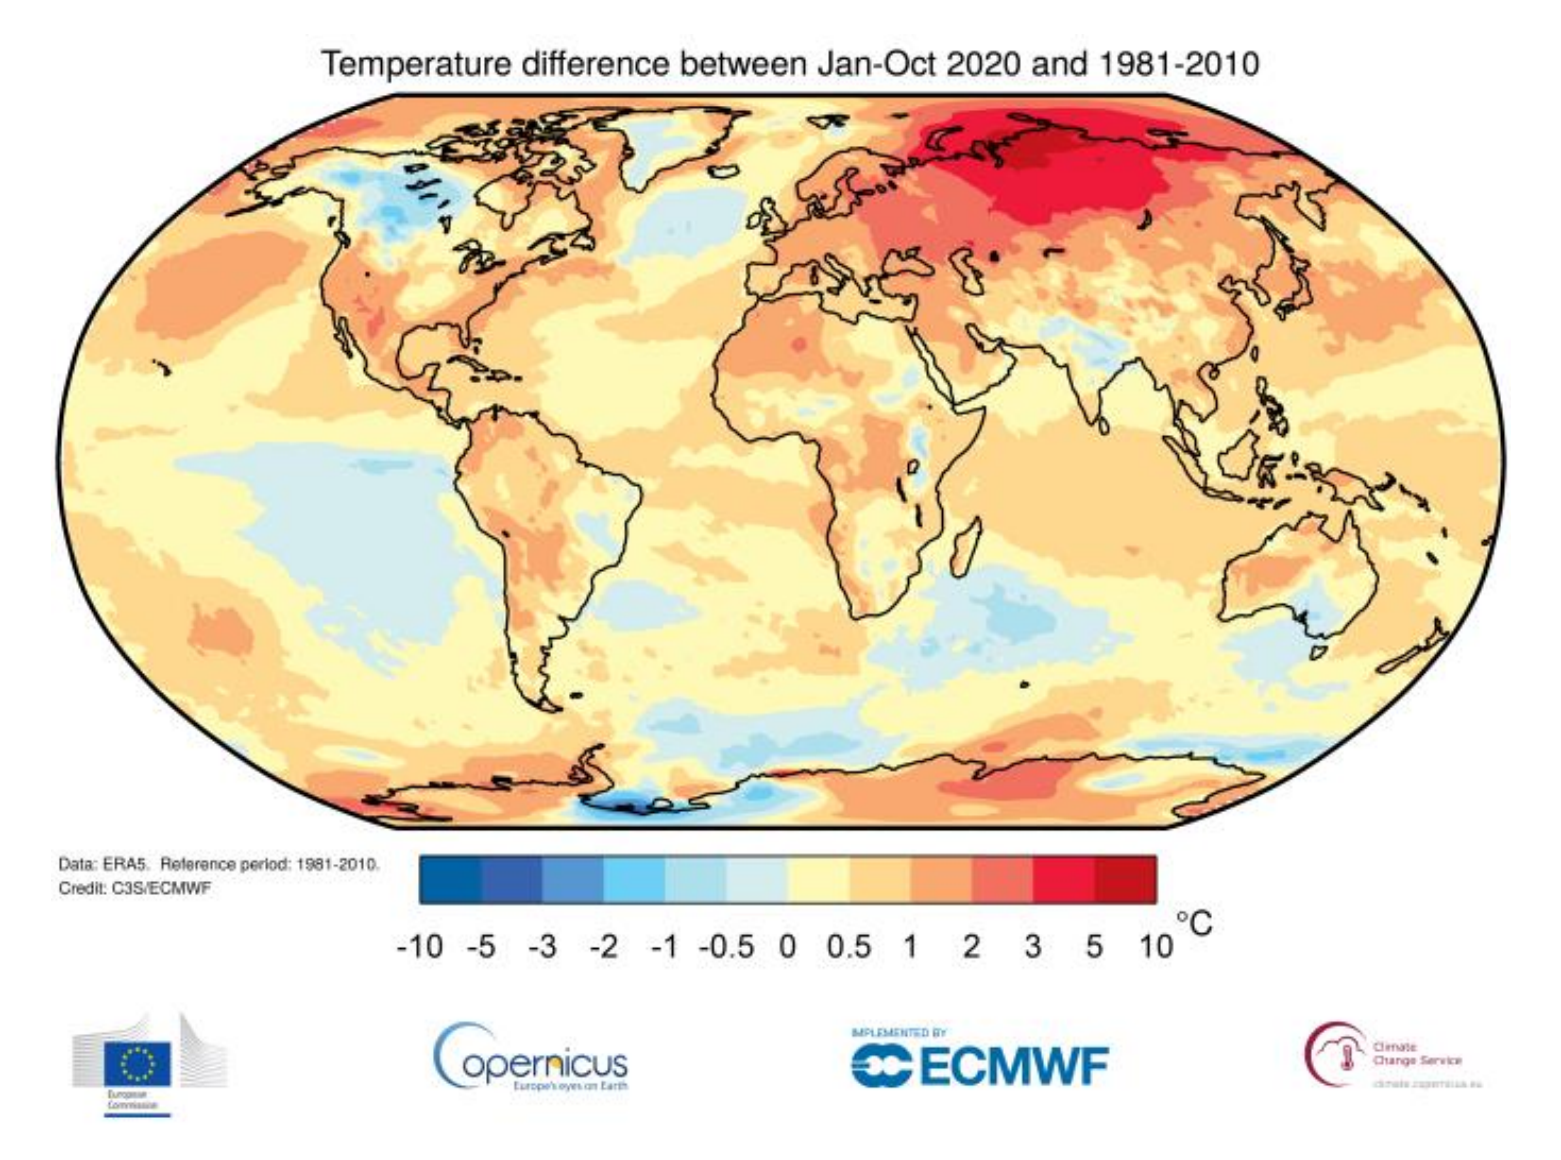
GENEVA, 2 December 2020 (WMO) – Climate change continued its relentless march in 2020, which is on track to be one of the three warmest years on record. 2011-2020 will be the warmest decade on record, with the warmest six years all being since 2015, according to the World Meteorological Organization. Ocean heat is at […]

Spatial distribution of global surface ocean pHT (total hydrogen scale, annually averaged) in past (1770), present (2000) and future (2100) under the IPCC RCP8.5 scenario. Graphic: Jiang, et al., 2020 / Nature Scientific Reports

Graph of the Day: The Future of Ocean Acidification

18 December 2019 (NOAA) – New research by NOAA, the University of Maryland, and international partners published in Nature Scientific Reports shows that the changing chemistry of seawater has implications for continued greenhouse gas absorption. The ocean has been playing an important role in helping slow down global climate change by removing the greenhouse gas carbon dioxide […]

External carapace and pereopod exoskeleton of the Dungeness crab megalopae (a) in its undamaged form (b, c) and with dissolution presence ranging from mild (Stage 1; d) to severe (Stage 2; e, f) patterns showing similarity in the structural damages (g) or exposed crystals (h). Indicated is the scale of the measurements (μm). The undamaged megalopae originated from the offshore or northwards habitats characterized by low ∆Ωcal,60 vertical gradients, while the most severely affected megalopae came from the nearshore or coastal habitats with steep ∆Ωcal,60 conditions. Photo: Bednaršek, et al., 2020 / Science of The Total Environment

Dungeness crab larvae already showing effects of coastal acidification – “We found dissolution impacts to the crab larvae that were not expected to occur until much later in this century”

23 January 2020 (NOAA) – A new NOAA-funded study has documented for the first time that ocean acidification along the US Pacific Northwest coast is impacting the shells and sensory organs of some young Dungeness crab, a prized crustacean that supports the most valuable fishery on the West Coast. Analysis of samples collected during a […]

Graphs showing change in global human activities from 1979 to the present. Graphic: Ripple, et al., 2019 / BioScience

More than 11,000 scientists issue warning of climate emergency – “An immense increase of scale in endeavors to conserve our biosphere is needed to avoid untold suffering due to the climate crisis”

5 November 2019 (BioScience) – Scientists have a moral obligation to clearly warn humanity of any catastrophic threat and to “tell it like it is.” On the basis of this obligation and the graphical indicators presented below, we declare, with more than 11,000 scientist signatories from around the world, clearly and unequivocally that planet Earth […]

Social media & sharing icons powered by UltimatelySocial