Arctic annual air surface temperatures from October 2021 to September 2022 were the sixth warmest dating back to 1900. The image on the left depicts the departure from the average near-surface temperature across the Arctic during this period, with redder colors showing areas of greater than average warmth. The graphic on the right shows how the rate of Arctic air temperature warming has outpaced the rate of global warming. Data: ERA5 and NASA. Graphic: NOAA / Climate.gov

NOAA: Human-caused climate change fuels warmer, wetter, stormier Arctic

13 December 2022 (NOAA) – A typhoon, smoke from wildfires, and increasing rain are not what most imagine when thinking of the Arctic. Yet these are some of the climate-driven events included in NOAA’s 2022 Arctic Report Card, which provides a detailed picture of how warming is reshaping the once reliably frozen, snow-covered region which […]

(a) Annual mean temperature anomalies in the Arctic (66.5∘–90∘N) (dark colours) and globally (light colours) during 1950–2021 derived from the various observational datasets. Temperature anomalies have been calculated relative to the standard 30-year period of 1981–2010. Shown are also the linear temperature trends for 1979–2021. (b) Annual mean temperature trends for the period 1979–2021, derived from the average of the observational datasets. Areas without a statistically significant change are masked out. (c) Local amplification ratio calculated for the period 1979–2021, derived from the average of the observational datasets. The dashed line in (b) and (c) depicts the Arctic Circle (66.5∘N latitude). Graphic: Rantanen, et al., 2022 / Communications Earth and Environment

Arctic warming four times faster than rest of Earth – “Something is happening in the Arctic, and it will affect us all”

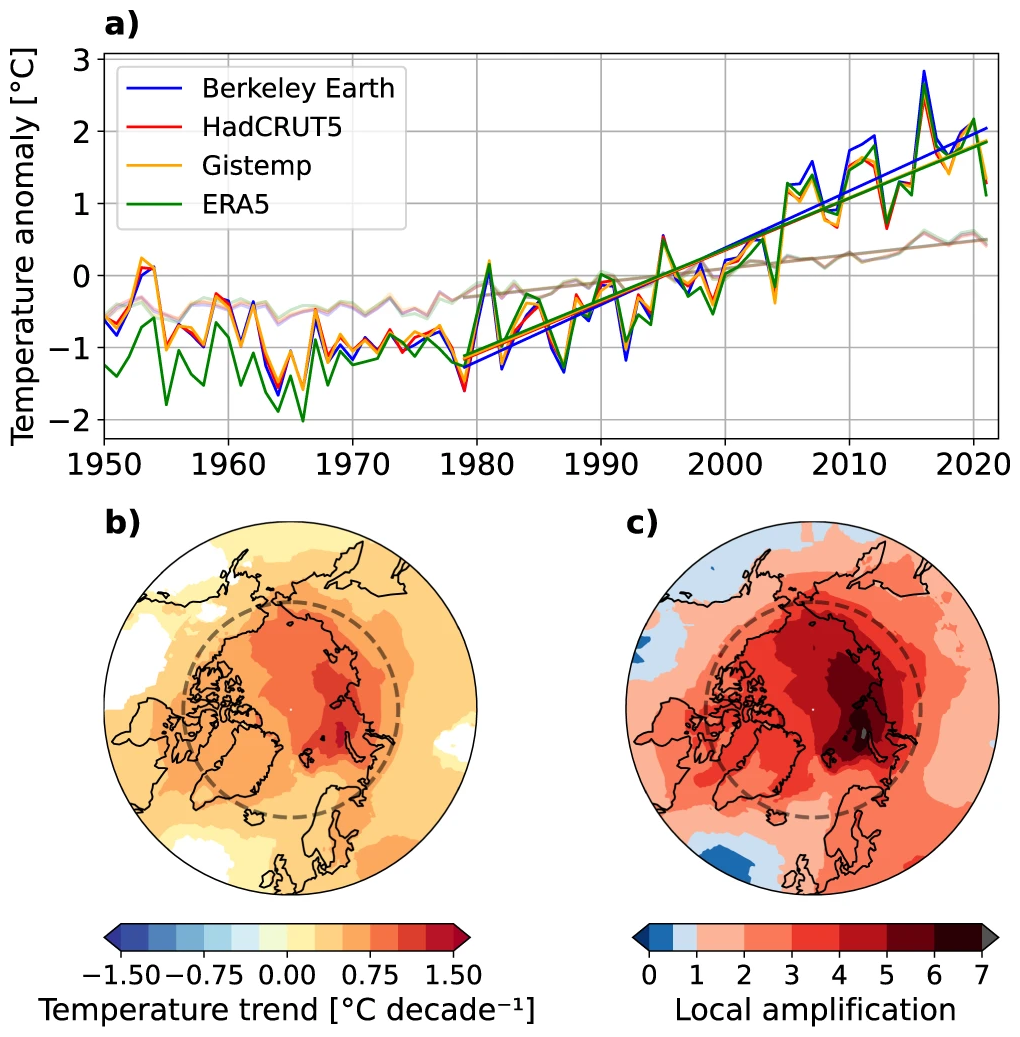
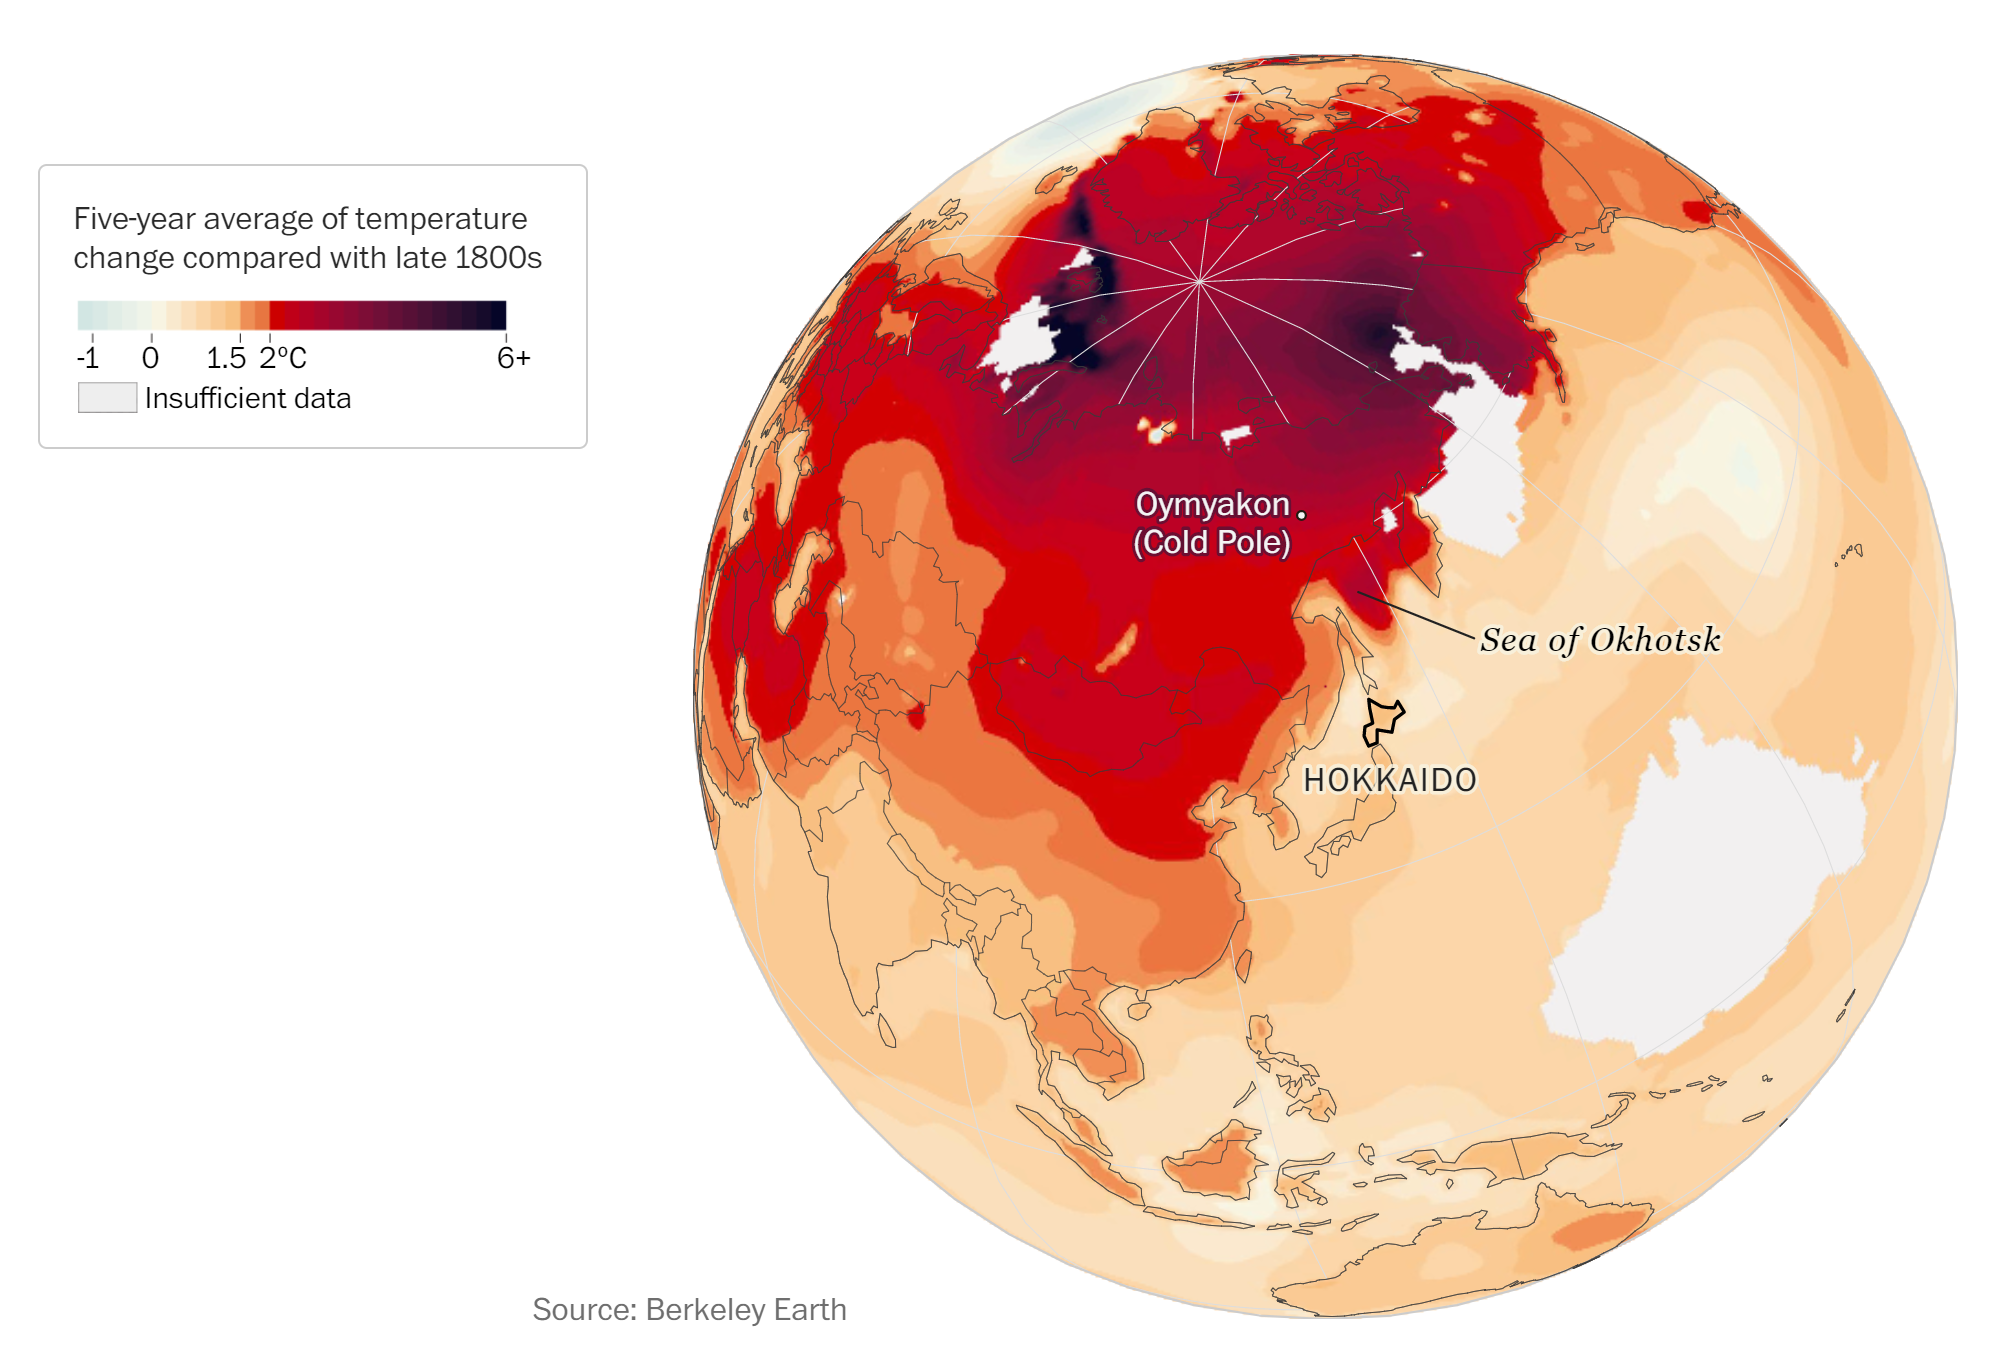
PARIS, 11 August 2022 (AFP) – The Arctic has warmed nearly four times faster than the rest of the planet over the last 40 years, according to research published Thursday that suggests climate models are underestimating the rate of polar heating. The United Nations’ climate science panel said in a special report in 2019 that […]

(a) Linear sea surface temperature (SST) trend (°C yr-1) for August of each year from 1982 to 2021. The trend is only shown for values that are statistically significant at the 95 percent confidence interval; the region is shaded gray otherwise. White shading is the August 2021 mean sea ice extent, and the yellow line indicates the median ice edge for Aug 1982-2010, (b, c) Area-averaged SST anomalies (°C) for August of each year (1982-2021) relative to the 1982-2010 August mean for (b) Baffin Bay and (c) Chukchi Sea regions shown by blue boxes in (a). The dotted lines show the linear SST anomaly trends over the period shown and trends in °C yr-1 (with 95 percent confidence intervals) are shown on the plots. Mean August SST warming trends from 1982 to 2021 persist over much of the Arctic Ocean, with statistically significant (at the 95 percent confidence interval) linear warming trends of up to +0.1°C yr-1 (a). Overall, Baffin Bay SSTs are becoming warmer in August with a linear warming trend over 1982-2021 of 0.05 ± 0.01°C yr-1 (b). Similarly, Chukchi Sea August mean SSTs are warming, with a linear trend of 0.06 ± 0.03°C yr-1 (c). Mean August SSTs for the entire Arctic (the Arctic Ocean and marginal seas north of 67° N) exhibit a linear warming trend of 0.03 ± 0.01°C yr-1. Graphic: Timmermans and Labe / NOAA

NOAA’s 2021 Arctic Report Card: Rapid and pronounced warming continues to drive the evolution of the Arctic environment

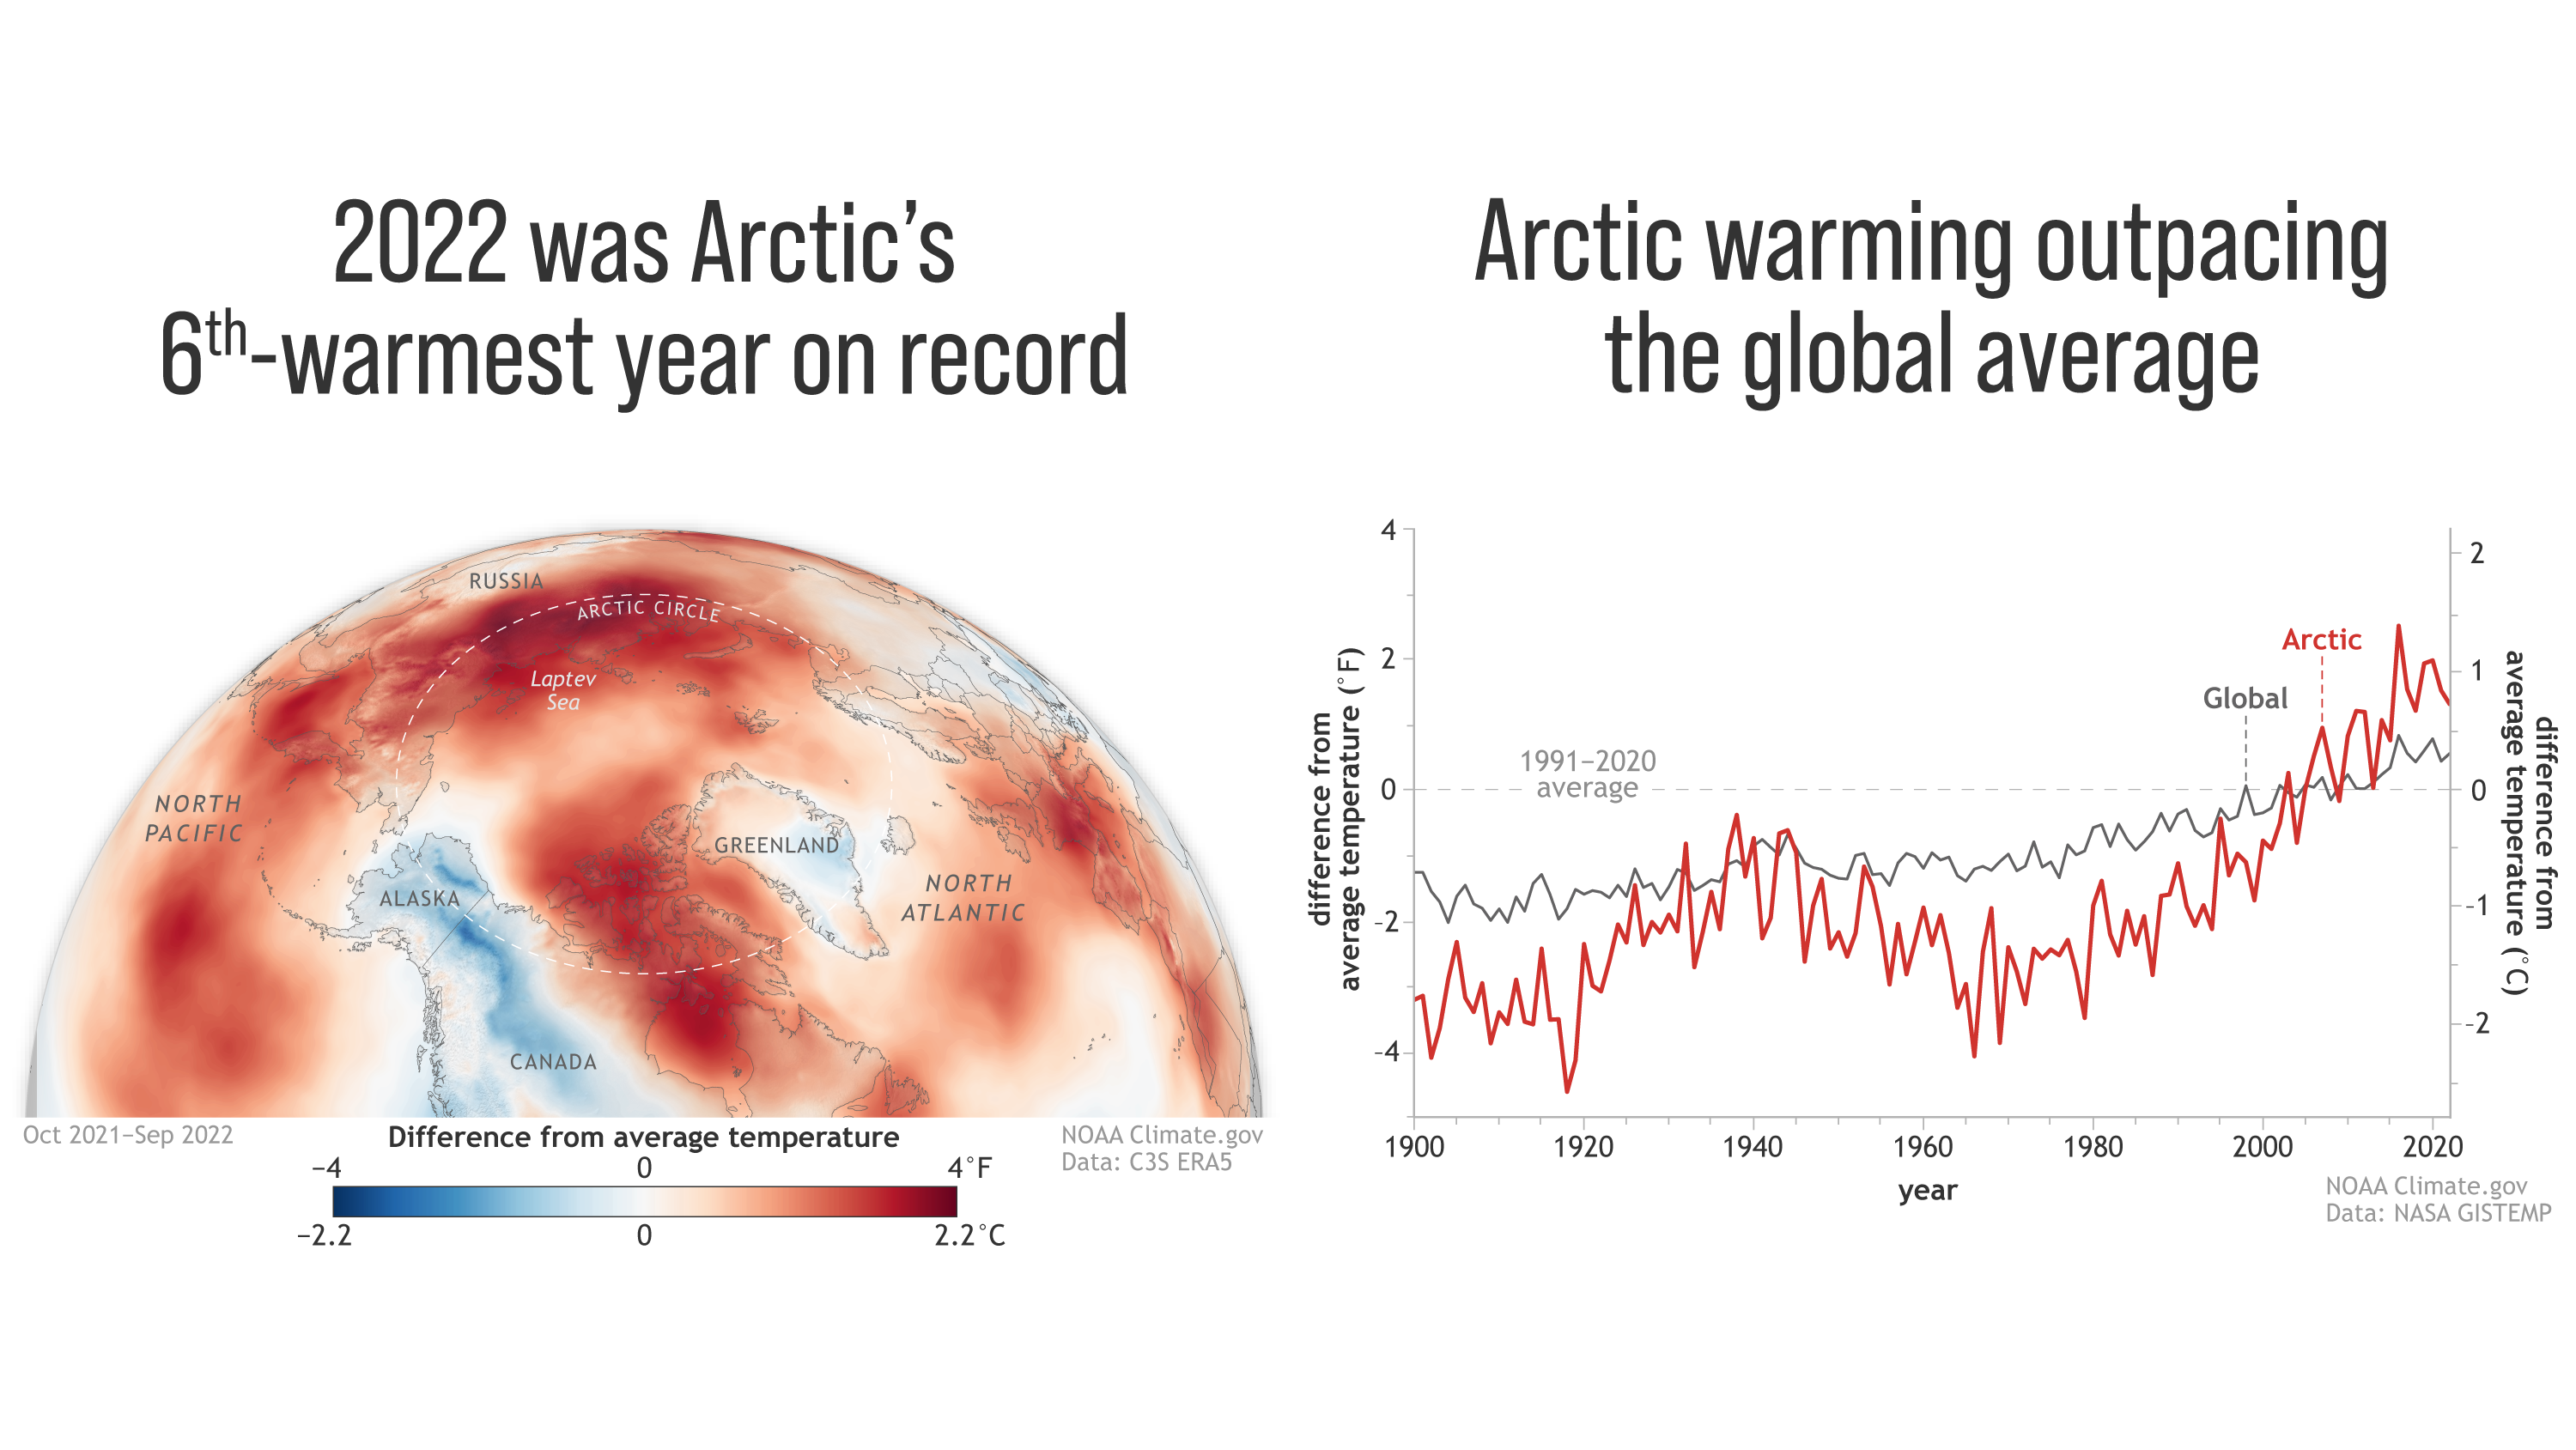
By T. A. Moon, M. L. Druckenmiller, and R. L. Thoman 6 December 2021 (NOAA) – As the influences of human-caused global warming continue to intensify, with the Arctic warming significantly faster than the globe overall, the 2021 Arctic Report Card (ARC2021) brings a broad view of the state of the Arctic climate and environment. […]

Map showing the age of sea ice in the Arctic at winter maximum in 2000 (left, week of March 18) and 2020 (right, week of March 21). Ice older than 5 years (white) is very rare today; only a small ribbon remains along the islands of the Canadian Arctic. Age is a stand-in for ice thickness and durability; young ice is thinner and more likely to melt in the summer. NOAA Climate.gov map, based on data from the National Snow and Ice Data Center. Graphic: NOAA

Sea ice loss and extreme wildfires mark another year of Arctic change – “The transformation of the Arctic to a warmer, less frozen, and biologically changed region is well underway”

8 December 2020 (NOAA) – NOAA’s 15th Arctic Report Card catalogs for 2020 the numerous ways that climate change continues to disrupt the polar region, with second-highest air temperatures and second-lowest summer sea ice driving a cascade of impacts, including the loss of snow and extraordinary wildfires in northern Russia. The Arctic Report Card is […]

Repparfjord is near the northernmost point of Norway. On 30 November 2019, Norway greenlit a copper mine that will dump two million tons of tailings in Arctic fjord each year. Photo: Thomas Nilsen / The Barents Observer

Norway greenlights copper mine that will dump two million tons of tailings in Arctic fjord each year – “Dumping of mining waste will kill every living thing on the ocean floor in the immediate area and disturb spawning grounds over a much greater distance”

ByThomas Nilsen 30 November 2019 (The Barents Observer) – “Allowing this to happen with a protected national salmon fjord doesn’t make sense at all,” said Silje Lundberg, head of Naturvernforbundet. The organisation is the Norwegian branch of Friends of the Earth. Lundberg said the planned dumping of tailings from the copper mine to the fjord […]

(a) Estimated distances animals can travel during the Phocine distemper virus (PDV) latent and infectious period (1 week, 2 weeks, and 4 weeks) illustrating the areas where viral transmission could occur, based on median travel speeds calculated for satellite-tagged bearded seals (green circles), spotted seals (orange), Steller sea lions (blue), and northern fur seals (purple). (b) Recorded tracks of a PDV seropositive bearded seal followed in July 2009 and a seropositive northern fur seal followed in November 2010 shown with sympatric PCR positive spotted seals, ribbon seals, and northern fur seals sampled 2009–2010. Sea ice is shown at its minimum extent in September (panel a) and retreating the following July after reaching a maximum winter extent (panel b). Graphic: VanWormer, et al., 2019 / Scientific Reports

Deadly virus spreads among marine mammals as Arctic sea ice melts – Scientists fear the virus, once found only in European waters, could spread to the U.S. West Coast

By Sarah Gibbens 7 November 2019 (National Geographic) – When sea otters in Alaska were diagnosed with phocine distemper virus (PDV) in 2004, scientists were confused. The pathogen in the Morbillivirus genus that contains viruses like measles had then only been found in Europe and on the eastern coast of North America. “We didn’t understand how a […]

Map showing average surface sea temperature in the Sea of Okhotsk, compared with the late 1800s. Data: Berkeley Earth. Graphic: John Muyskens / The Washington Post

The climate chain reaction that threatens the heart of the Pacific – “When are the fish coming?”

By Simon Denyer and Chris Mooney 12 November 2019 SHIRETOKO PENINSULA, Japan (The Washington Post) – Lined up along the side of their boat, the fishermen hauled a huge, heavy net up from swelling waves. At first, a few small jellyfish emerged, then a piece of plastic. Then net, and more net. Finally, all the […]

Summary of polar bear population status in 2019 by regional subpopulation, showing populations with decreasing trends. Graphic: IUCN / SSC Polar Bear Specialist Group (PBSG)

Scientists update status of polar bear populations with 2019 data

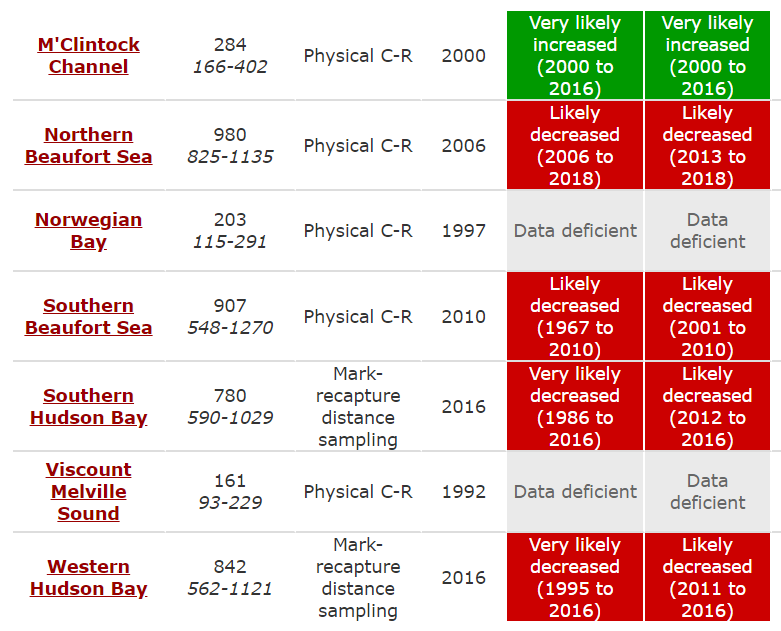
By Dag Vongraven 20 September 2019 (PBSG) – At the last meeting of the IUCN/SSC Polar Bear Specialist Group (PBSG) in Anchorage in 2016, the group agreed that there was a need for new and documented criteria for the assessment of status and trends of polar bear populations. Work to develop a new set of […]

An expedition aboard the “Academic Mstislav Keldysh” discovered a 50-square-foot patch of bubbling methane in the East Siberian Sea Photo: Shirshov Institute of Oceanology

Russian scientists find giant methane fountains in Arctic Ocean – “This is the most powerful seep I have ever been able to observe”

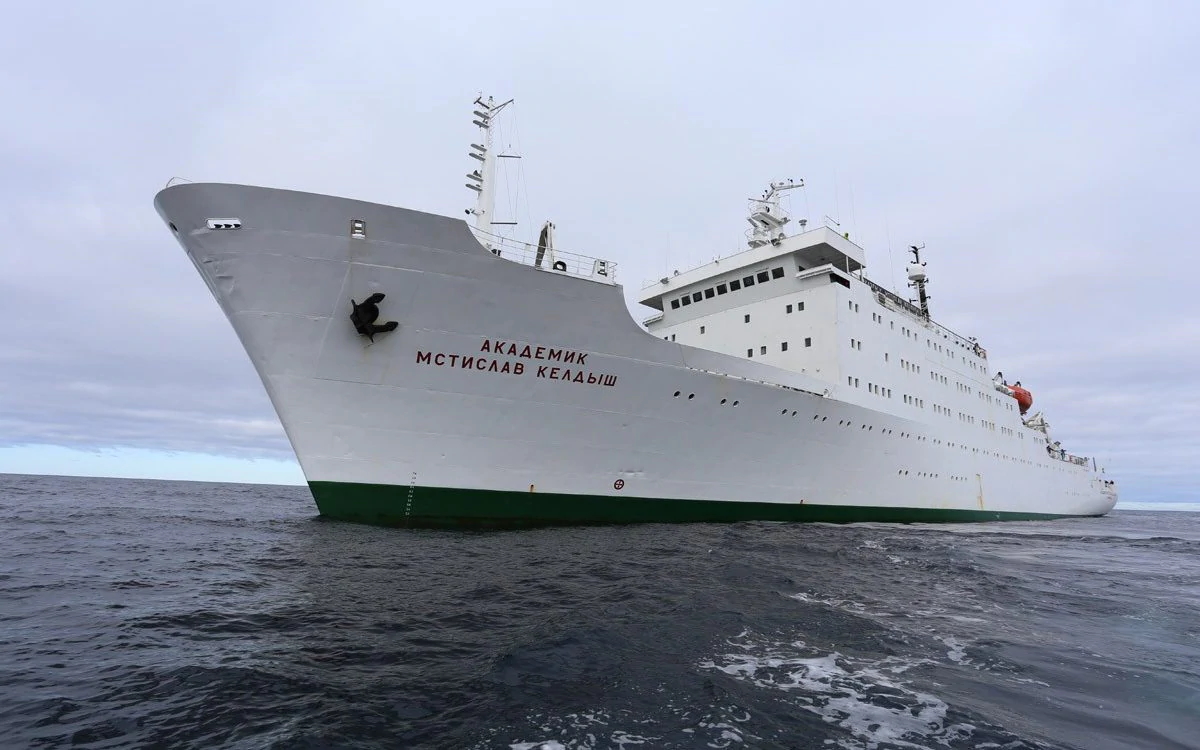
By Alec Luhn 8 October 2019 MOSCOW (The Telegraph) – Russian scientists in the Arctic Ocean said they have discovered the most powerful methane gas fountain ever recorded, highlighting the danger of this greenhouse gas accelerating climate change or causing an oil or gas spill as it erupts from thawing permafrost. A research expedition from […]

Eni Norge’s “Goliat” FPSO arrives in Hammerfest, Norway, on 17 April 2015, from South Korea after a 63-day voyage covering 15,608 nautical miles. When the “Goliat” came on stream later in 2016, it was the world’s northernmost producing offshore oil field. Photo: Fredrik Refvem / Stavanger Aftenblad

Cowboy Nation: Norway’s Wild West fantasy – “It’s your misfortune and none of my own”

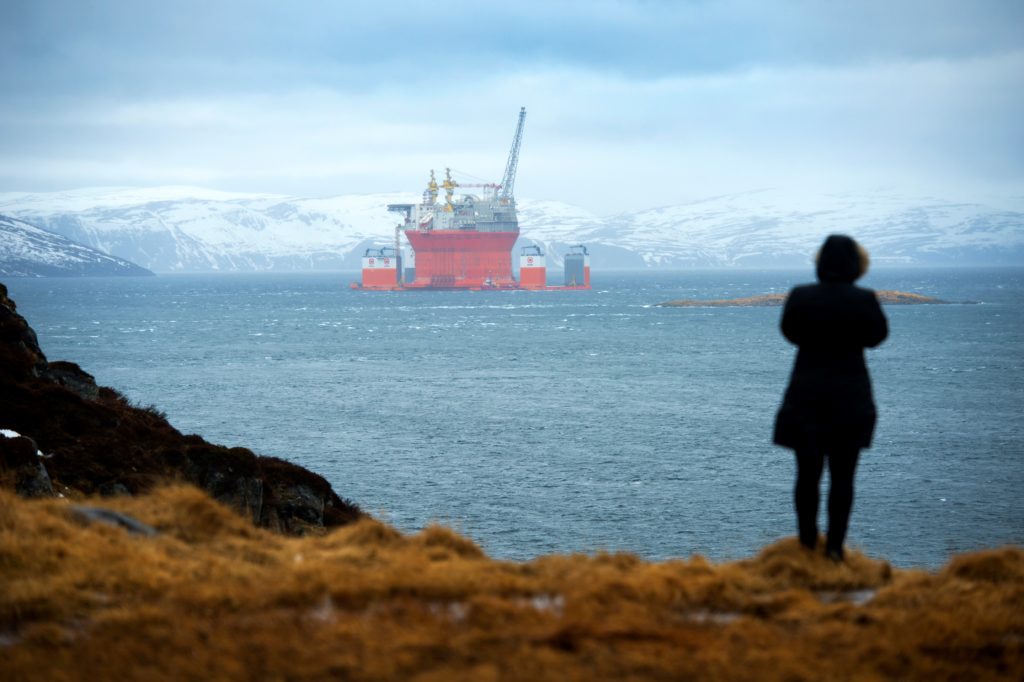
By Henrik Olav Mathiesen 11 September 2019 (The Dark Mountain Project) – Equinor is the publicly owned Norwegian company firmly intent upon wreaking havoc on the world for as long as possible. Off our own shores – and far beyond. In 2017, the company won the bid for two licences to drill offshore in the […]

Social media & sharing icons powered by UltimatelySocial