Sea ice loss and extreme wildfires mark another year of Arctic change – “The transformation of the Arctic to a warmer, less frozen, and biologically changed region is well underway”
8 December 2020 (NOAA) – NOAA’s 15th Arctic Report Card catalogs for 2020 the numerous ways that climate change continues to disrupt the polar region, with second-highest air temperatures and second-lowest summer sea ice driving a cascade of impacts, including the loss of snow and extraordinary wildfires in northern Russia.
The Arctic Report Card is an annual compilation of original, peer-reviewed environmental observations and analyses of a region undergoing rapid and dramatic alterations to weather, climate, oceanic, and land conditions. Compiled by 133 scientists from 15 countries, the 2020 report card tracks environmental indicators to inform decisions by local, state and federal leaders confronting a rapidly changing climate and ecosystems. It was released today during a virtual press conference hosted by the American Geophysical Union as part of its fall meeting.
“For 15 years, the Arctic Report Card has helped NOAA fulfill its mission of providing the scientific information our nation needs to better understand how climate change is affecting the Arctic and weather around the globe,” said retired Navy Rear Adm. Timothy Gallaudet, Ph.D., deputy undersecretary of commerce for oceans and atmosphere at NOAA, who led the news conference. “Our ability to meet the challenges and opportunities of an Arctic region in transition depends on how well we can observe and predict the pace and scale of these changes.”
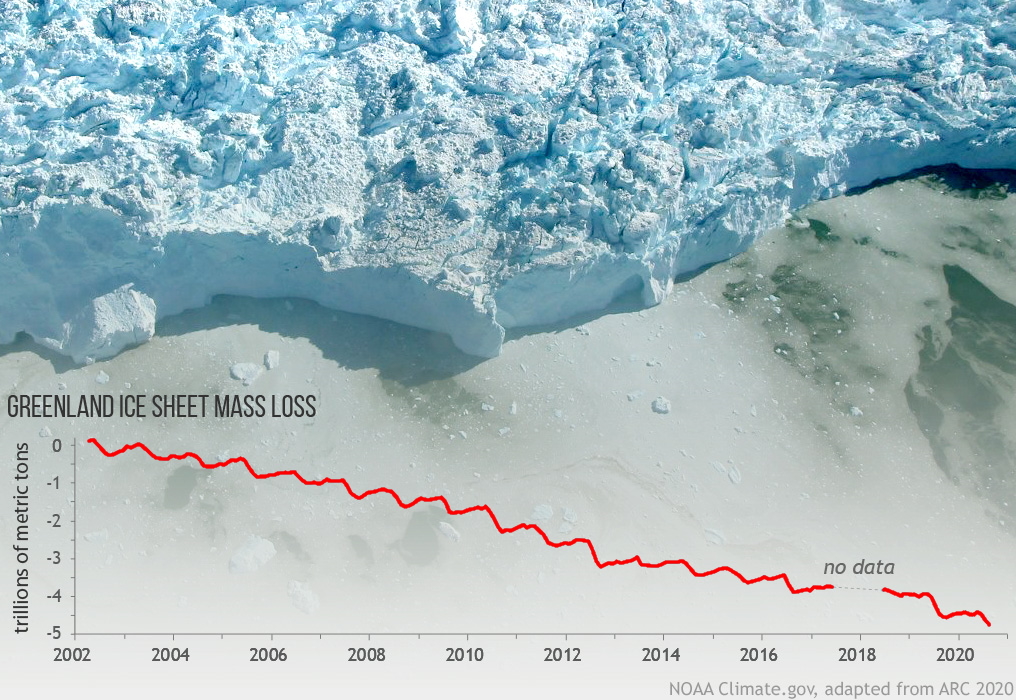
The Arctic Report Card is organized into three sections: Vital Signs provides annual updates on seven topics: Surface Air Temperature; Terrestrial Snow Cover; Greenland Ice Sheet; Sea Ice; Sea Surface Temperature; Arctic Ocean Primary Productivity; and Tundra Greenness. Other Indicators explore topics that are updated periodically. Frostbites reports on new and emerging issues, and topics that relate to long-term scientific observations in the Arctic.
Some of this year’s significant findings include:
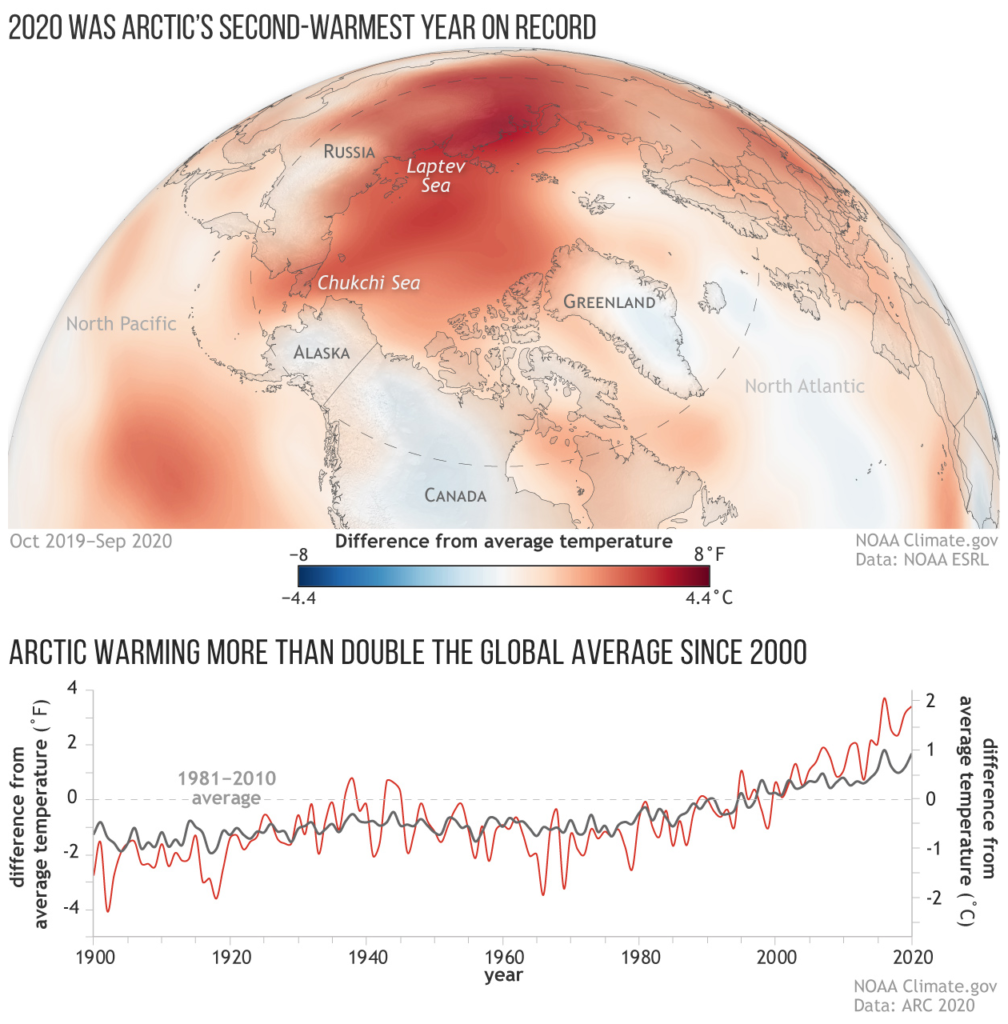
- The average annual land-surface air temperature in the Arctic measured between October 2019 and September 2020 was the second-warmest since record-keeping began in 1900, and was responsible for driving a cascade of impacts across Arctic ecosystems during the year. Nine of the past 10 years saw air temperatures at least 1 degree C above (1.8 degrees F) the 1981-2010 mean. Arctic temperatures for the past six years have all exceeded previous records.
- Extremely high temperatures across Siberia during spring 2020 resulted in the lowest June snow extent across the Eurasian Arctic observed in the past 54 years.
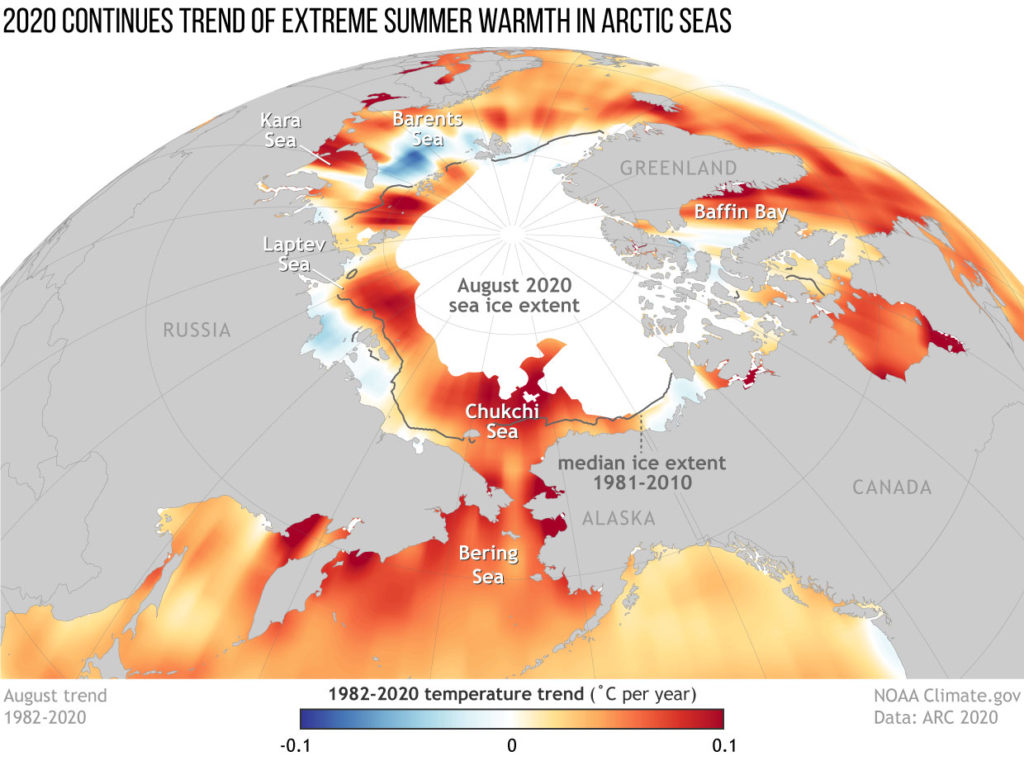
- The 2020 Arctic minimum sea ice extent reached in September was the second-lowest in the satellite record. Overall thickness of the sea ice cover is also decreasing as Arctic ice has transformed from an older, thicker, and stronger ice mass to a younger, thinner more fragile ice mass in the past decade.
- The MOSAiC Expedition, the yearlong expedition based from the Polarstern icebreaker in the central Arctic Ocean, drifted much faster than anticipated through thinner ice than expected, experiencing sea ice dynamics that complicated the scientific mission.
- Extreme wildfires in the Sakha Republic of northern Russia during 2020 coincided with unparalleled warm air temperatures and record snow loss in the region.
- Pacific Arctic bowhead whales have rebounded in the past 30 years, due to increases in both local plankton blooms and transport of increased krill and other food sources northward through the Bering Strait, a signal of long-term warming in the Arctic Ocean.
“Taken as a whole, the story is unambiguous,” said Rick Thoman, Alaska Climate Specialist with the International Arctic Research Center, and one of three editors of this year’s report card. “The transformation of the Arctic to a warmer, less frozen, and biologically changed region is well underway.”
More:
Read the full 2020 Arctic Report Card, and watch our highlights video.
Download corresponding images to the report card from NOAA Climate.gov.
Contact
- Theo Stein, (303) 819-7409
Sea ice loss and extreme wildfires mark another year of Arctic change
One Response
Comments are closed.