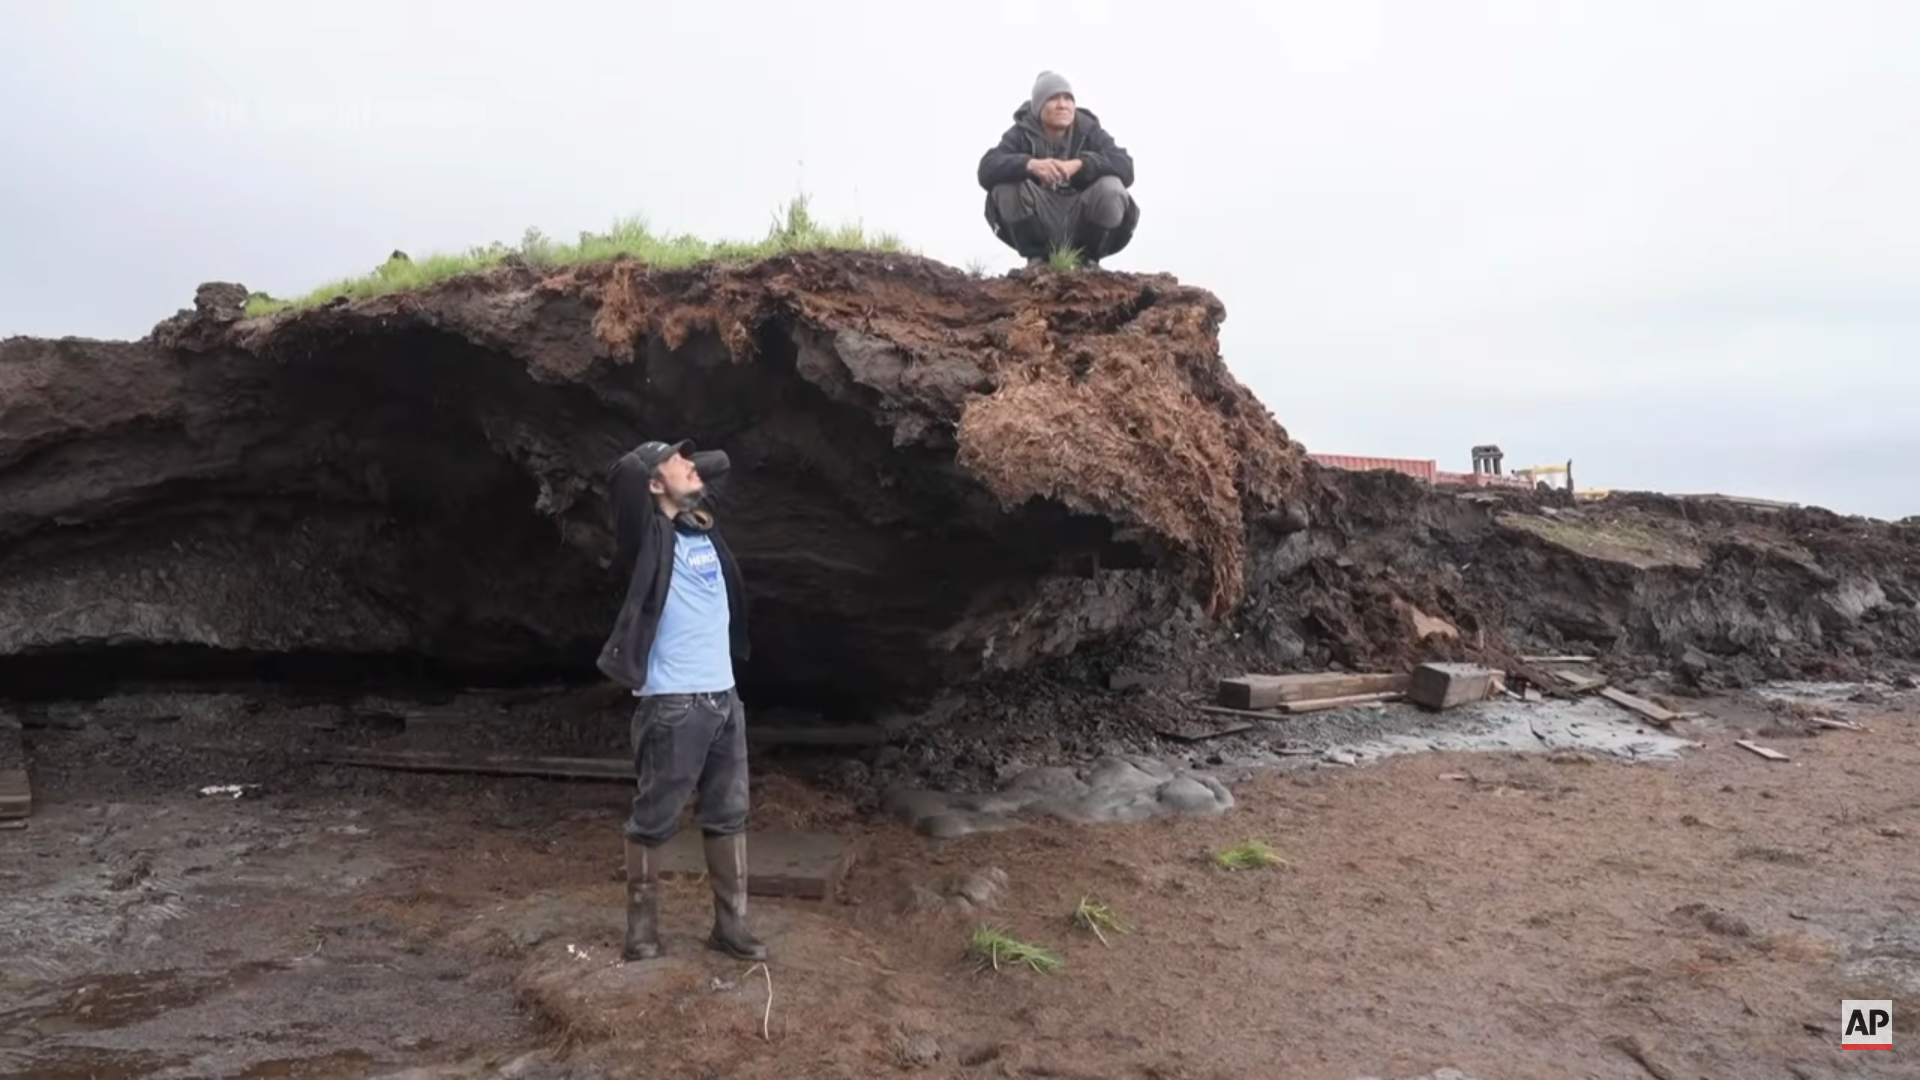
By Rick Bowmer and Mark Thiessen 28 September 2024 MERTARVIK, Alaska (AP) – Growing up along the banks of the Ninglick River in western Alaska, Ashley Tom would look out of her window after strong storms from the Bering Sea hit her village and notice something unsettling: the riverbank was creeping ever closer. It was […]
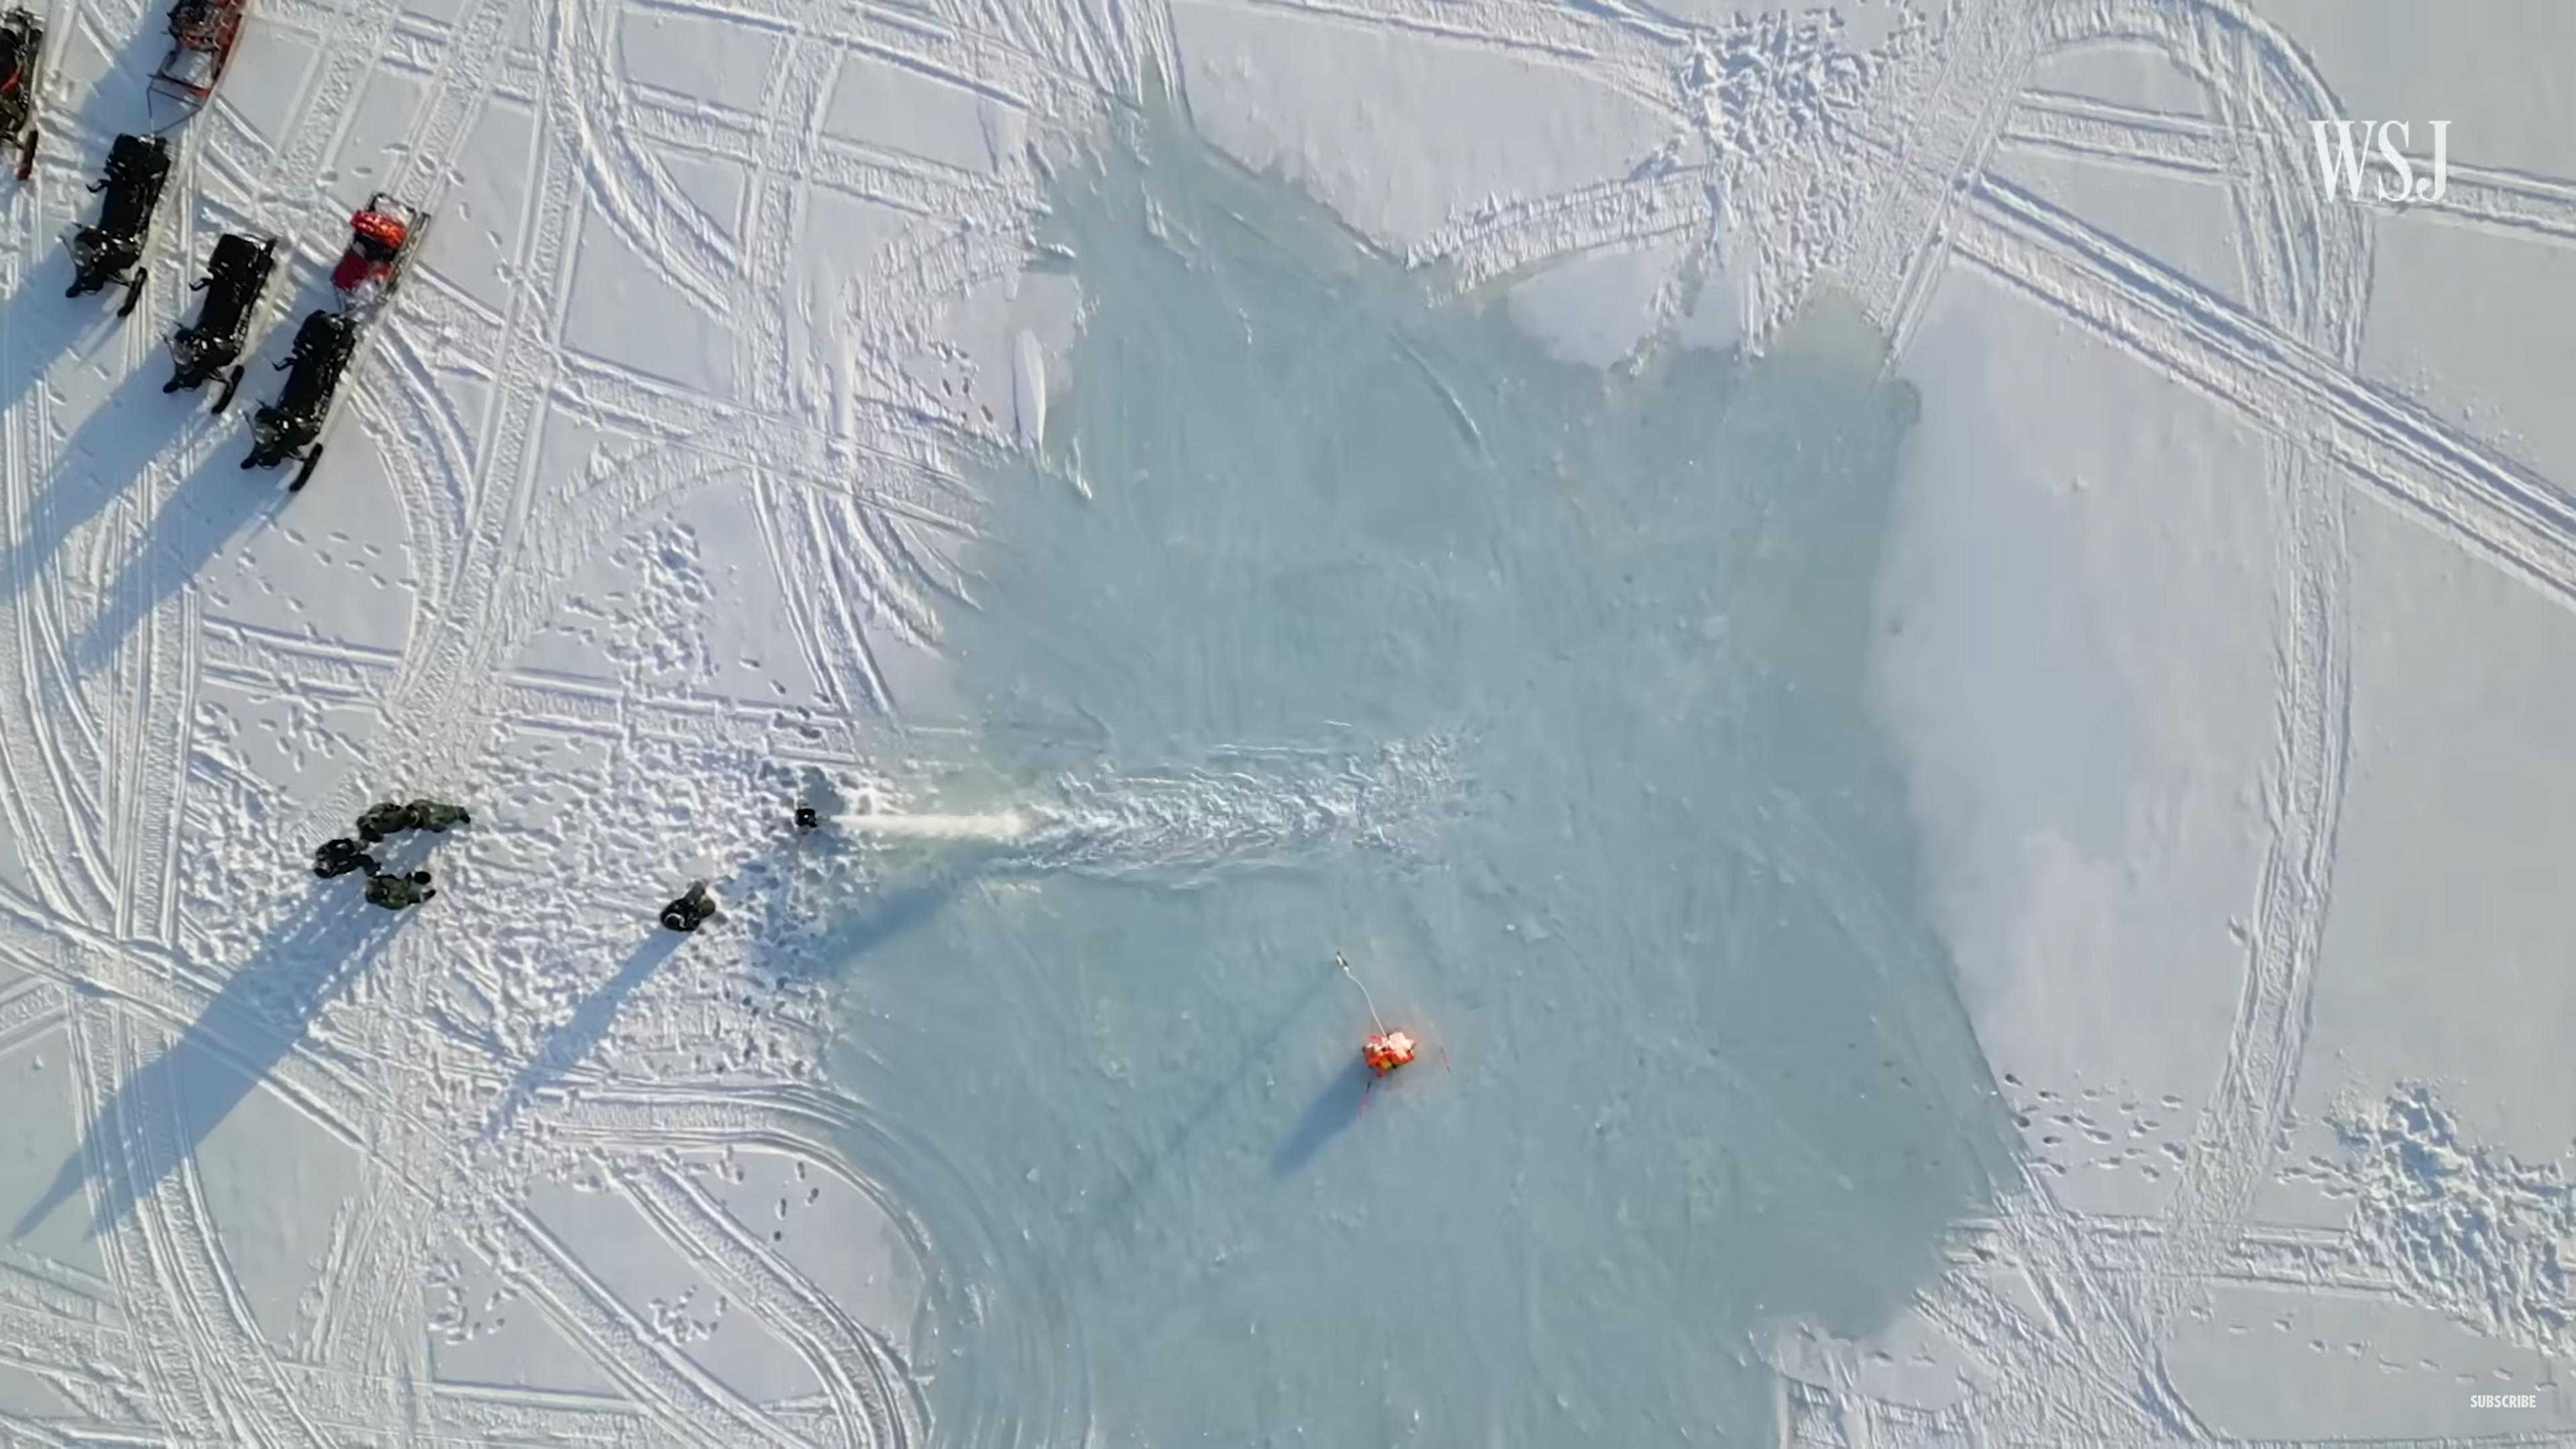
By Sharon Adarlo 8 June 2024 (Futurism) – It sounds pretty out-there: to save the snowy Arctic from melting away due to global warming, some scientific experts have been working on plans to hack the entire region’s climate. This doesn’t entail popping the North Pole into an unfathomably large deep freezer like so much ground […]
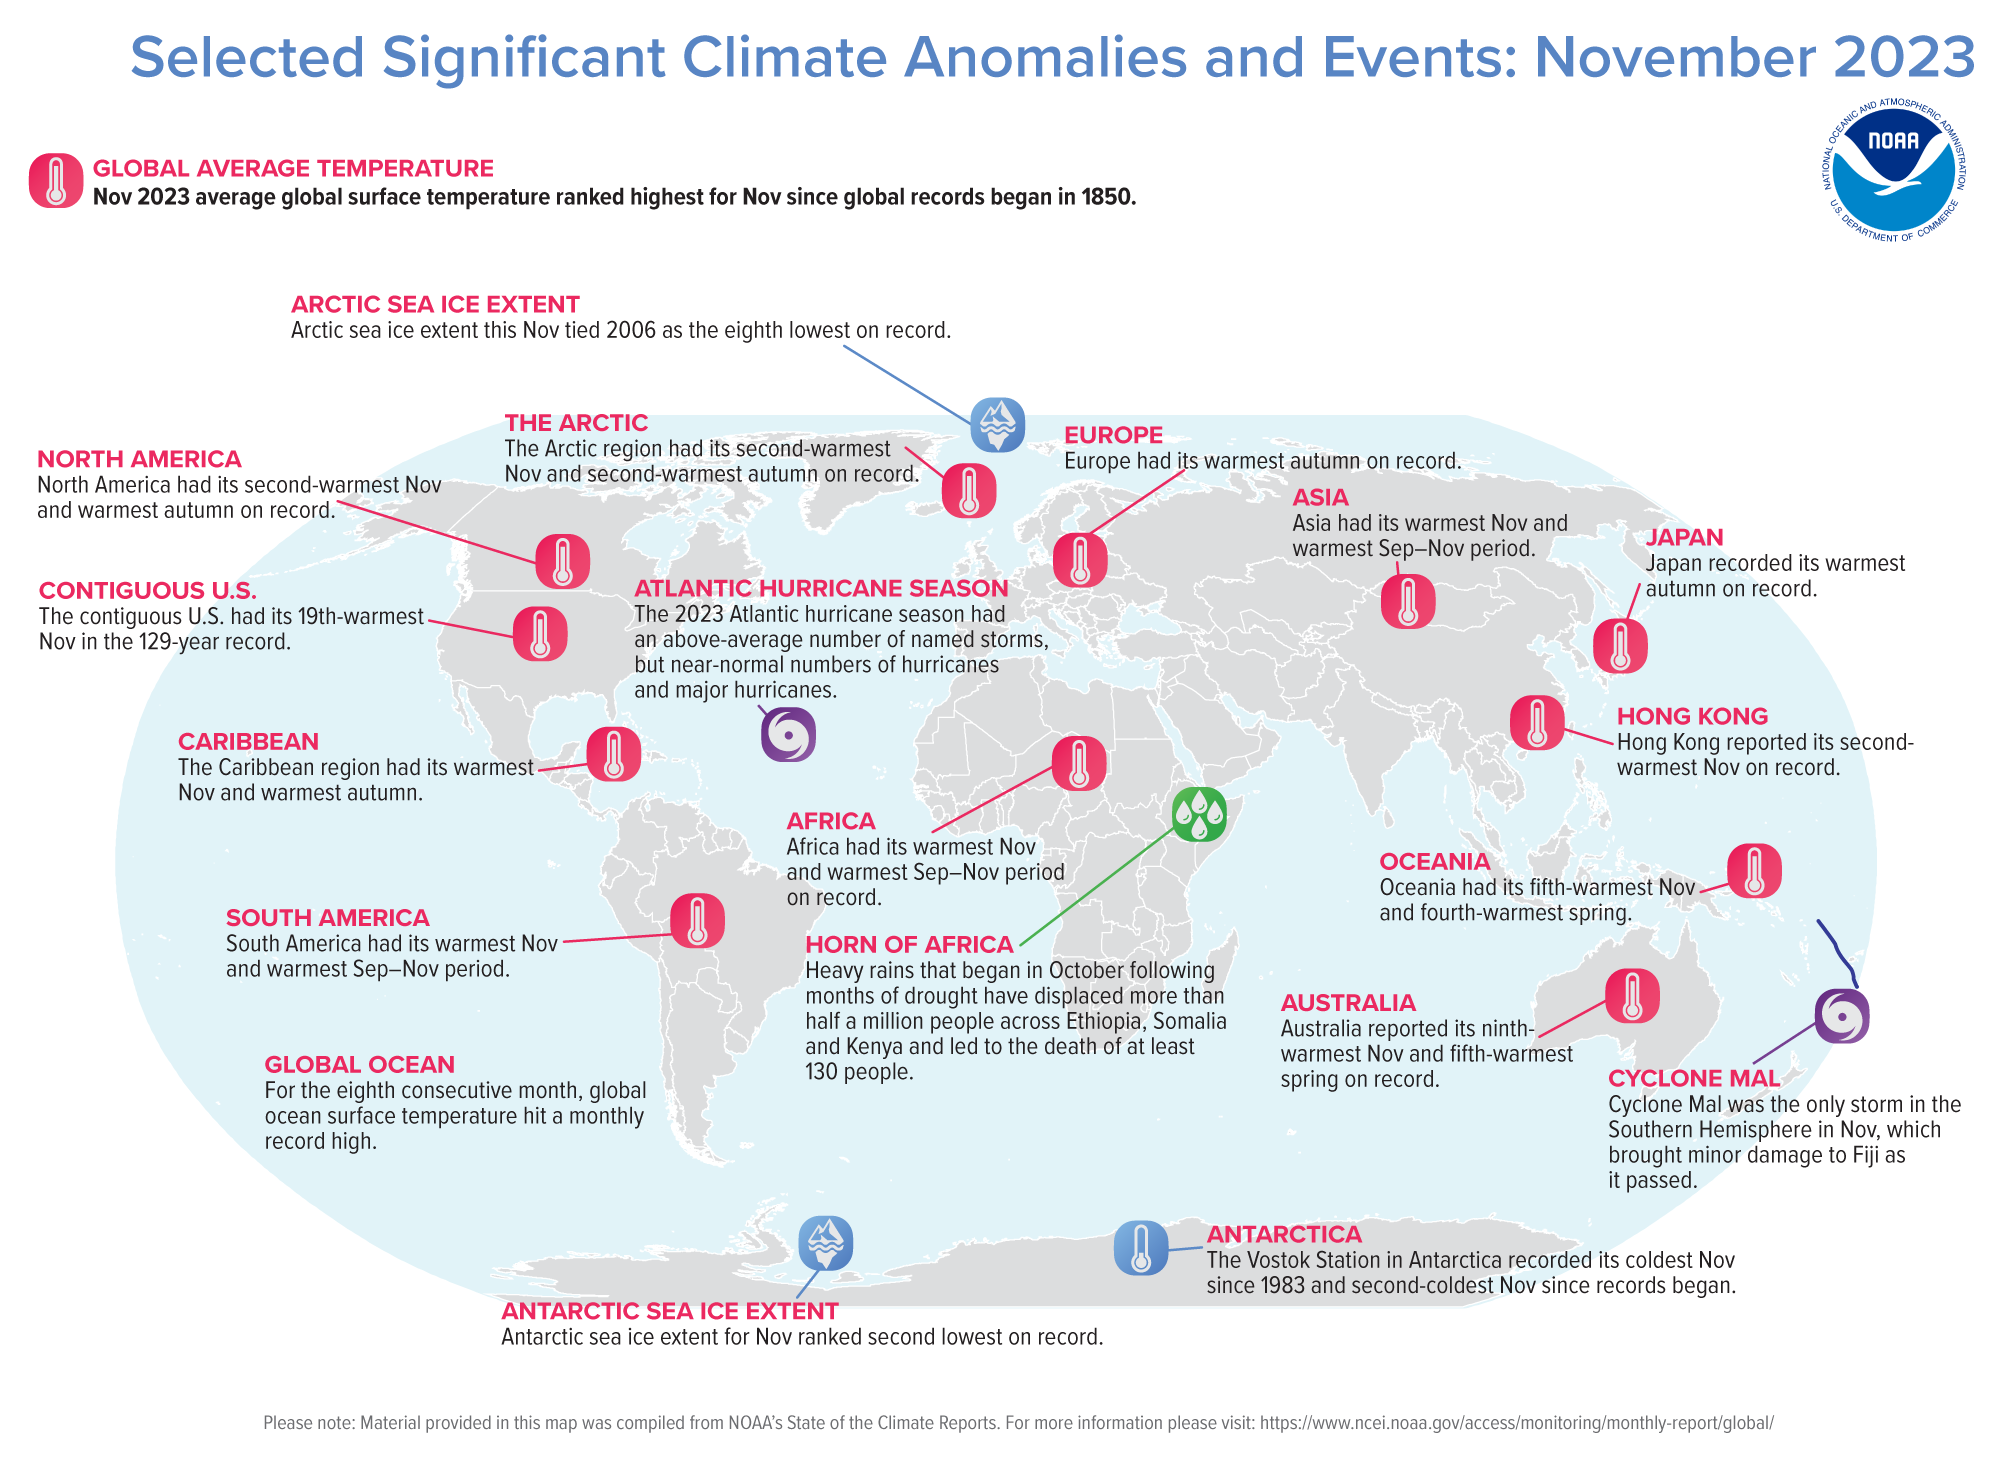
19 March 2024 (WMO) – A new report from the World Meteorological Organization (WMO) shows that records were once again broken, and in some cases smashed, for greenhouse gas levels, surface temperatures, ocean heat and acidification, sea level rise, Antarctic sea ice cover and glacier retreat. Heatwaves, floods, droughts, wildfires, and rapidly intensifying tropical cyclones […]
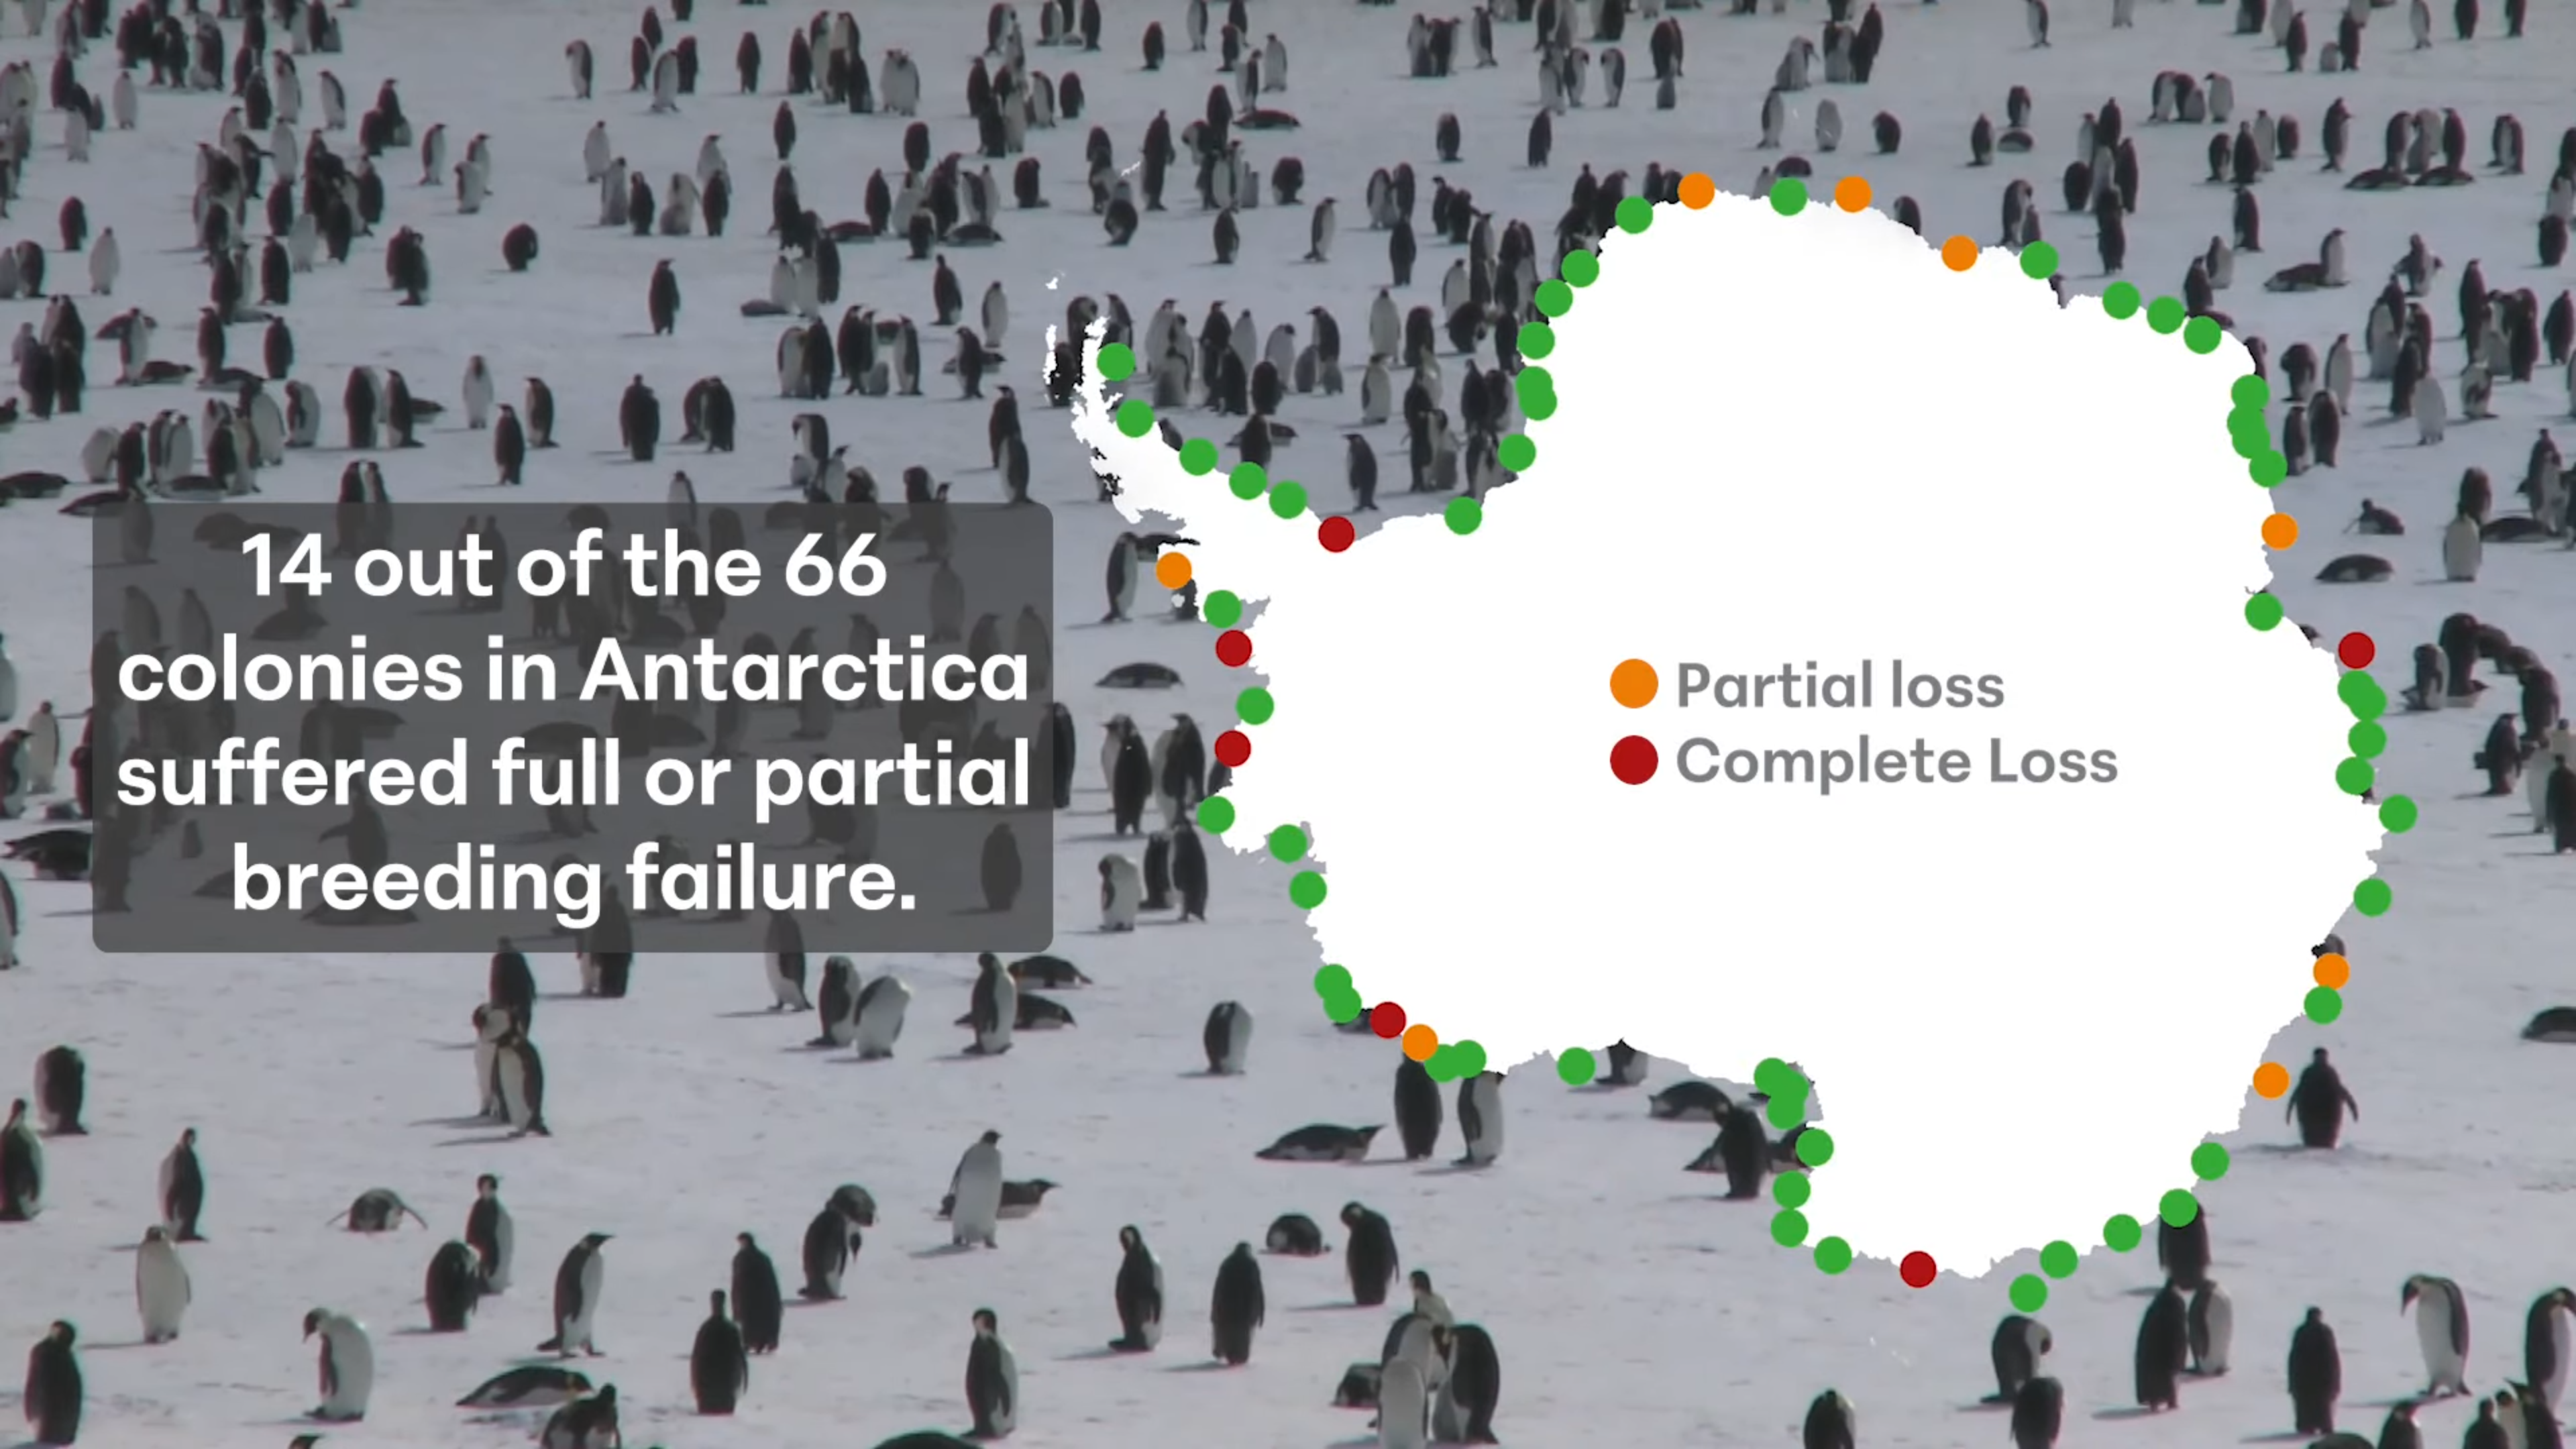
By Gloria Dickie 25 April 2024 LONDON (Reuters) – Record low sea ice in late 2023 led to breeding failures in one-fifth of Antarctica’s emperor penguin colonies, scientists with the British Antarctic Survey said on Thursday. Emperors – the world’s largest penguin species and one of only two endemic to Antarctica — depend on sea […]
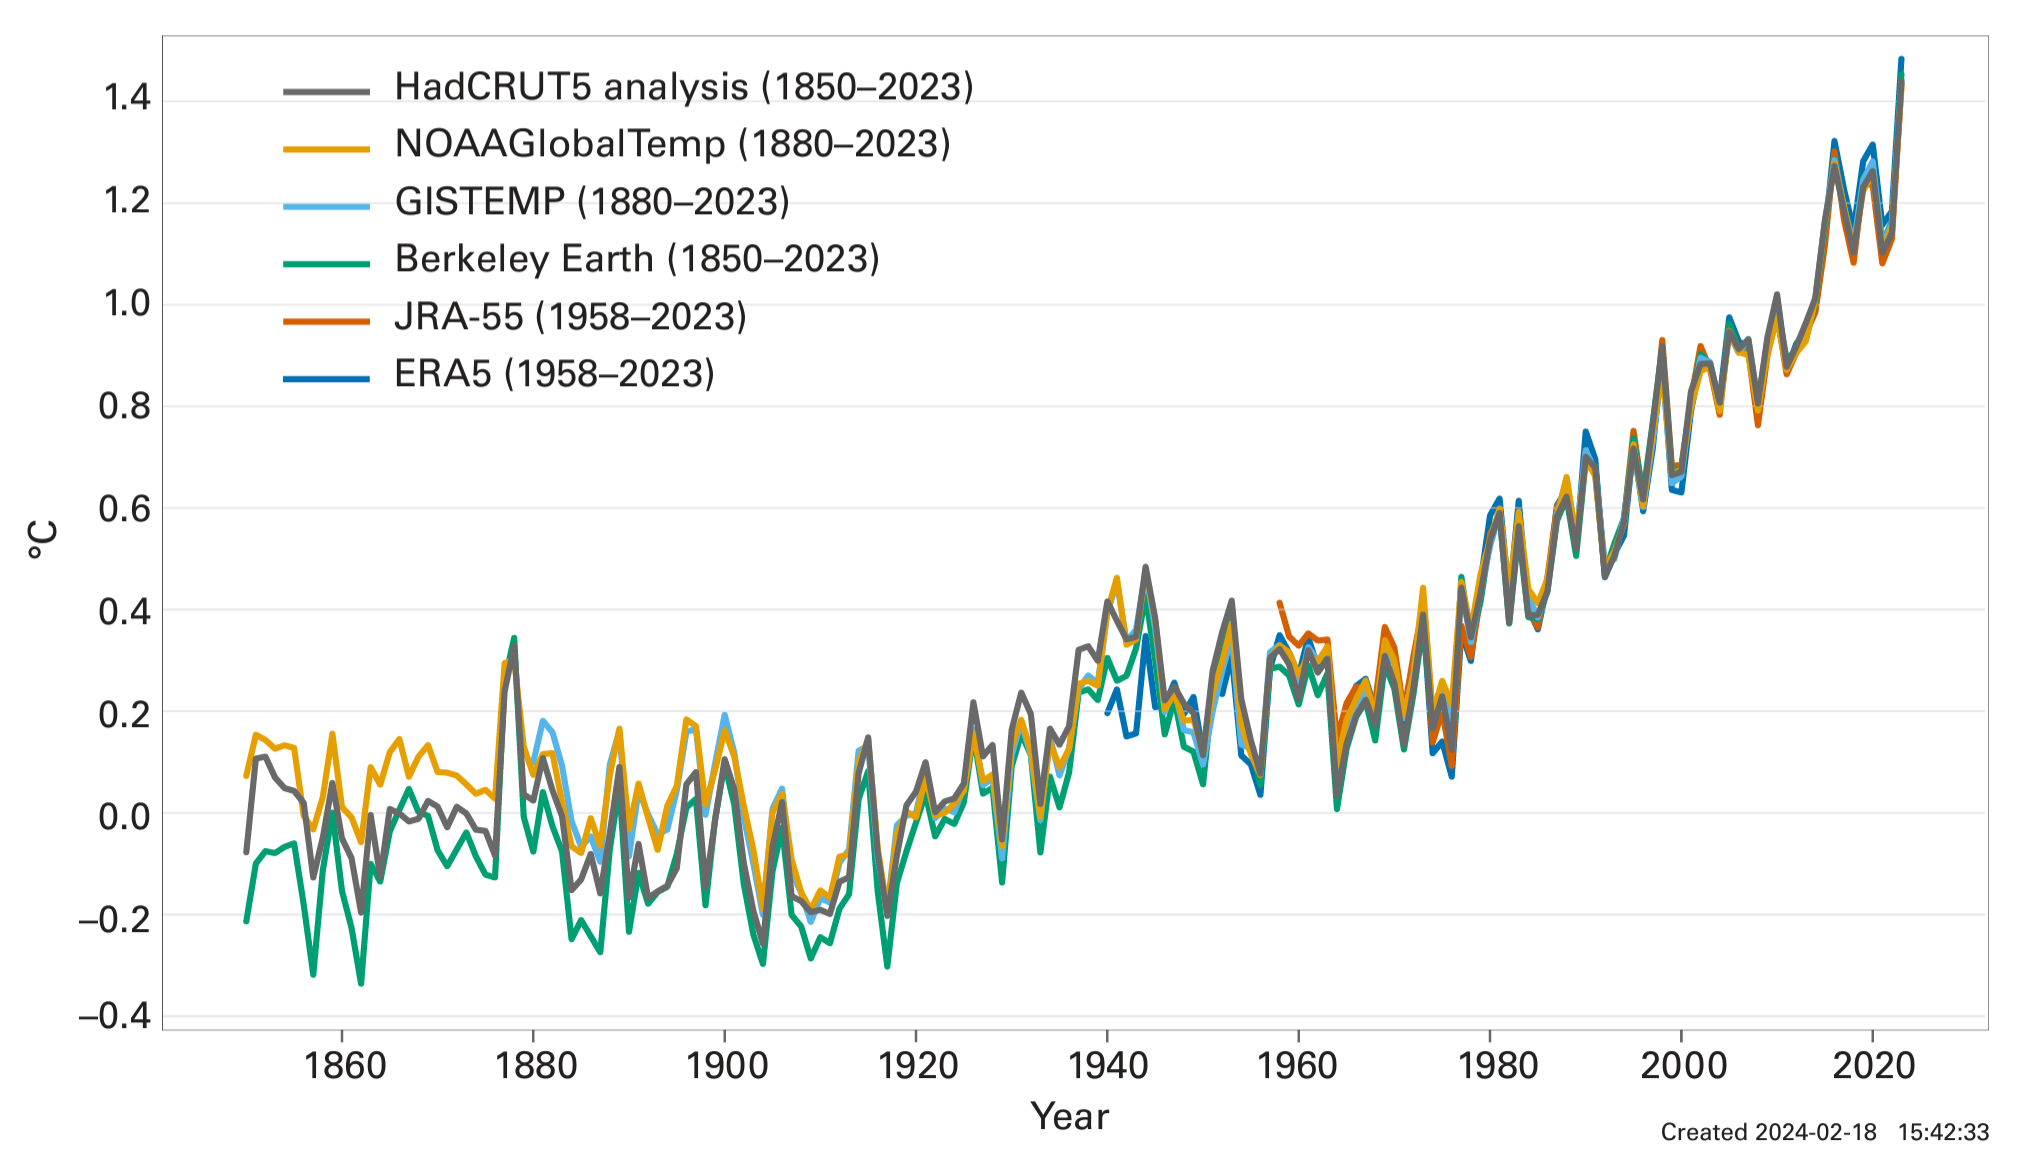
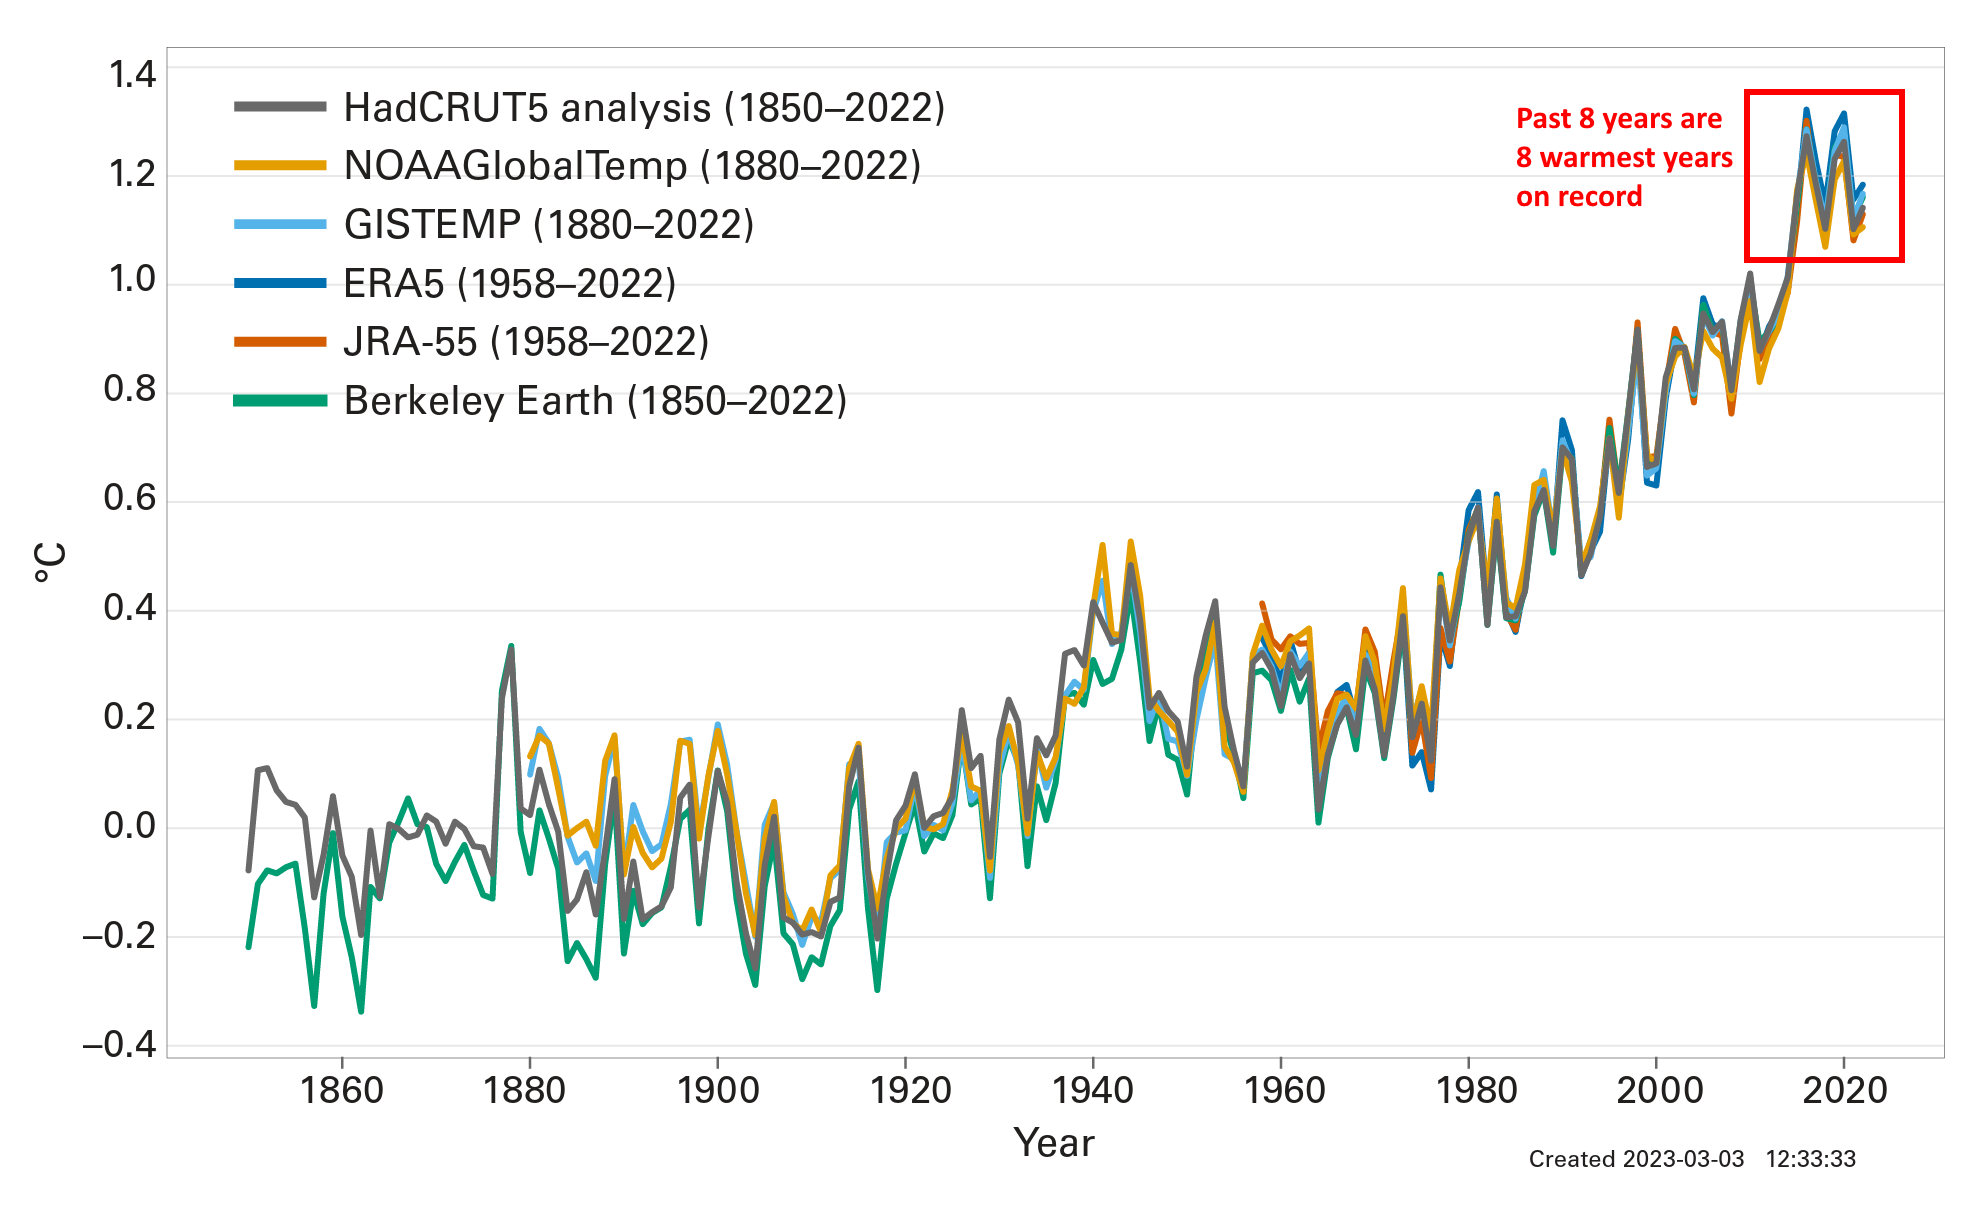
By Lauren Sommer 28 December 2023 (NPR) – As 2023 draws to a close, it’s going out on top. “It’s looking virtually certain at this point that 2023 will be the hottest year on record,” says Zeke Hausfather, climate scientist at Berkeley Earth, a non-profit that analyzes climate trends. Though temperature records from December have […]
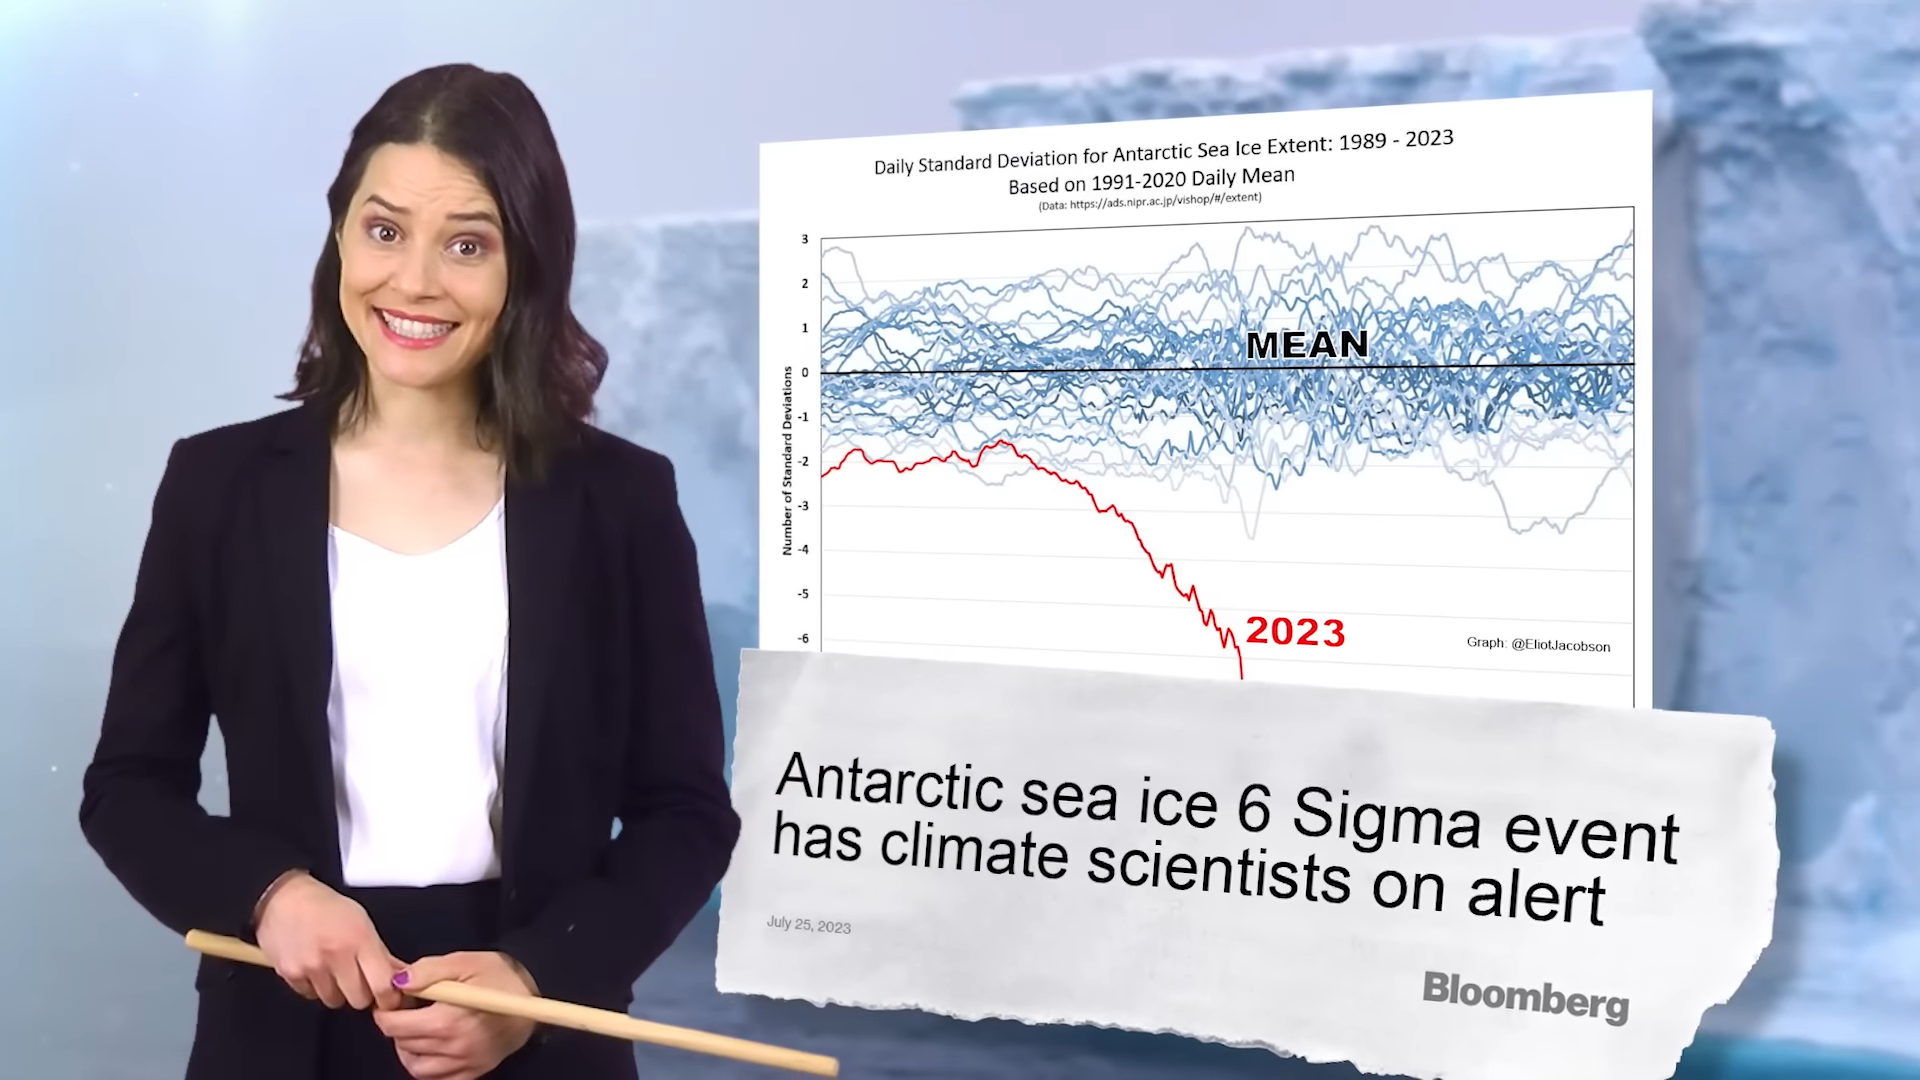
1 August 2023 (The Juice Media) – Hello. Bonjour. Ciao stronzi. Namaste. Ham maadarachod hain. I’m from the Australien Government with a message to the world. As cities bake, fires rage, reefs die, jet streams weaken, and 6-Ligma events cause climate scientists to shit their dacks, many are wondering if we’ve finally broken our favourite […]
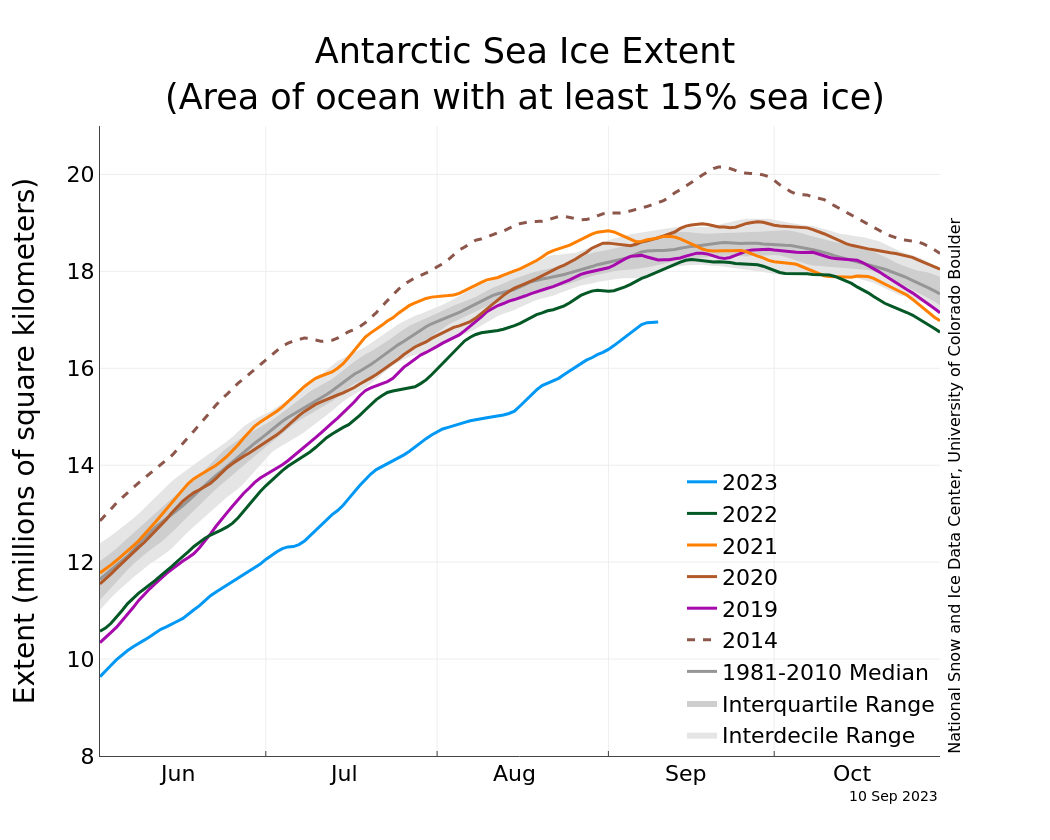
By Kasha Patel 25 September 2023 (The Washington Post) – Sea ice levels around Antarctica just registered a record low — and by a wide margin — as winter comes to a close, according to the National Snow and Ice Data Center (NSIDC). This significant milestone adds worry that Antarctic sea ice may be entering […]
Geneva, 21 April 2023 (WMO) – From mountain peaks to ocean depths, climate change continued its advance in 2022, according to the annual report from the World Meteorological Organization (WMO). Droughts, floods, and heatwaves affected communities on every continent and cost many billions of dollars. Antarctic sea ice fell to its lowest extent on record […]
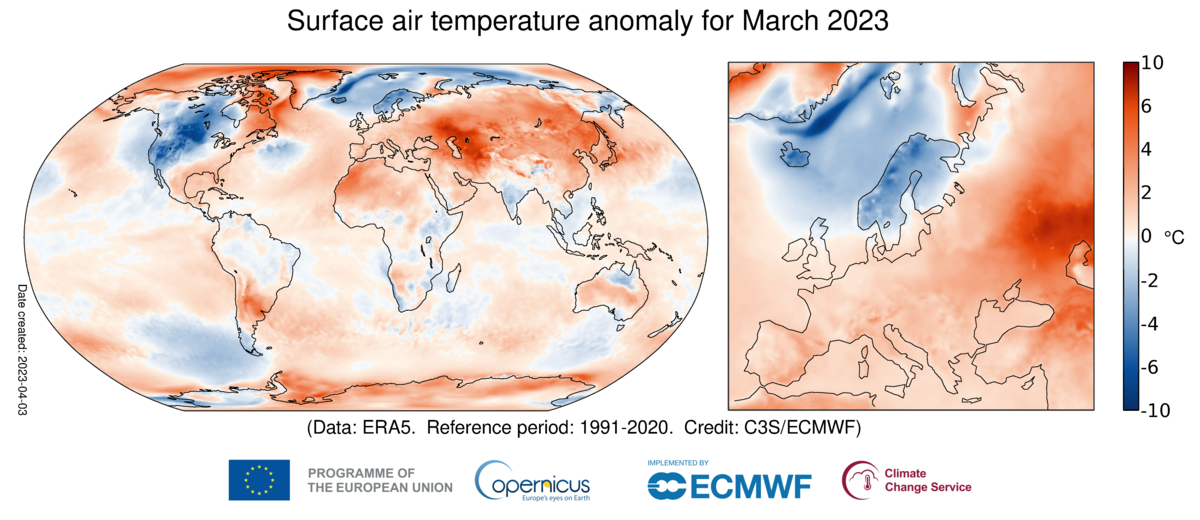
By Matthew Cappucci 7 April 2023 (The Washington Post) – March 2023 will go down in the books as tying for the second warmest March on record. That’s according to the Copernicus Climate Change Service of the European Union. Temperatures globally were several degrees above average in most places outside the western U.S., where a […]
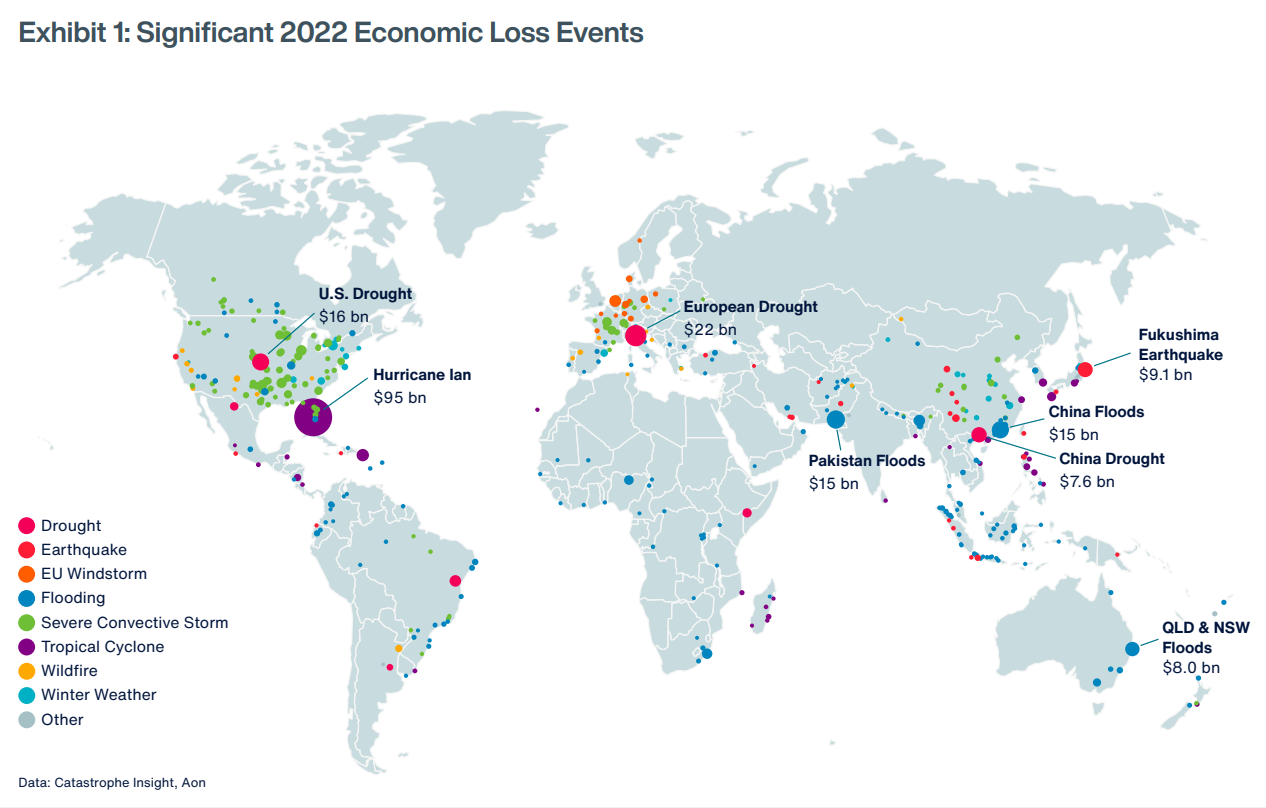
CHICAGO, 25 January 2023 (PRNewswire) – Aon plc (NYSE: AON), a leading global professional services firm, today published its 2023 Weather, Climate and Catastrophe Insight report, which identifies global natural disaster and climate trends to help make better decisions to manage volatility and enhance global resilience. The report reveals that natural disasters caused a $313 billion global economic loss […]