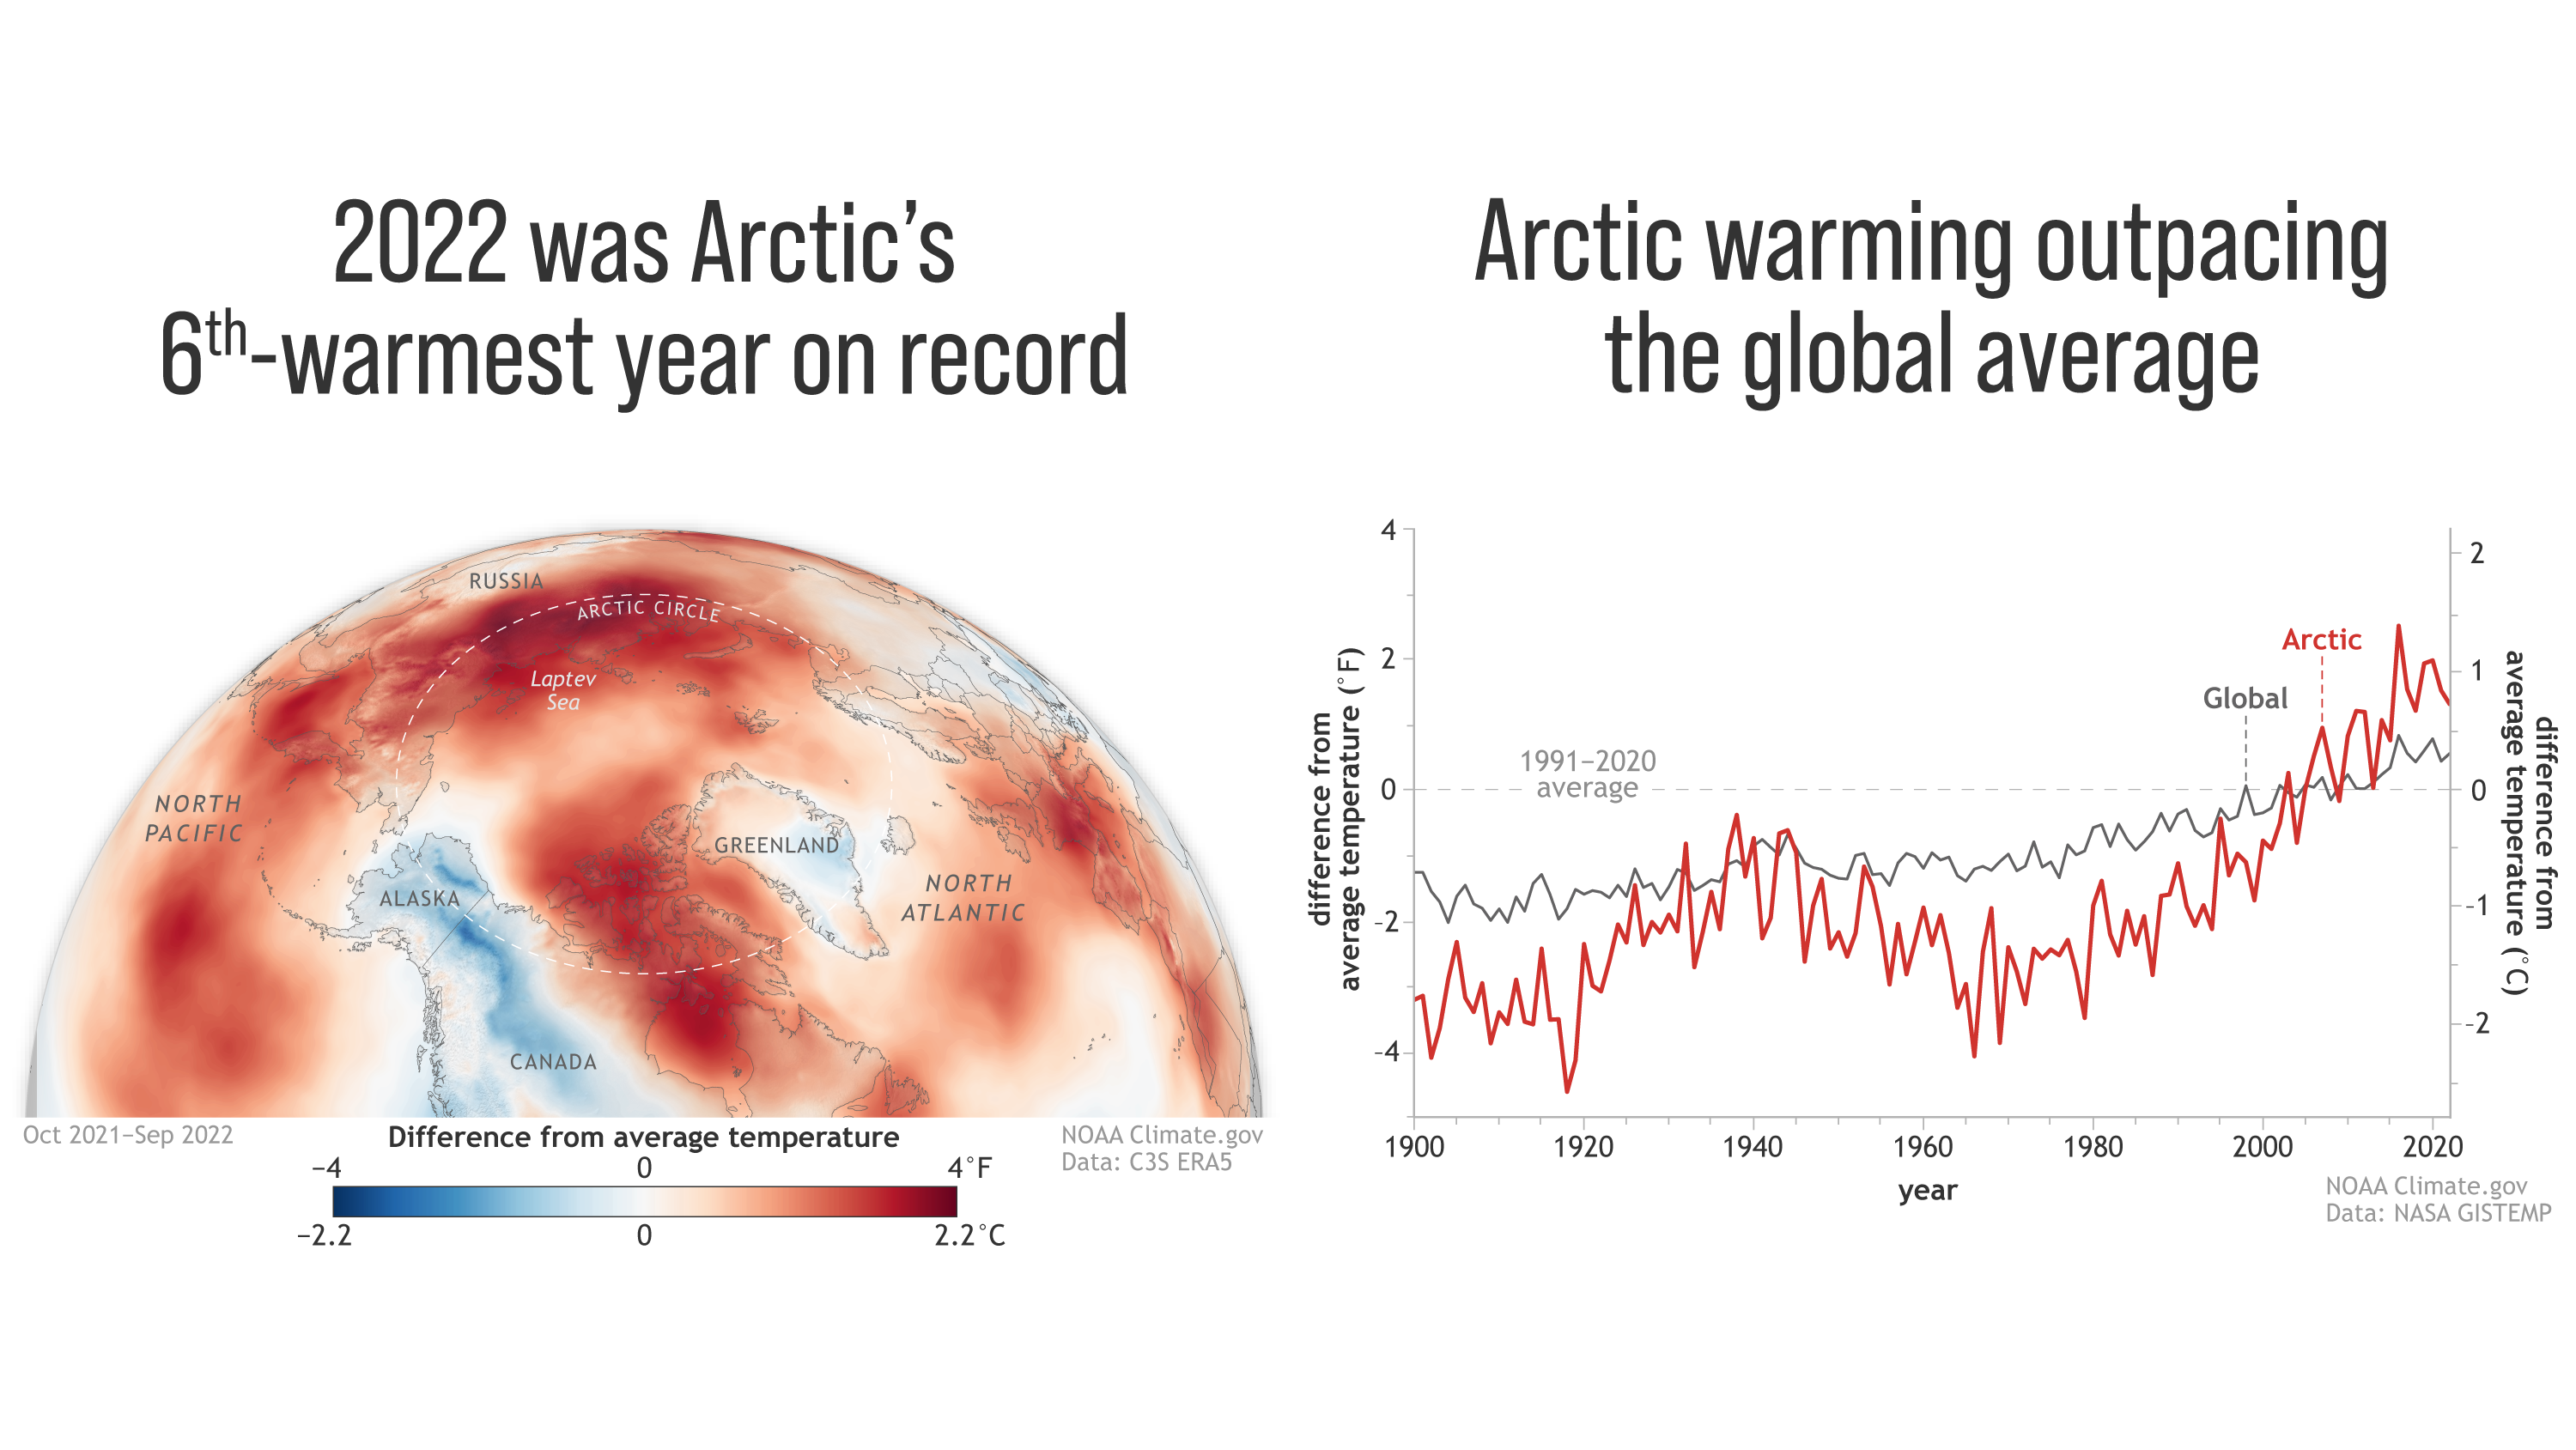
13 December 2022 (NOAA) – A typhoon, smoke from wildfires, and increasing rain are not what most imagine when thinking of the Arctic. Yet these are some of the climate-driven events included in NOAA’s 2022 Arctic Report Card, which provides a detailed picture of how warming is reshaping the once reliably frozen, snow-covered region which […]
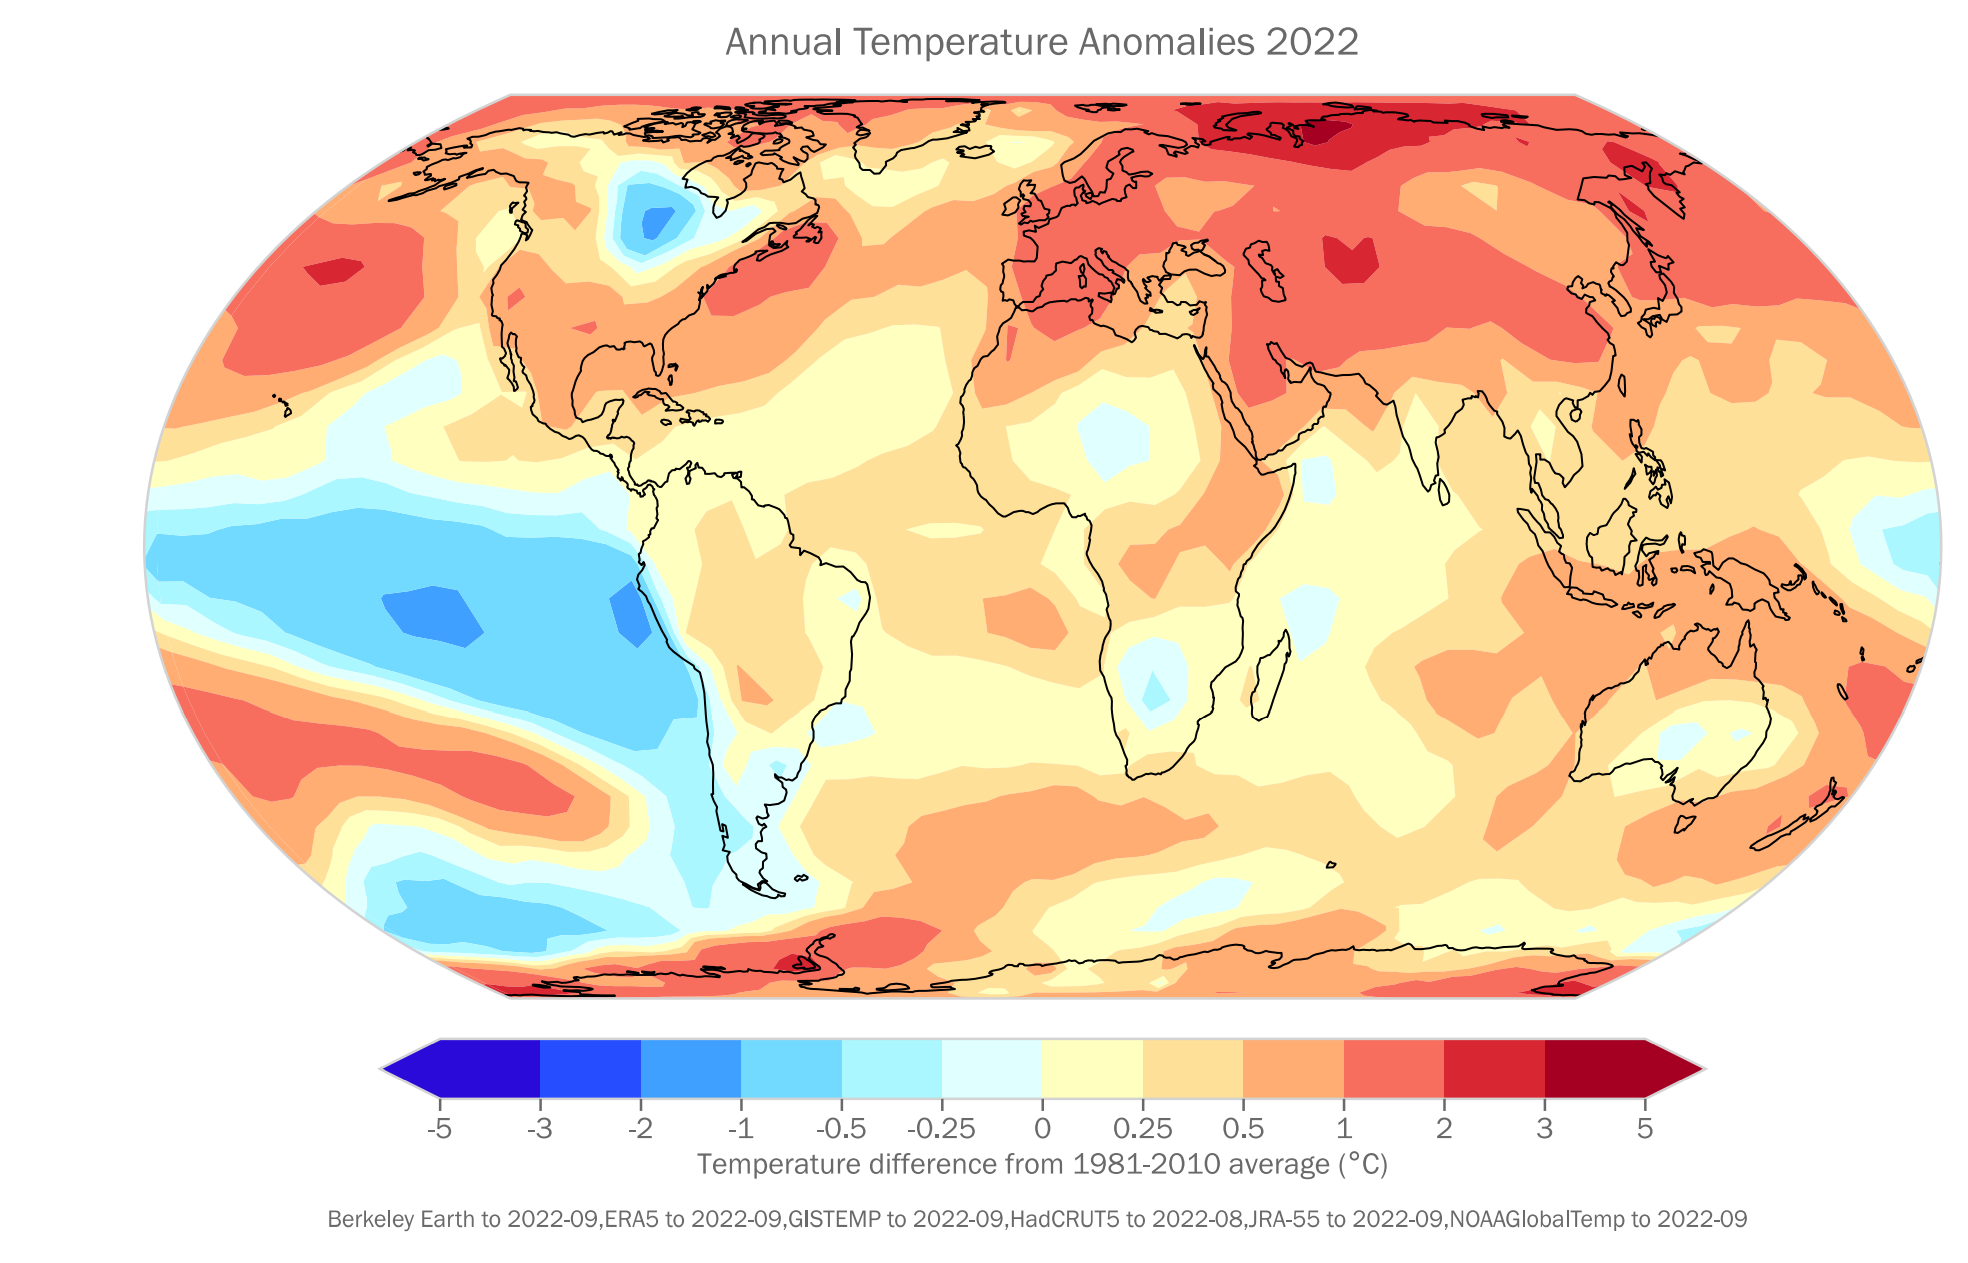
By Seth Borenstein 6 November 2022 SHARM EL-SHEIKH, Egypt (AP) – Earth’s warming weather and rising seas are getting worse and doing so faster than before, the World Meteorological Organization warned Sunday in a somber note as world leaders started gathering for international climate negotiations. [Eight warmest years on record witness upsurge in climate change impacts –Des] […]
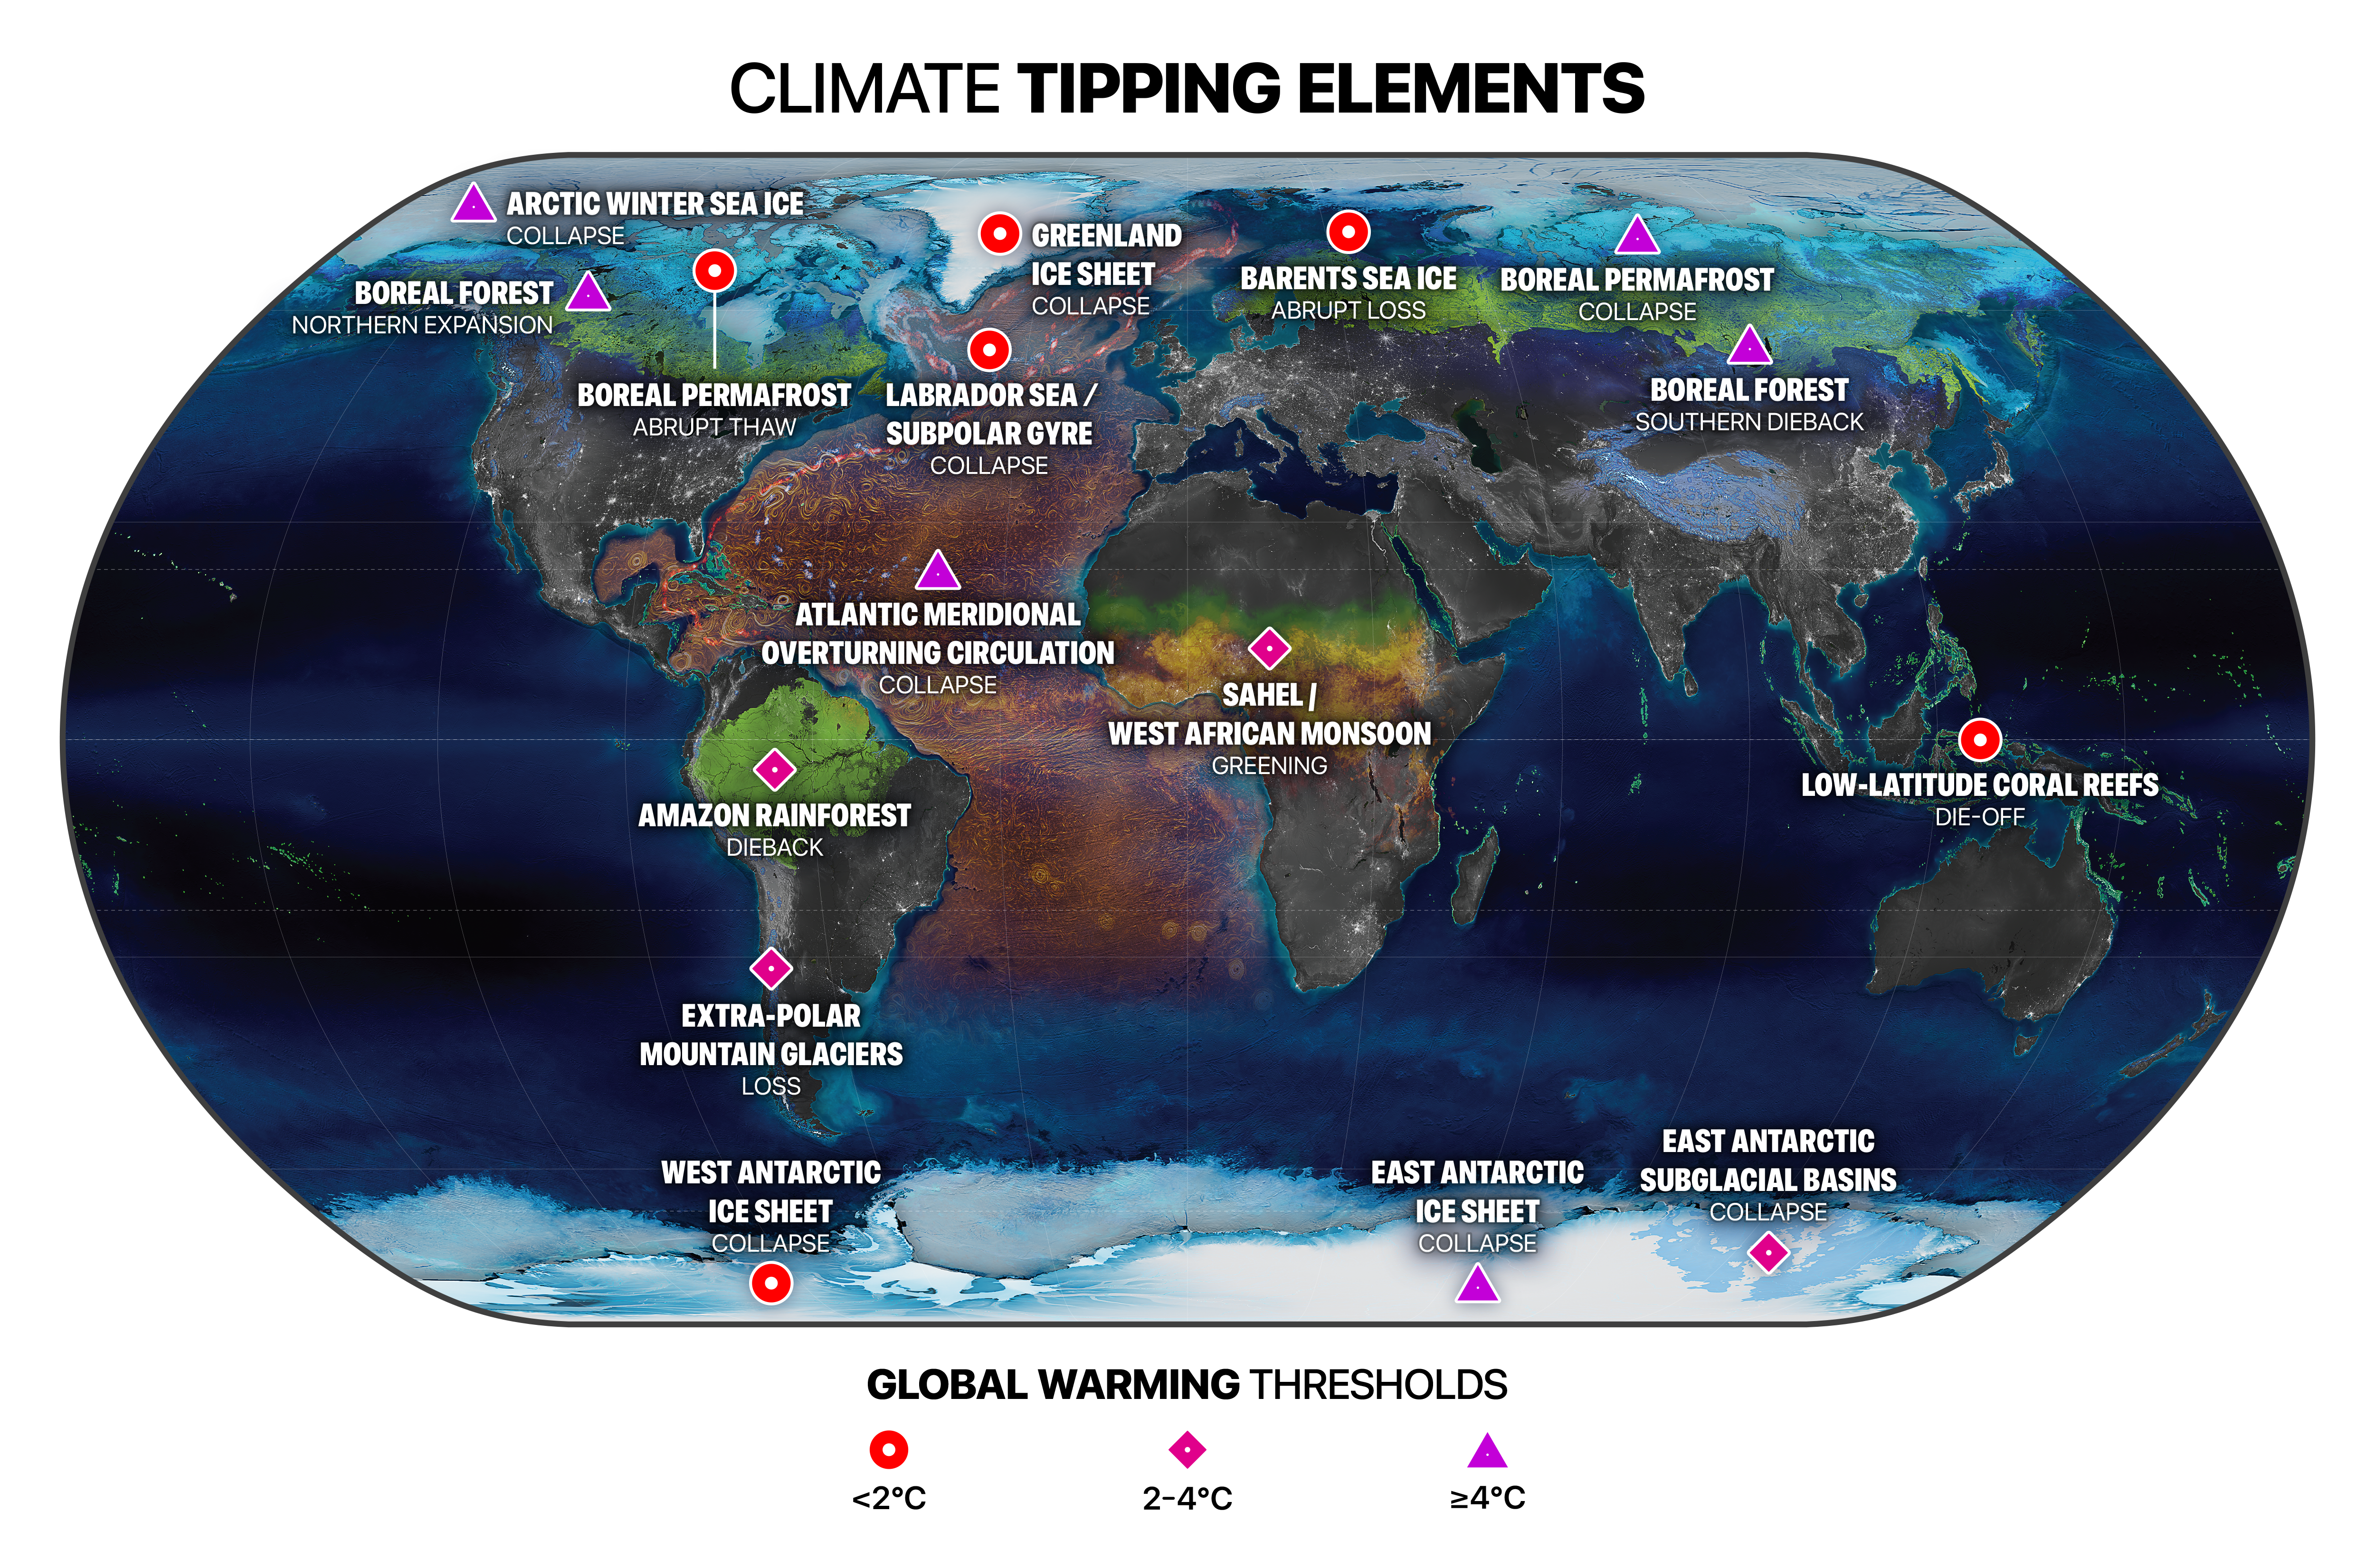
8 September 2022 (Stockholm Resilience Centre) – Multiple climate tipping points could be triggered if global temperature rises beyond 1.5°C above pre-industrial levels, according to a major new analysis published in the journal Science. Even at current levels of global heating the world is already at risk of passing five dangerous climate tipping points, and risks […]
14 December 2021 (BBC News) – The highest temperature ever recorded in the Arctic, 38C (100F), has been officially confirmed, sounding “alarm bells” over Earth’s changing climate. The World Meteorological Organization (WMO) on Tuesday verified the record, reported in the Siberian town of Verkhoyansk on 20 June last year. The temperature was 18C higher than […]
AMHERST, Massachusetts, 15 December 2021 (University of Massachusetts Amherst) – New research from the University of Massachusetts Amherst provides a novel answer to one of the persistent questions in historical climatology, environmental history and the earth sciences: what caused the Little Ice Age? The answer, we now know, is a paradox: warming. The Little Ice […]
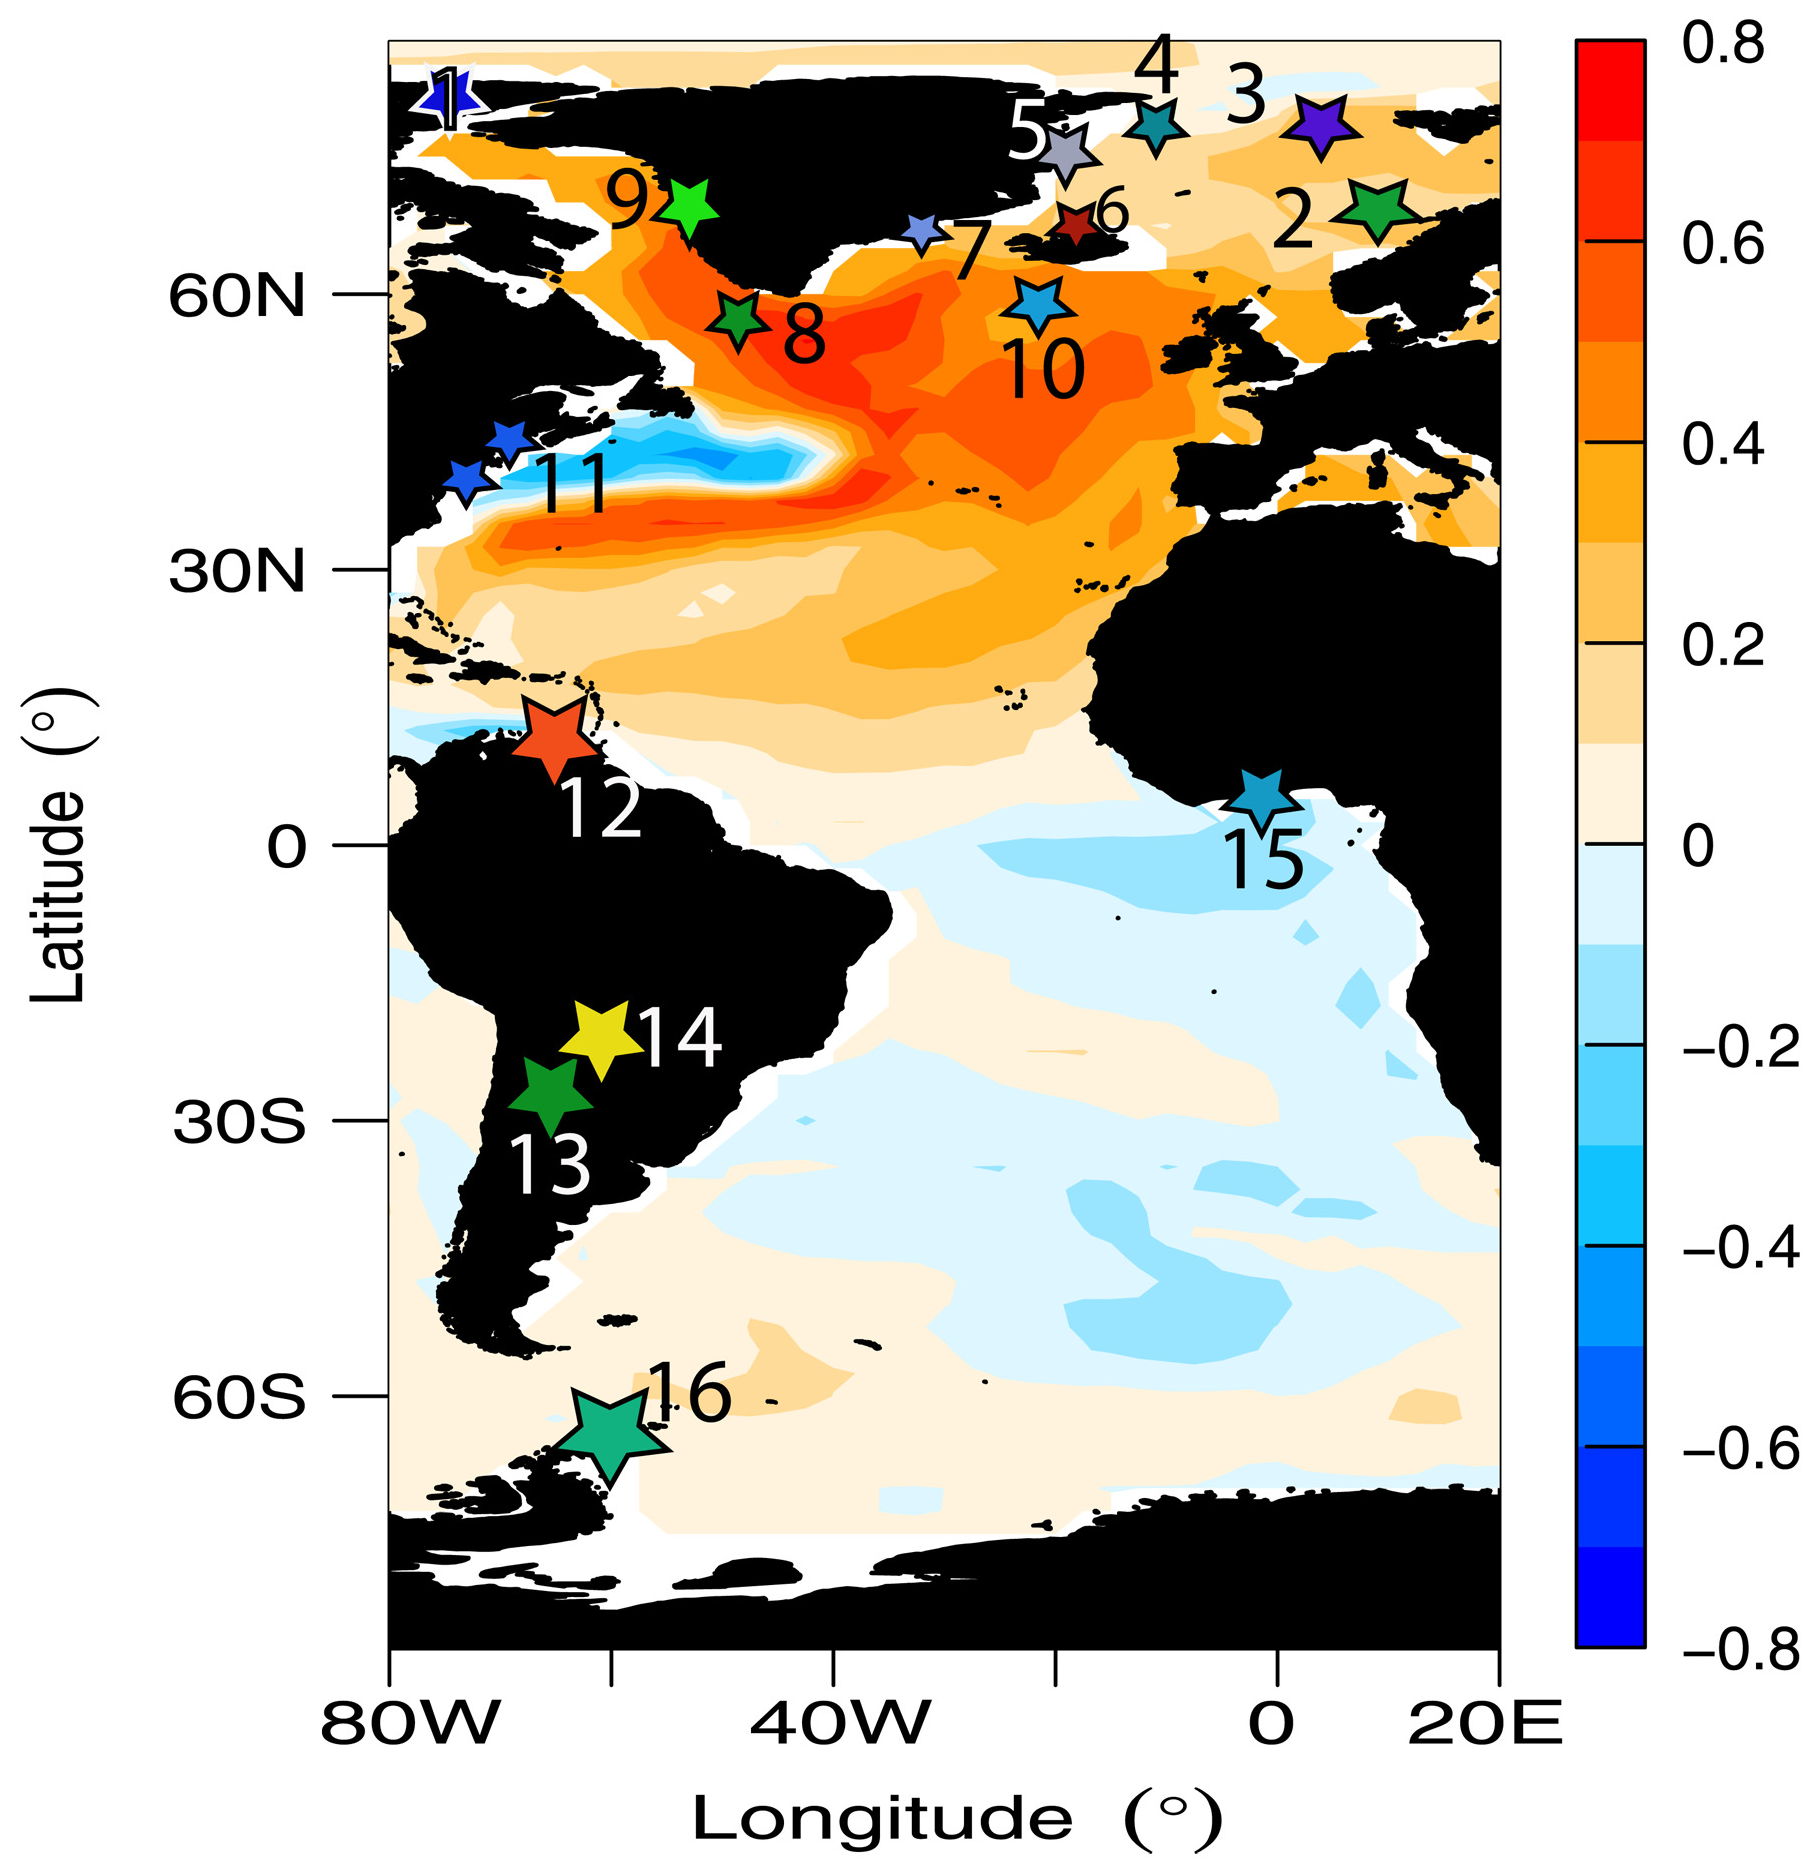
By T. A. Moon, M. L. Druckenmiller, and R. L. Thoman 6 December 2021 (NOAA) – As the influences of human-caused global warming continue to intensify, with the Arctic warming significantly faster than the globe overall, the 2021 Arctic Report Card (ARC2021) brings a broad view of the state of the Arctic climate and environment. […]
By Patrick Galey 23 June 2021 (AFP) – Hunger, drought and disease will afflict tens of millions more people within decades, according to a draft UN assessment that lays bare the dire human health consequences of a warming planet. After a pandemic year that saw the world turned on its head, a forthcoming report by […]
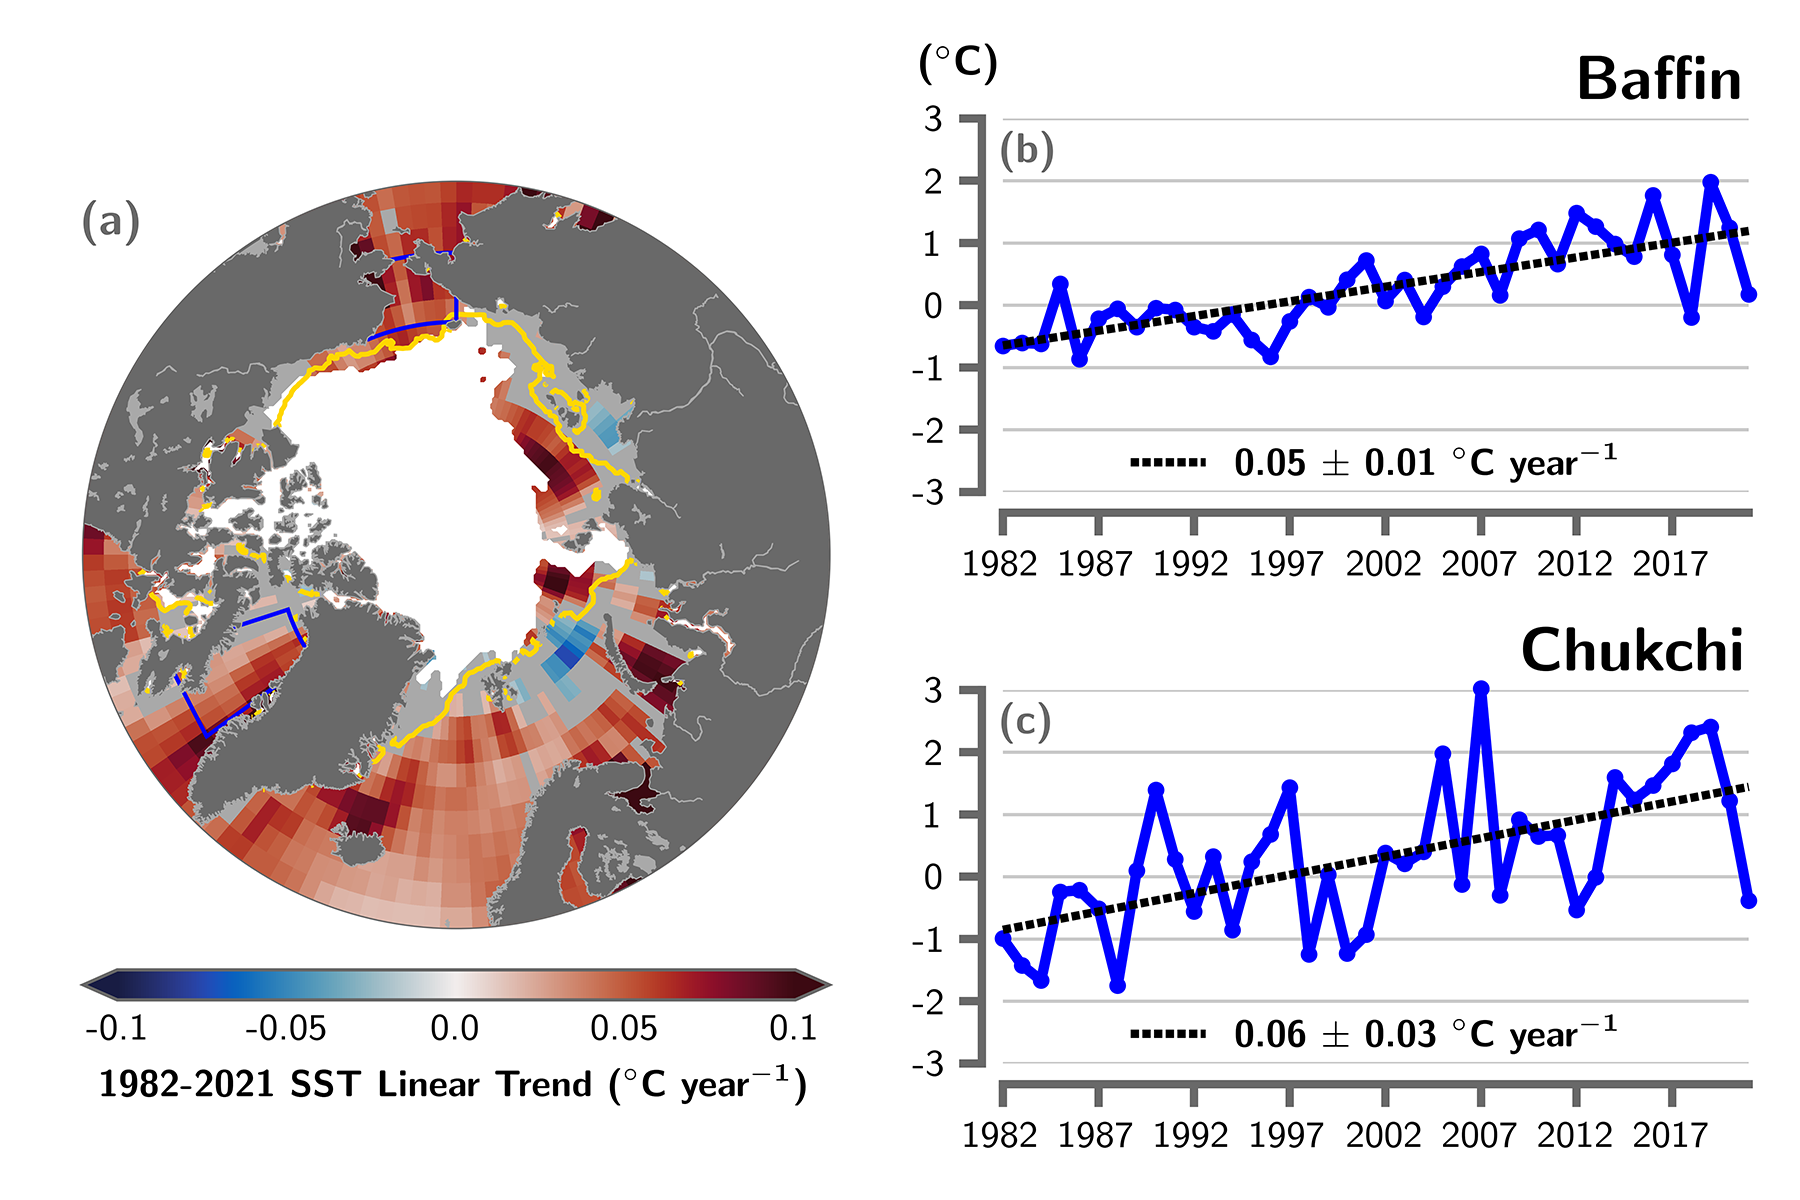
8 December 2020 (NOAA) – NOAA’s 15th Arctic Report Card catalogs for 2020 the numerous ways that climate change continues to disrupt the polar region, with second-highest air temperatures and second-lowest summer sea ice driving a cascade of impacts, including the loss of snow and extraordinary wildfires in northern Russia. The Arctic Report Card is […]
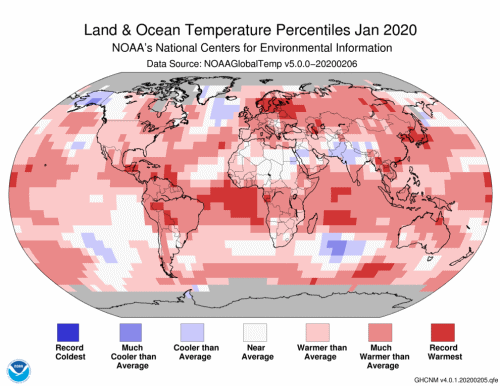
13 February 2020 (NCEI) – The globally averaged temperature departure from average over land and ocean surfaces for January 2020 was the highest for the month of January in the 141-year NOAA global temperature dataset record, which dates back to 1880. This monthly summary, developed by scientists at NOAA National Centers for Environmental Information, is […]
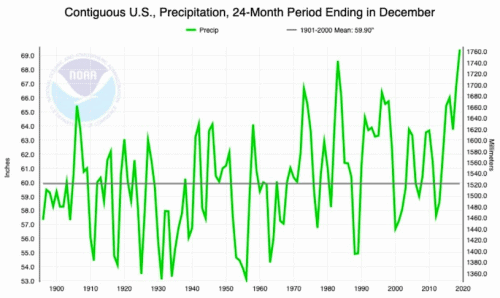
By Bob Henson 8 January 2020 (Weather Underground) – Capping a spectacularly soggy period that spanned parts of two calendar years, the contiguous United States saw its second wettest year on record in 2019, according to NOAA’s annual summary issued on Wednesday. The national average temperature wasn’t especially hot by recent standards, but there were […]