NOAA’s 2021 Arctic Report Card: Rapid and pronounced warming continues to drive the evolution of the Arctic environment
By T. A. Moon, M. L. Druckenmiller, and R. L. Thoman
6 December 2021
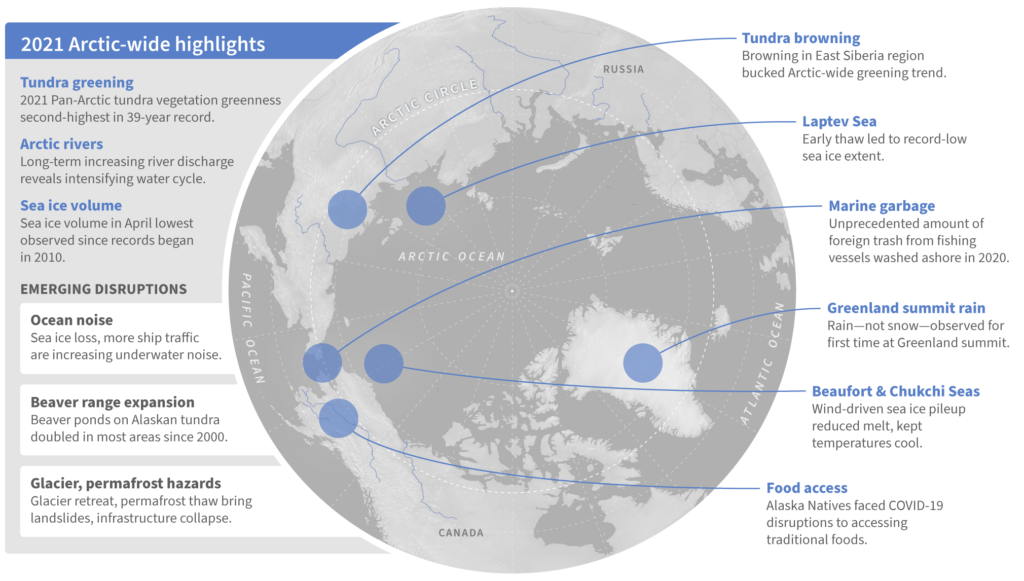
(NOAA) – As the influences of human-caused global warming continue to intensify, with the Arctic warming significantly faster than the globe overall, the 2021 Arctic Report Card (ARC2021) brings a broad view of the state of the Arctic climate and environment. The ARC2021 provides an update on seven Arctic Vital Signs, from sea ice to snow and air temperatures to tundra greenness, and it checks in on three Indicator topics for updates on river discharge, ocean acidification, and observations of substantial Arctic beaver expansion. The noteworthy emerging topics in the four ARC2021 Frostbites—marine debris, marine noise, food access during the COVID-19 pandemic, and glacier and permafrost hazards—share a common link as they look at the impacts of more people and human activity in the Arctic as well as the challenges and hazards people face with the rapidly changing cryosphere. The scientific and observational story of the Arctic is a human story—of climate change, of increased shipping and industrial activity, and of communities responding to local and regional disruptions.
Rapid and pronounced warming continues to drive the evolution of the Arctic environment. As a connected system, links are visible across the many metrics and observations reported within the ARC2021. The past year (October 2020-September 2021) was the seventh warmest over Arctic land since the record began in 1900. Pan-Arctic and Asian Arctic surface air temperatures set new record highs during Autumn 2020 (October-December), and especially warm surface air temperatures returned over northern Eurasia in spring 2021. This spring warming was notable for the Laptev Sea, which experienced early onset of sea ice melt and retreat that supported record low sea ice extent for the area during May and June. Eurasian Arctic snow cover extent was also particularly low in May and June 2021, representing the 5th and 3rd lowest values on record since 1967.
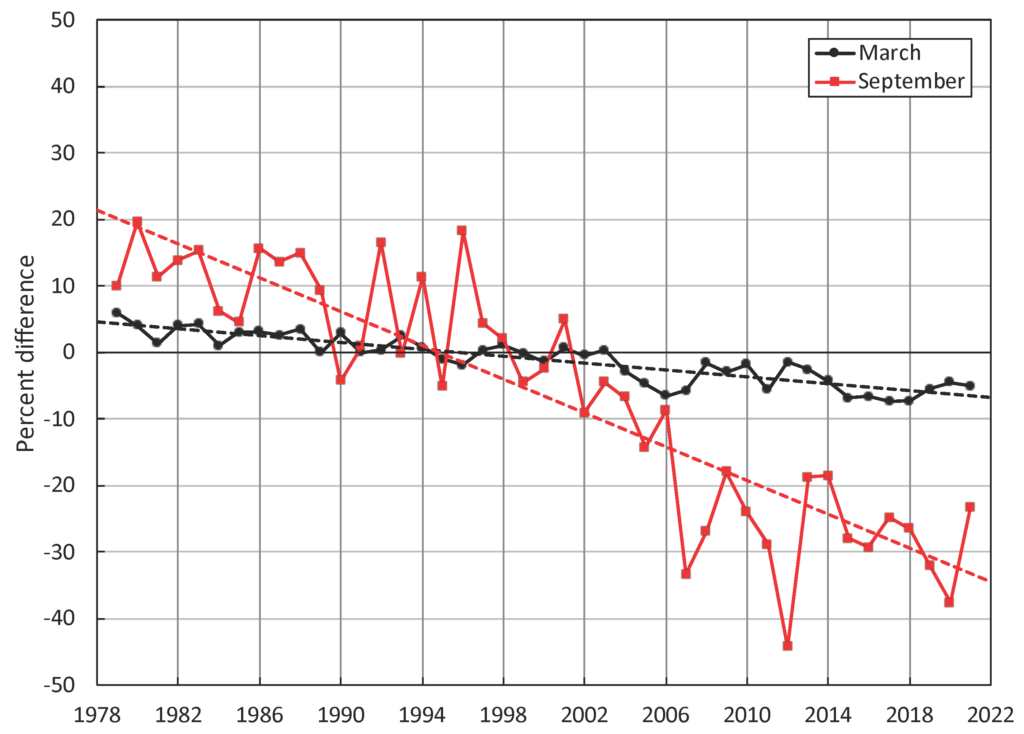
While frozen landscapes—sea ice, land ice, permafrost, and snow—may be hallmarks of the Arctic system, the transition of ice to water and intensification of hydrologic cycles are increasingly important issues. Arctic river discharge, a landscape-level integrator of precipitation, melt, and thaw, maintains a long-term increasing trend. Signs of seasonal change are also abundant, and dates that would historically have had precipitation fall as snow are experiencing precipitation as rain. The summer 2020 snow-free period across Eurasia was the longest since records began in 1998. During summer 2021, the Greenland ice sheet experienced three extreme melt events. The last heatwave, during August 2021, was the latest date of an extreme melt event within the 43-year satellite record. This event also brought the first observations of substantial rainfall to the highest Greenland ice sheet elevations at Summit Station, the long-term observatory and research station established in 1989. Unusual events are also evident across seasons. April 2021 saw the lowest post-winter sea ice volume since records began in 2010, likely influenced by an atypical lull in sea ice expansion during March-April, historically a time of continued ice growth. In September the amount of multi-year ice remaining was the second lowest on record (since 1985).
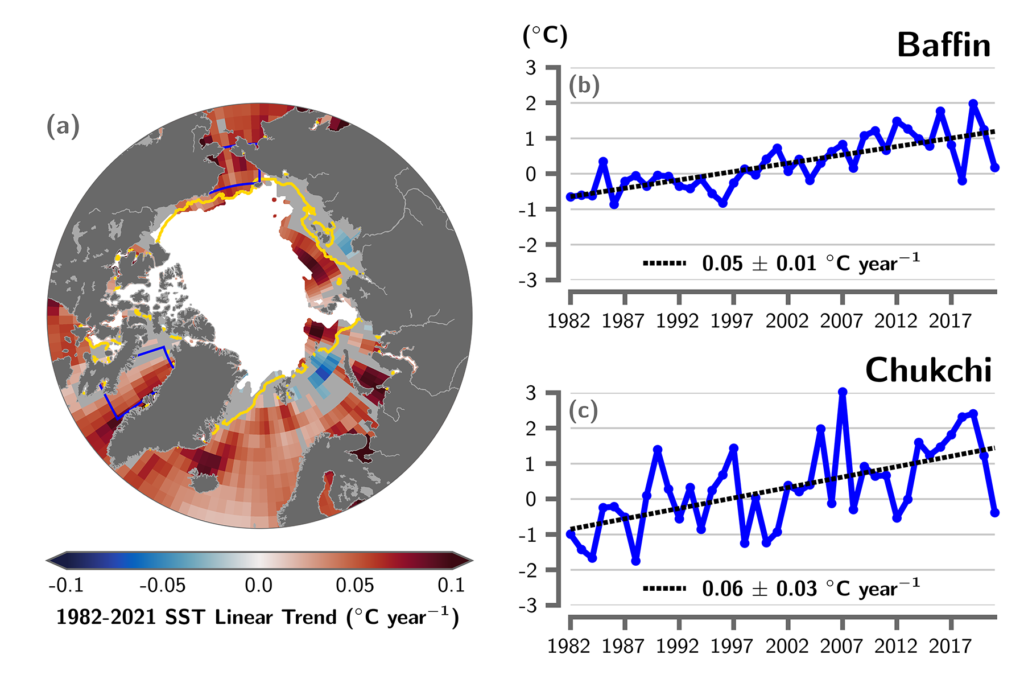
Environmental observations throughout the Arctic highlight important connections across seasons. Early spring 2021 sea ice loss in the Laptev Sea may have contributed to the high sea surface temperatures observed there during August, in parallel with warm sea surface temperatures in the Kara Sea and east of Greenland. In contrast, sea ice was advected into the Beaufort and Chukchi Seas during winter and spring, creating a late and limited sea ice retreat in the region. August sea surface temperatures in the Chukchi Sea were lower than normal, as well as in the northern Barents Sea and Baffin Bay.
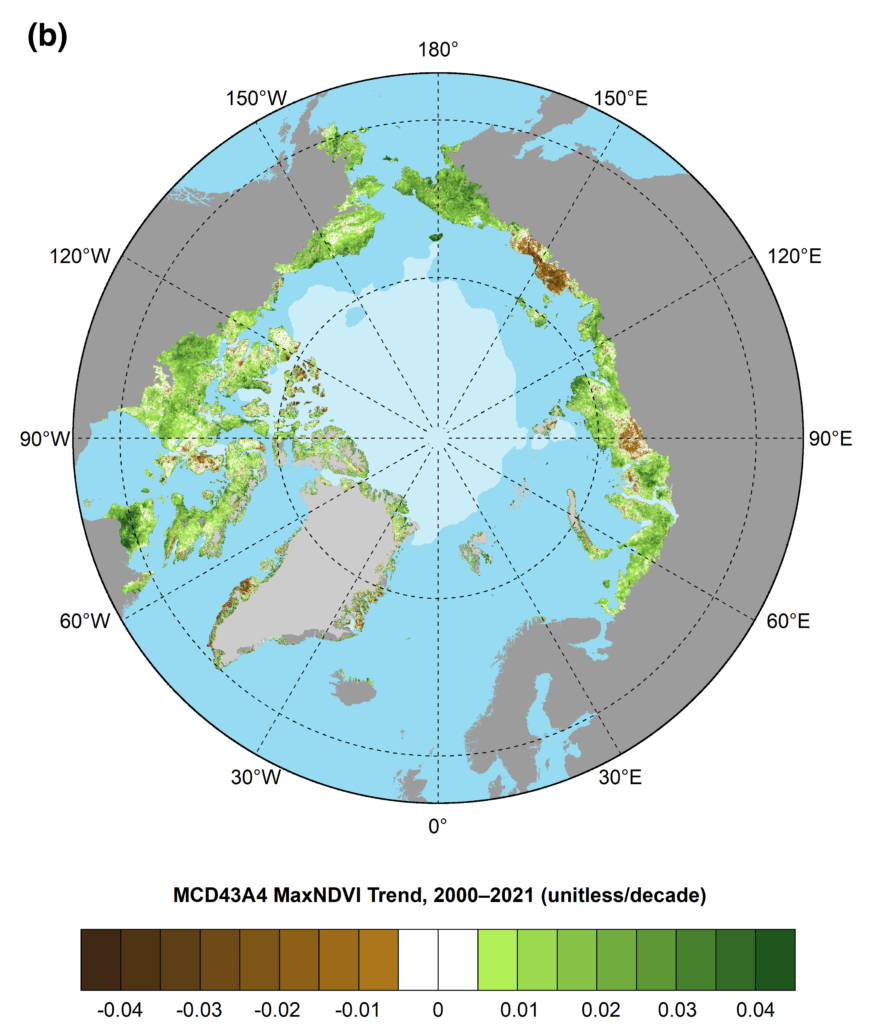
Extreme events and amplified local processes indicate an Arctic of increasing regional and temporal variability. For example, while 2021 was yet another year of exceptionally high tundra greenness, extreme events and other local influences (e.g., permafrost thaw, pest outbreaks, or wildfires) are also creating more frequent local browning events. In another example, annual ocean primary productivity in 2021 was high (compared to the 2003-20 mean) for seven of nine Arctic study regions. Yet May 2021 data revealed a ~1700 km long swath of low chlorophyll-a concentrations stretching from the Greenland to Barents Seas.
As the Arctic transforms, science in some cases is running to keep up. The added carbon in the atmosphere is warming the air and waters, and likely acidifying the Arctic Ocean faster than the global ocean. Facing difficulties to measure acidification in situ, researchers are striving not only to make more robust autonomous field instruments but also to enhance the theoretical and computer modeling infrastructure that assists in addressing this important change across such a vast and challenging ocean.
With research revealing new complex changes, collaborative groups are pushing for more coordination to communicate observations, impacts, and understanding across researchers, Arctic communities, agencies, and a range of stakeholders. The connections between physical environmental change and human impact are immutable, and rapid change demands new structures for people to work together across scales and institutions. As local observers and remote sensing scientists found a doubling of North American beaver ponds in Alaska since 2000, they came together to establish an Arctic Beaver Observation Network that can aid collaboration, research, and information sharing. Natural hazard events that threaten lives and infrastructure are also increasing as glaciers melt and permafrost thaws. Researchers are in the early stages of understanding and projecting these events and are seeking routes to better inform stakeholders and affected communities.
The COVID-19 pandemic also brought disruption, for example, amplifying Alaska Natives’ challenges in accessing traditional and store-bought foods. Indigenous cultural strengths, such as food sharing, were able to reduce stresses on food security. Yet when subsistence harvests are closed due to animal population concerns, Alaska Native communities are not only impacted financially, but also culturally, socially, and spiritually. Within an essay contributed by members of the Indigenous Foods Knowledges Network (IFKN) and across other ARC2021 essays, there’s a clear need to reduce future harm in part by expanding the decision-making table, increasing Indigenous and local-Arctic research, management, and input.
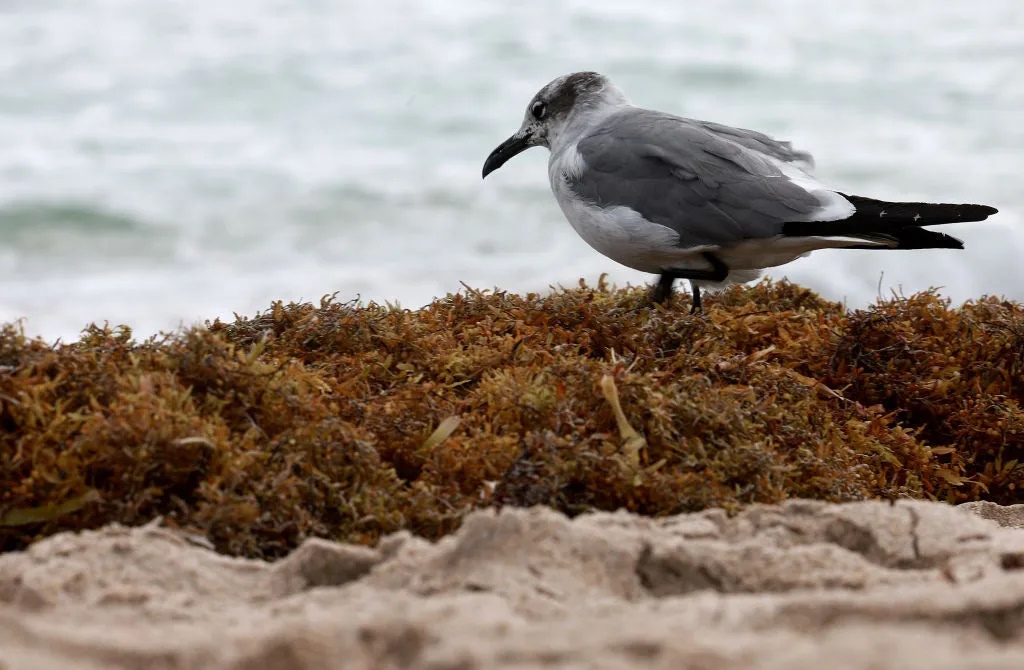
Declining sea ice extent and shifting marine habitats are also bringing increased ship traffic to the Arctic. The uptick in human activity along with environmental change is altering the marine soundscape. The full scope of impacts is not yet known, though research indicates that marine mammal communication may drop and stress levels increase as the sound wavelengths animals use for communication are overlaid with human-produced sounds. Arctic marine traffic is also implicated in a widespread marine debris event that brought extensive garbage ashore within the Bering Strait region in 2020. Alaska residents in the Bering Strait region found excessive trash with foreign language labeling—a reminder that Arctic issues are international issues. Local Arctic residents are often required to carry the heaviest burden of dealing with the impacts for which they bear little to no responsibility. Responding to environmental changes, managing increasing human activities, and improving future outcomes will require attention and efforts at multiple levels of government, across communities and organizations, and amongst Arctic and non-Arctic countries.
The challenges of a changing Arctic are formidable. Yet the collaborative efforts apparent across ARC2021 essays give us hope that people from across communities are increasingly forging new relationships and connections that can help to understand, adapt to, and mitigate the challenges ahead. The Arctic story is a human story, and we all have a role to play in creating the best possible outcomes for the region, its residents, and all the citizens of the globe who depend on the Arctic as a critical component of our Earth system.