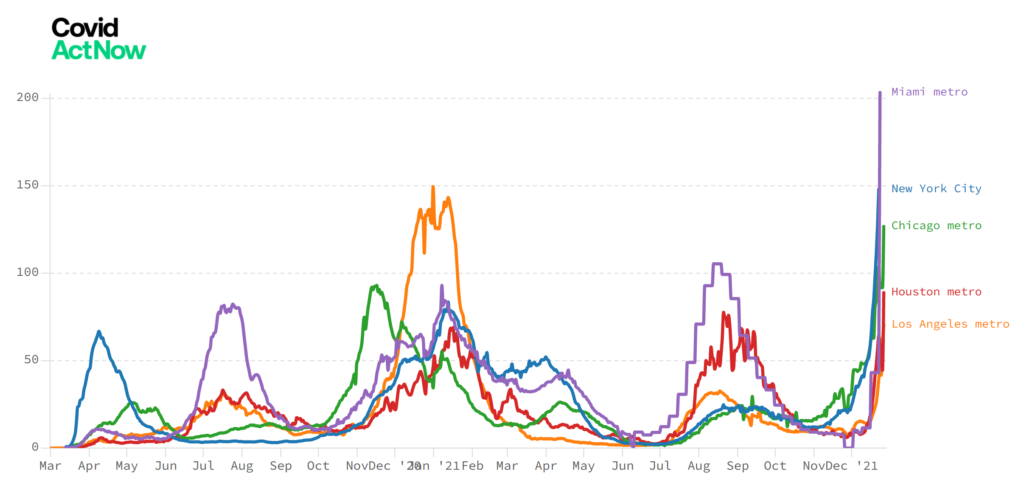
COVID-19 daily cases per 100,000 people in five U.S. metropolitan areas, 27 December 2021. The five cities shown are Chicago, Houston, Los Angeles, Miami, and New York City. Graphic: Covid Act Now

28 December 2021 (Desdemona Despair) – Bill Gates tweeted, “Just when it seemed like life would return to normal, we could be entering the worst part of the pandemic.”

In a seven-tweet thread, he went on to say that the Omicron variant “is spreading faster than any virus in history” and it “will be the worst surge we have seen so far because it’s so infectious.”

Dr. Anthony Fauci warned, “Every day it goes up and up. The last weekly average was about 150,000, and it likely will go much higher.”

The holiday data-delay is over, and we’re starting to get the latest case rates from counties around the U.S. In several places, the case-rate spike is steeper and higher than during any previous wave, in some counties dwarfing previous peaks. It seems Bill Gates and Dr. Fauci were right, and we’re seeing the predicted increases now. And these numbers don’t yet reflect the Christmas infections that surely happened all over the country.

The new numbers arrive just as recent NIH research shows that the COVID-19 virus spreads within days from the airways to the heart, brain, and most other organs, where it lingers for months, based on analysis of tissues taken during autopsies on 44 patients who died after contracting the coronavirus in 2020.
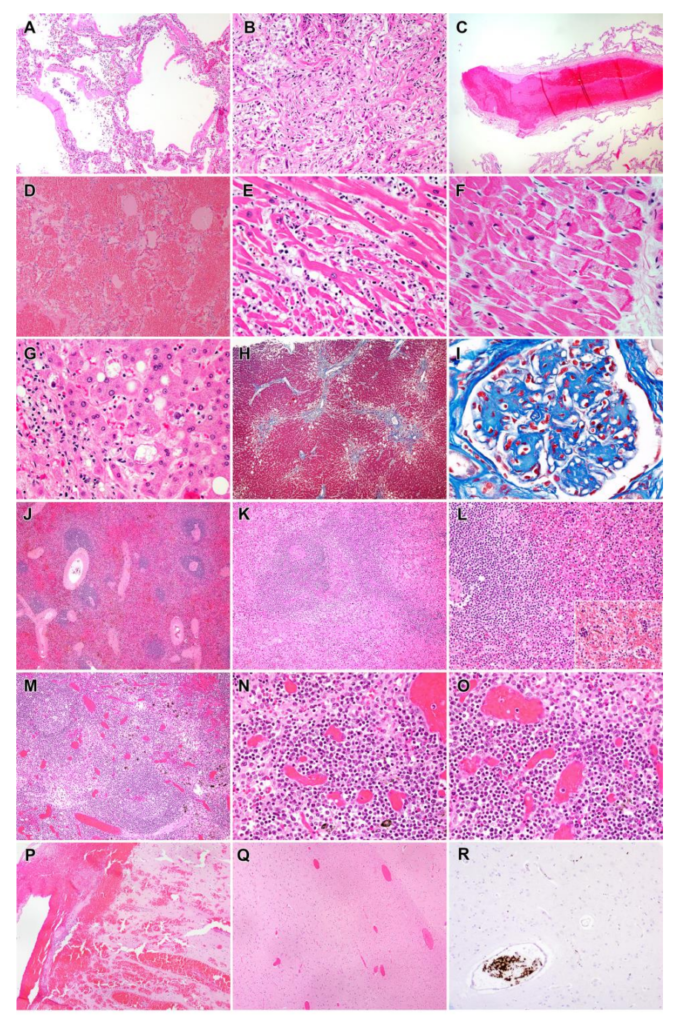
Representative findings in patients in the COVID-19 cohort. A. Lung, Subject P22. Exudative phase diffuse alveolar damage with hyaline membranes and mild interstitial inflammation (H&E, 100x). B. Lung, Subject P26. Proliferative phase diffuse alveolar damage and sparse inflammation. (H&E, 200x). C. Lung, Subject P22. Organizing thrombus in medium sized pulmonary artery. (H&E, 40x). D. Lung, Subject P28. Diffuse pulmonary hemorrhage. (H&E, 100x). E. Heart, Subject P3. Active lymphocytic myocarditis with cardiomyocyte necrosis. (H&E, 400x). F. Heart, Subject P38. Microscopic focus of bland myocardial contraction band necrosis. (H&E, 400x). G. Liver, Subject P41. Steatohepatitis with mild steatosis and scattered ballooned hepatocytes. (H&E, 400x), H. Liver, Subject P41. Focal bridging fibrosis involving central hepatic veins. (Masson trichrome, 40x). I. Kidney, Subject P16. Nodular glomerulosclerosis. (Masson trichrome, 600x). J. Spleen, Subject P16. Preservation of white pulp and congestion (H&E, 40x) K. Spleen, Subject P14. Lymphoid depletion of white pulp with proteinaceous material and red pulp congestion. (H&E, 100x) L. Spleen, Subject P34. Relative preservation of white pulp with extramedullary hematopoiesis (inset) in red pulp (H&E, 200x) M. Lymph node, Subject P25. Follicular hyperplasia with well-defined follicles. (H&E) N. Lymph node, Subject P25. Marked plasmacytosis in the medullary cord. (H&E, 400x) O. Lymph node, Subject P25. Marked plasmacytosis and sinus histiocytosis. (H&E, 400x) P. Brain, Subject P35, Focal subarachnoid and intraparenchymal hemorrhage. (H&E, 40x) Q. Brain, Subject P44, Vascular congestion. (H&E, 40x) R. Brain, Subject P43, Intravascular platelet aggregates. (anti-CD61 stain, 100x) Photo: Chertow, et al., 2021 / NIH / Nature

“Our results collectively show that while the highest burden of SARS-CoV-2 is in the airways and lung, the virus can disseminate early during infection and infect cells throughout the entire body, including widely throughout the brain,” the authors wrote in their paper, titled SARS-CoV-2 infection and persistence throughout the human body and brain.

If you’re looking for guidance on how to handle this newest wave, you could do worse than following the advice of Andy Slavitt, former White House Sr Advisor for COVID Response, in this thread:

“For me, my baseline is to advocate for policies that favor those with the fewest choices—Require vaccines when in crowds; preserve best anti-virals for immunocompromised; support frontline health care workers by reducing spread. 2022 will have twists and turns but we have many tools we should use to both minimize death and maximize living. Certainty seems like the only sure mistake.”

The U.S. isn’t the only nation suffering through another record-breaking wave of infection. France, the U.K., Spain, and Switzerland are seeing case rates that are far higher than during previous waves. Interestingly, the Netherlands (green curve in the following graph) has experienced a high, sharp peak already and may be seeing the end of the Omicron wave. Similar sharp peaks have occurred recently in Denmark and Southeast Europe.
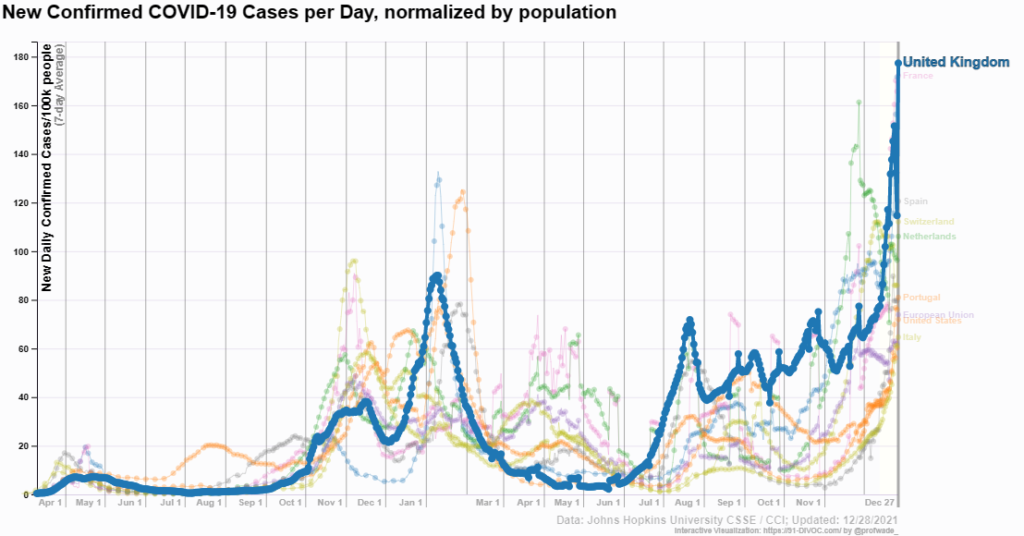
Top Ten countries with highest COVID-19 case rates, 28 December 2021, showing new confirmed COVID-19 daily cases per 100,000 population. The U.K. is highlighted. Data: John Hopkins University. Graphic: 91-DIVOC

Here’s a quick tour of the COVID-19 landscape in America at the end of 2021, courtesy of Covid Act Now. It’s worth noting that some of the steepest increases are occurring in the most highly vaccinated counties, so some of the increases may be attributable to elevated testing rates among the most Covid-conscious populations.

Northern Mariana Islands, 27 December 2021
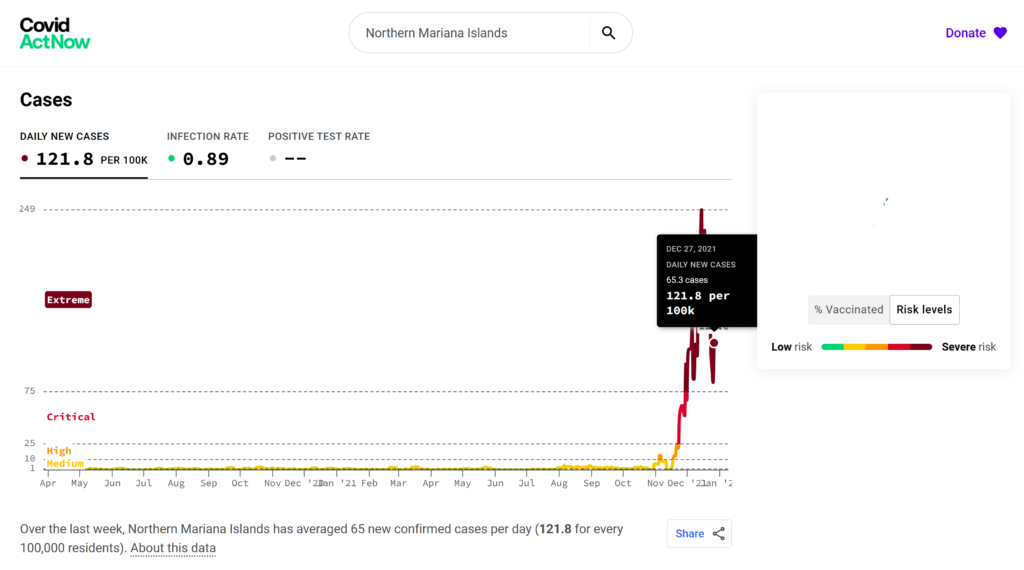
COVID-19 daily cases per 100,000 in Northern Mariana Islands, 27 December 2021. Graphic: Covid Act Now

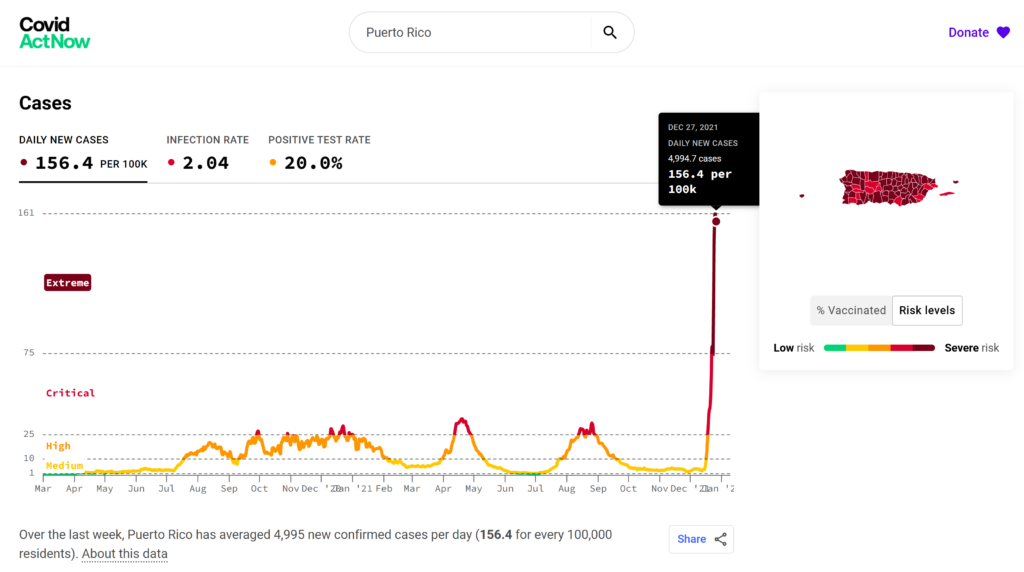
Puerto Rico, 27 December 2021

COVID-19 daily cases per 100,000 in Puerto Rico, 27 December 2021. Graphic: Covid Act Now

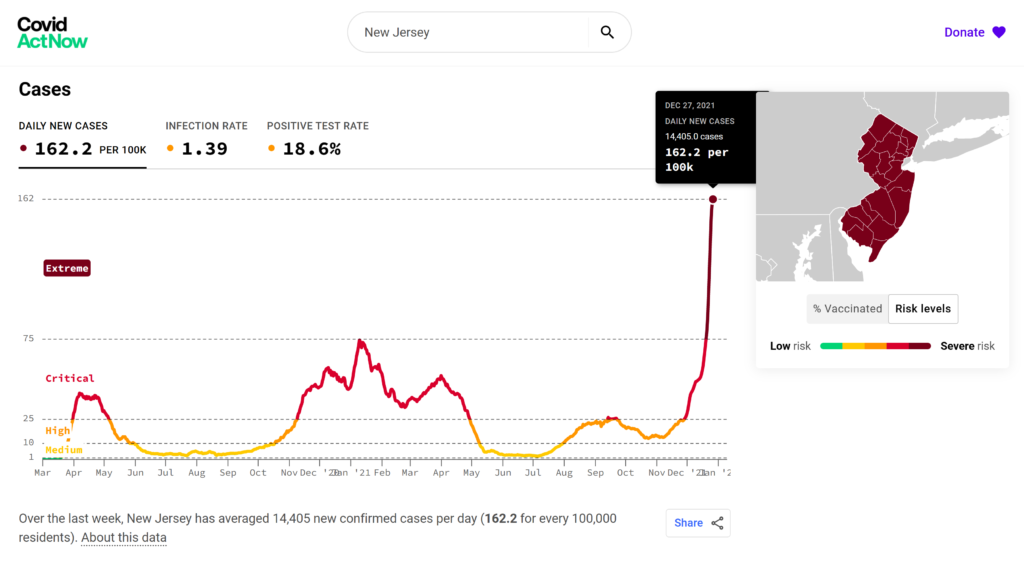
New Jersey, 27 December 2021

COVID-19 daily cases per 100,000 in New Jersey, 27 December 2021. Graphic: Covid Act Now

King County, Washington, 27 December 2021
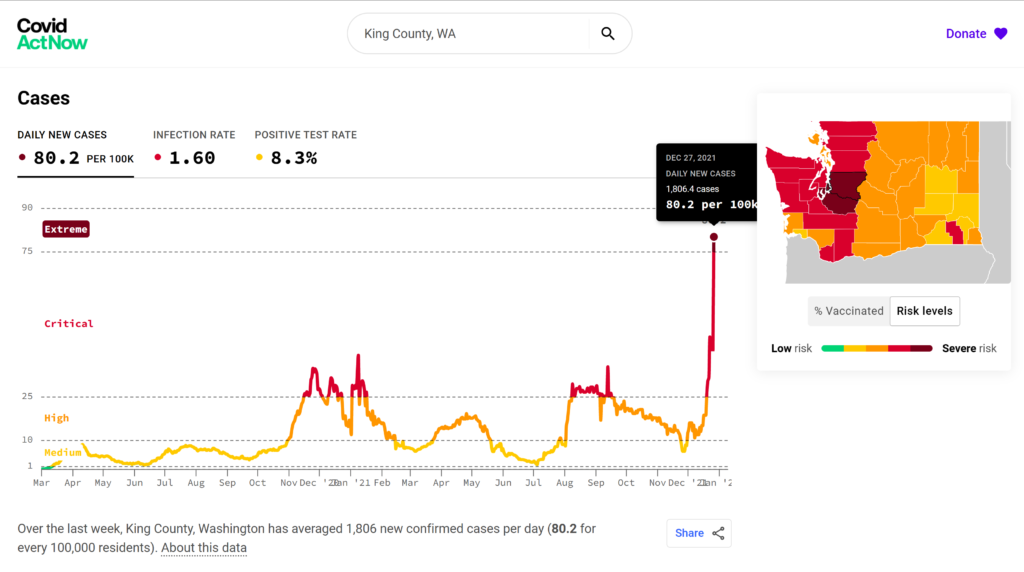
COVID-19 daily cases per 100,000 in King County, Washington, 27 December 2021. Graphic: Covid Act Now

New York County, New York, 23 December 2021
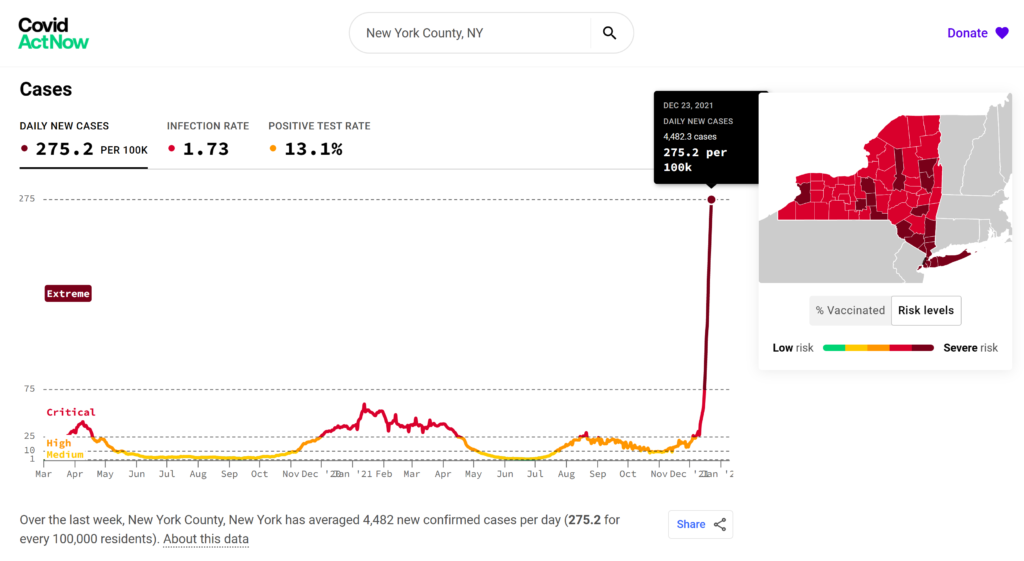
COVID-19 daily cases per 100,000 in New York County, New York, 23 December 2021. Graphic: Covid Act Now

Honolulu County, Hawaii, 27 December 2021
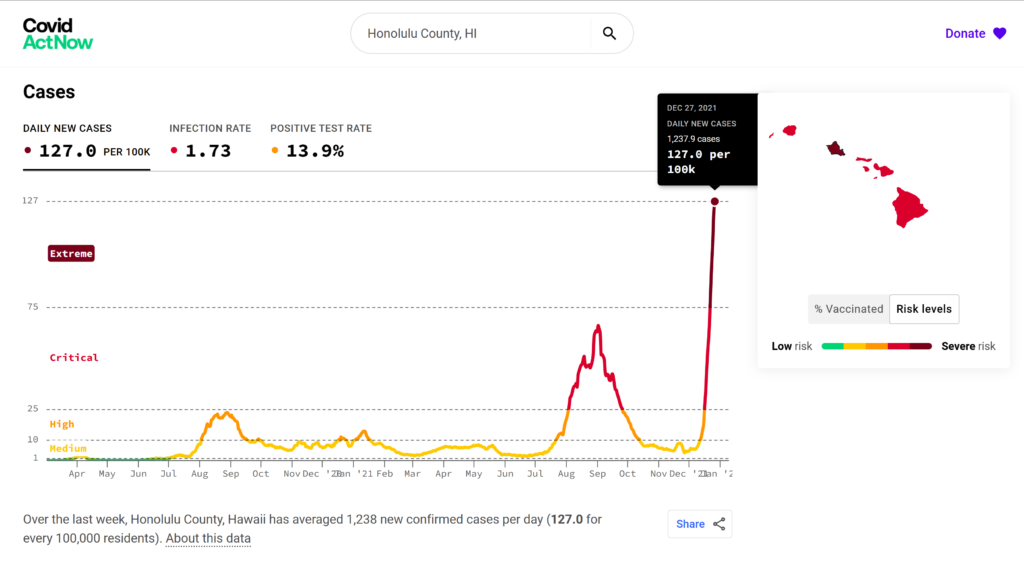
COVID-19 daily cases per 100,000 in Honolulu County, Hawaii, 27 December 2021. Graphic: Covid Act Now

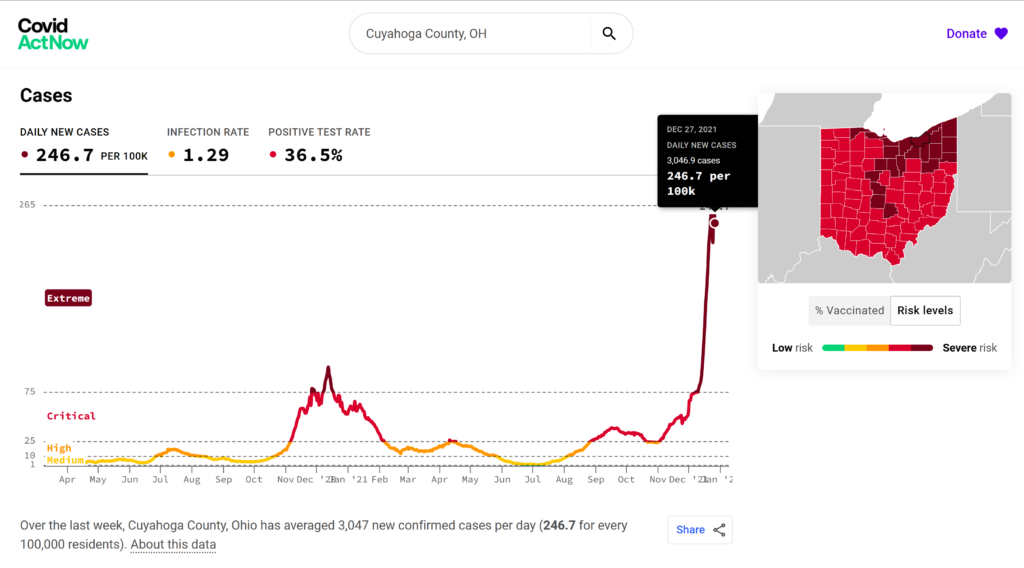
Cuyahoga County, Ohio, 27 December 2021

COVID-19 daily cases per 100,000 in Cuyahoga County, Ohio, 27 December 2021. Graphic: Covid Act Now

Franklin County, Pennsylvania, 27 December 2021
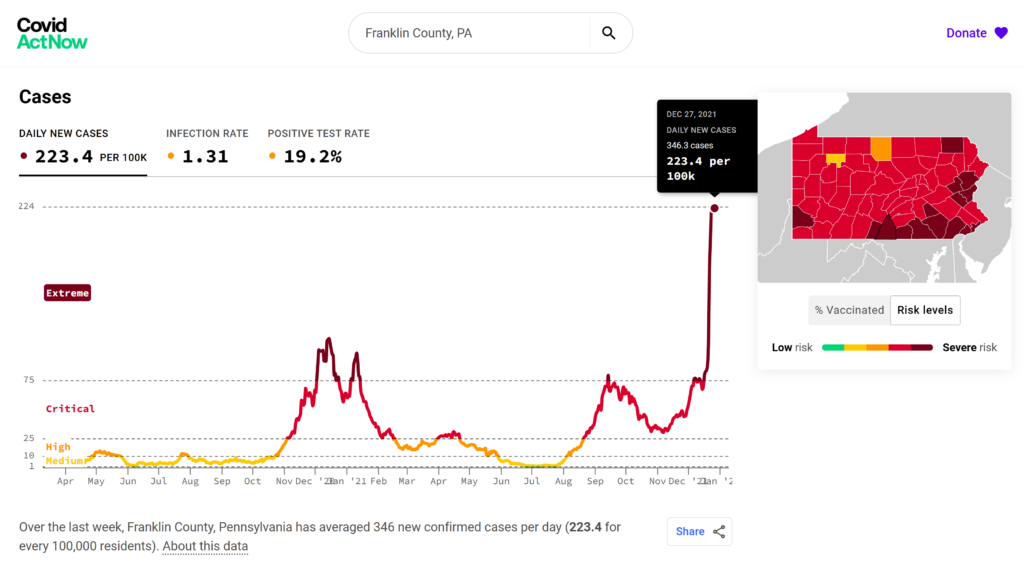
COVID-19 daily cases per 100,000 in Franklin County, Pennsylvania, 27 December 2021. Graphic: Covid Act Now

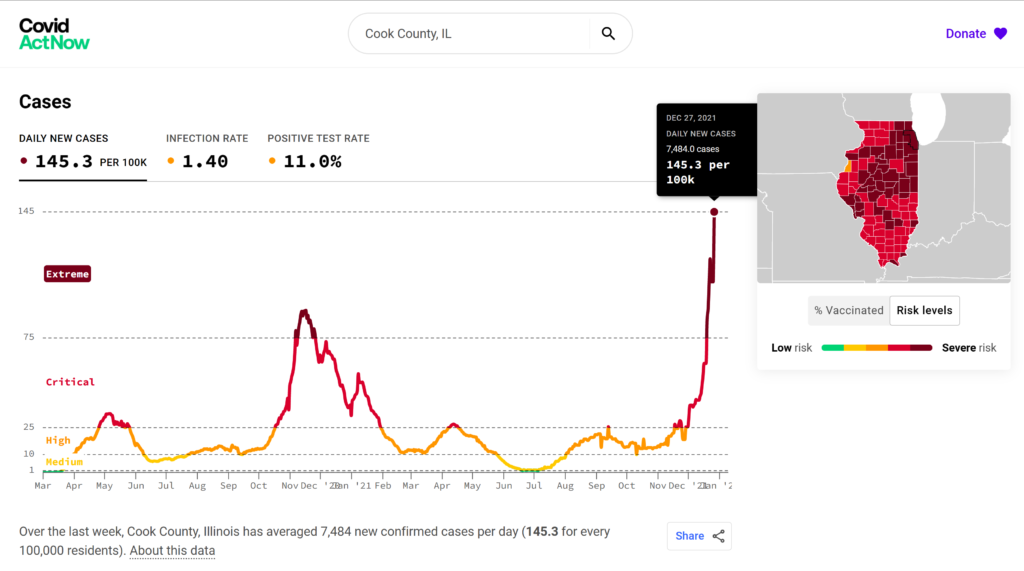
Cook County, Illinois, 27 December 2021

COVID-19 daily cases per 100,000 in Cook County, Illinois, 27 December 2021. Graphic: Covid Act Now

Fulton County, Georgia, 27 December 2021
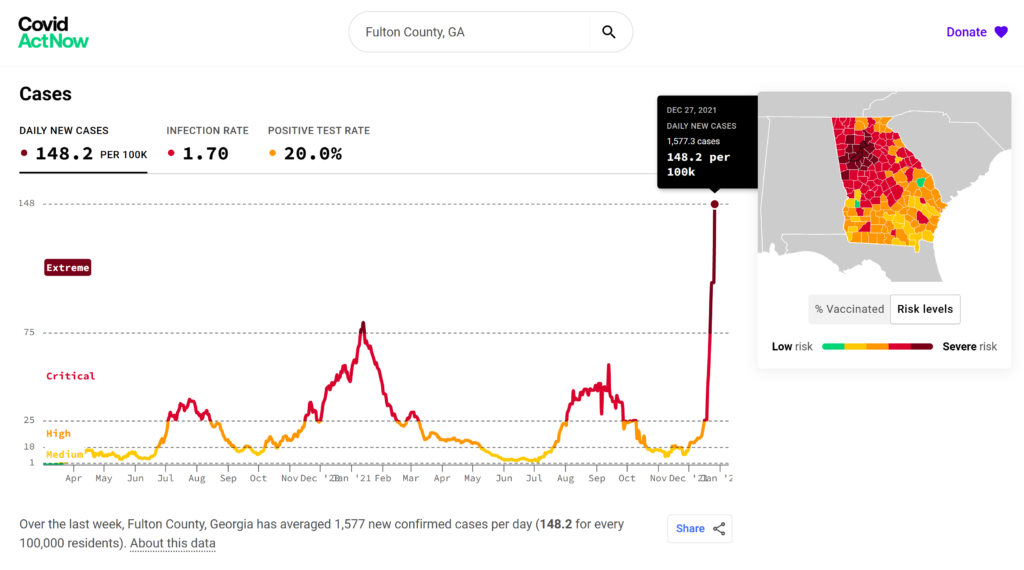
COVID-19 daily cases per 100,000 in Fulton County, Georgia, 27 December 2021. Graphic: Covid Act Now

Broward County, Florida, 24 December 2021
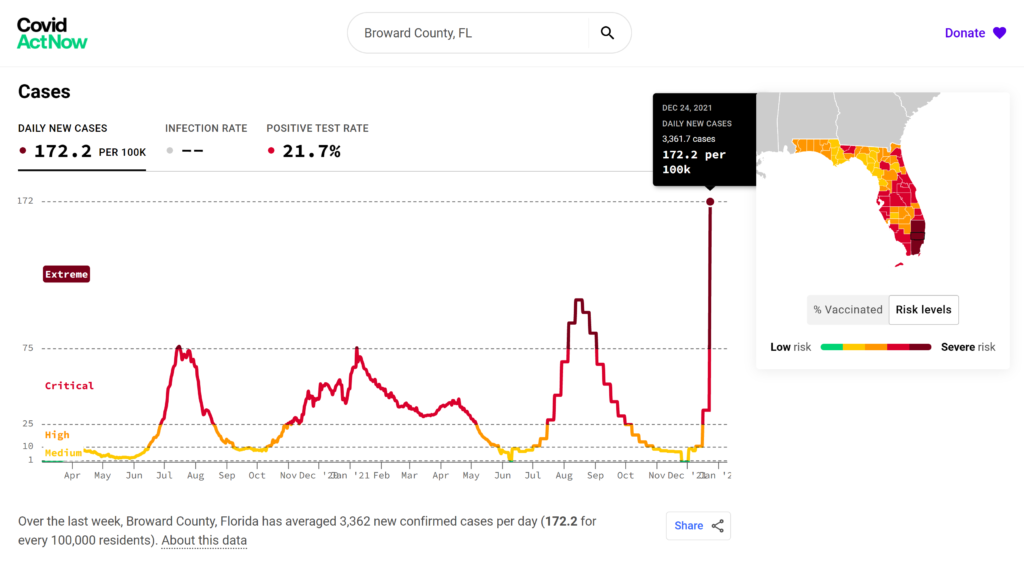
COVID-19 daily cases per 100,000 in Broward County, Florida, 24 December 2021. Graphic: Covid Act Now

Miami-Dade County, Florida, 24 December 2021
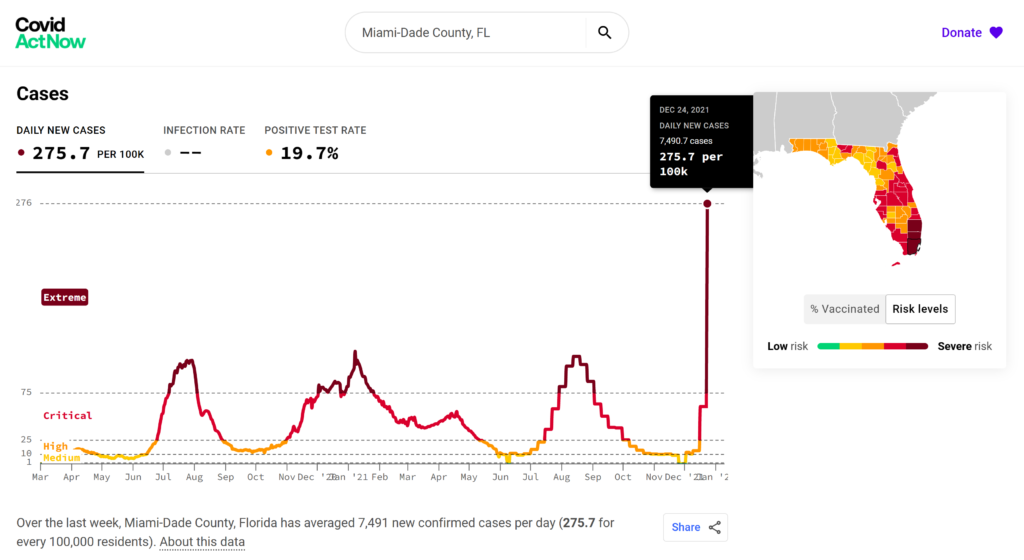
COVID-19 daily cases per 100,000 in Miami-Dade County, Florida, 24 December 2021. Graphic: Covid Act Now

Covid Act Now