Researchers are discovering “zombie forests” in new places across the western U.S. – “Our maps force some critical – and difficult – conversations about how to manage impending ecological transitions”
By Brendan O’Leary
13 May 2023
(The Cool Down) – It’s no secret that our warming atmosphere has resulted in extreme weather all over the world, but there’s also a less noticeable consequence at work as well. Rising ambient temperatures mean that thousands of coniferous forests in California will be unable to replenish their numbers once they die.
What exactly is a “zombie forest”?
A “zombie forest” refers to a group of trees (usually a specific species) that are unable to effectively produce new saplings and seedlings due to a warming climate.
This problem tends to be regional, and California specifically has seen an increasing number of these so-called zombie forests. Thousands of ponderosa pines, sugar pines, and Douglas fir trees will eventually be replaced with species of trees that are better suited to a hotter planet.
In the Sierra Nevada region, it is estimated that at least a fifth of these coniferous trees are now unsuited for the region’s increasing temperature. And even in best-case scenarios, the number of these trees living “outside their climate” is likely to double in 77 years.
![Observed elevation shifts in temperature, precipitation, and conifers across the study area between 80 years. The elevation distribution of modern conifers (top panel, dark green; mean = 1,884 m, SD = 640 m) was 34 m higher (95% CI = [25 m, 43 m]) than the 1930s conifers (top panel, light blue). This average shift in elevation was far less (by 145 m; 95% CI = [135 m, 156 m]) than the up-slope shift in the nominal 7–12°C Mean Annual Temperature envelope of Sierra Nevada low-elevation conifers (182 m; 95% CI = [179 m, 187 m]) (10). Note that the Mean Temperature envelope of Sierra Nevada low-elevation conifers would be shifted approximately 1°C cooler, if calculated based on the vegetation distribution in the Wieslander survey. Mean Annual Precipitation (bottom panel) decreased between the two time periods at most elevations—more-so at higher elevations—and the average elevation of the MAP envelope of Sierra low-elevation conifers decreased by 37 m (95% CI = [27 m, 49 m]). Circles represent samples with measurement error randomly introduced, and solid lines represent the averages across 10 samples. Vertical dashed lines show the total mean for the time period. Graphic: Hill, et al., 2023 / PNAS Nexus](https://desdemonadespair.net/wp-content/uploads/2023/05/image-31.png)
Why is this happening?
The burning of coal, oil, and gas to power our cities and vehicles is to blame for the endless record-breaking temperatures all over the globe. When these dirty fuels are burned for energy, they release polluting gases into the atmosphere. Once there, they trap excessive heat from the sun, and thus, the temperature of Earth increases.
Is there anything to be done?
States and local governments can create forest management strategies that can hopefully mitigate the harm that may emerge from these forests dying off.
Beyond that, switching our energy sources from dirty fuels like oil, coal, and gas to renewable sources like solar panels and wind farms can help. Additionally, nuclear reactors could also help offset the demand for oil and gas.
Stanford-led study reveals a fifth of California’s Sierra Nevada conifer forests are stranded in habitats that have grown too warm for them
By Rob Jordan
28 February 2023
(Stanford Woods Institute for the Environment) – Like an old man suddenly aware the world has moved on without him, the conifer tree native to lower elevations of California’s Sierra Nevada mountain range finds itself in an unrecognizable climate. A new Stanford-led study reveals that about a fifth of all Sierra Nevada conifer forests – emblems of Western wilderness – are a “mismatch” for their regions’ warming weather. The paper, published 28 February 2023 in PNAS Nexus, highlights how such “zombie forests” are temporarily cheating death, likely to be replaced with tree species better adapted to the climate after one of California’s increasingly frequent catastrophic wildfires.
“Forest and fire managers need to know where their limited resources can have the most impact,” said study lead author Avery Hill, a graduate student in biology at Stanford’s School of Humanities & Sciences at the time of the research. “This study provides a strong foundation for understanding where forest transitions are likely to occur, and how that will affect future ecosystem processes like wildfire regimes.” Hill led a related study this past November showing how wildfires have accelerated the shifting of Western trees’ ranges.
Understanding and managing zombie forests
Sierra Nevada conifers, such as ponderosa pine, sugar pine, and Douglas fir are among Earth’s tallest and most massive living things. They have stood watch as temperatures around them warmed by an average of a little over 1 degree Celsius or 2 degrees Fahrenheit since the 1930s. Meanwhile, recent years have seen a giant wave of new human residents drawn to the lower elevations of the Sierra Nevada by spectacular scenery, relaxed lifestyles, and relative affordability. The combination of hotter weather, more construction, and a history of fire suppression have fueled increasingly destructive wildfires, making the names of communities like Paradise and Caldor synonymous with Mother Nature’s fury.
Hill and his co-authors started by combing through vegetation data going back 90 years, when the vast majority of human-caused warming had yet to occur. Fed this information, a computer model designed by the researchers showed that the mean elevation of conifers has shifted 34 meters or almost 112 feet upslope since the 1930s, while the temperatures most suitable for conifers have outclimbed the trees, shifting 182 meters or nearly 600 feet upslope on average. In other words, the speed of change has outpaced the ability of many conifers to adapt or shift their range, making them highly vulnerable to replacement, especially after stand-clearing wildfires.
The study estimates that about 20% of all Sierra Nevada conifers are mismatched with the climate around them. Most of those mismatched trees are found below an elevation of 2,356 meters or 7,730 feet. The prognosis: even if global heat-trapping pollution decreases to the low end of scientific projections, the number of Sierra Nevada conifers no longer suited to the climate will double within the next 77 years.
“Given the large number of people who live in these ecosystems and the wide range of ecosystem services they confer, we should be looking seriously at options for protecting and enhancing the features that are most important,” said study co-author Chris Field, the Perry L. McCarty Director of the Stanford Woods Institute for the Environment within the Stanford Doerr School of Sustainability.
The study’s first-of-its-kind maps paint a picture of rapidly changing landscapes that will require more adaptive wildfire management that eschews suppression and resistance to change for the opportunity to direct forest transitions for the benefit of ecosystems and nearby communities. Similarly, conservation and post-fire reforestation efforts will need to consider how to ensure forests are in equilibrium with future conditions, according to the researchers. Should a burned forest be replanted with species new to the area? Should habitats that are predicted to go out of equilibrium with an area’s climate be burned proactively to reduce the risk of catastrophic blazes and corresponding vegetation conversion?
“Our maps force some critical – and difficult – conversations about how to manage impending ecological transitions,” said Hill. “These conversations can lead to better outcomes for ecosystems and people.”
Contact
- Chris Field, Stanford Woods Institute for the Environment: (650) 823-5326; cfield@stanford.edu
- Avery Hill, Stanford School of Humanities & Sciences: (707) 363-0168; aph82@stanford.edu
- Bridget Ballesteros, University Public Relations: (925) 759-4805; bballesteros@stanford.edu
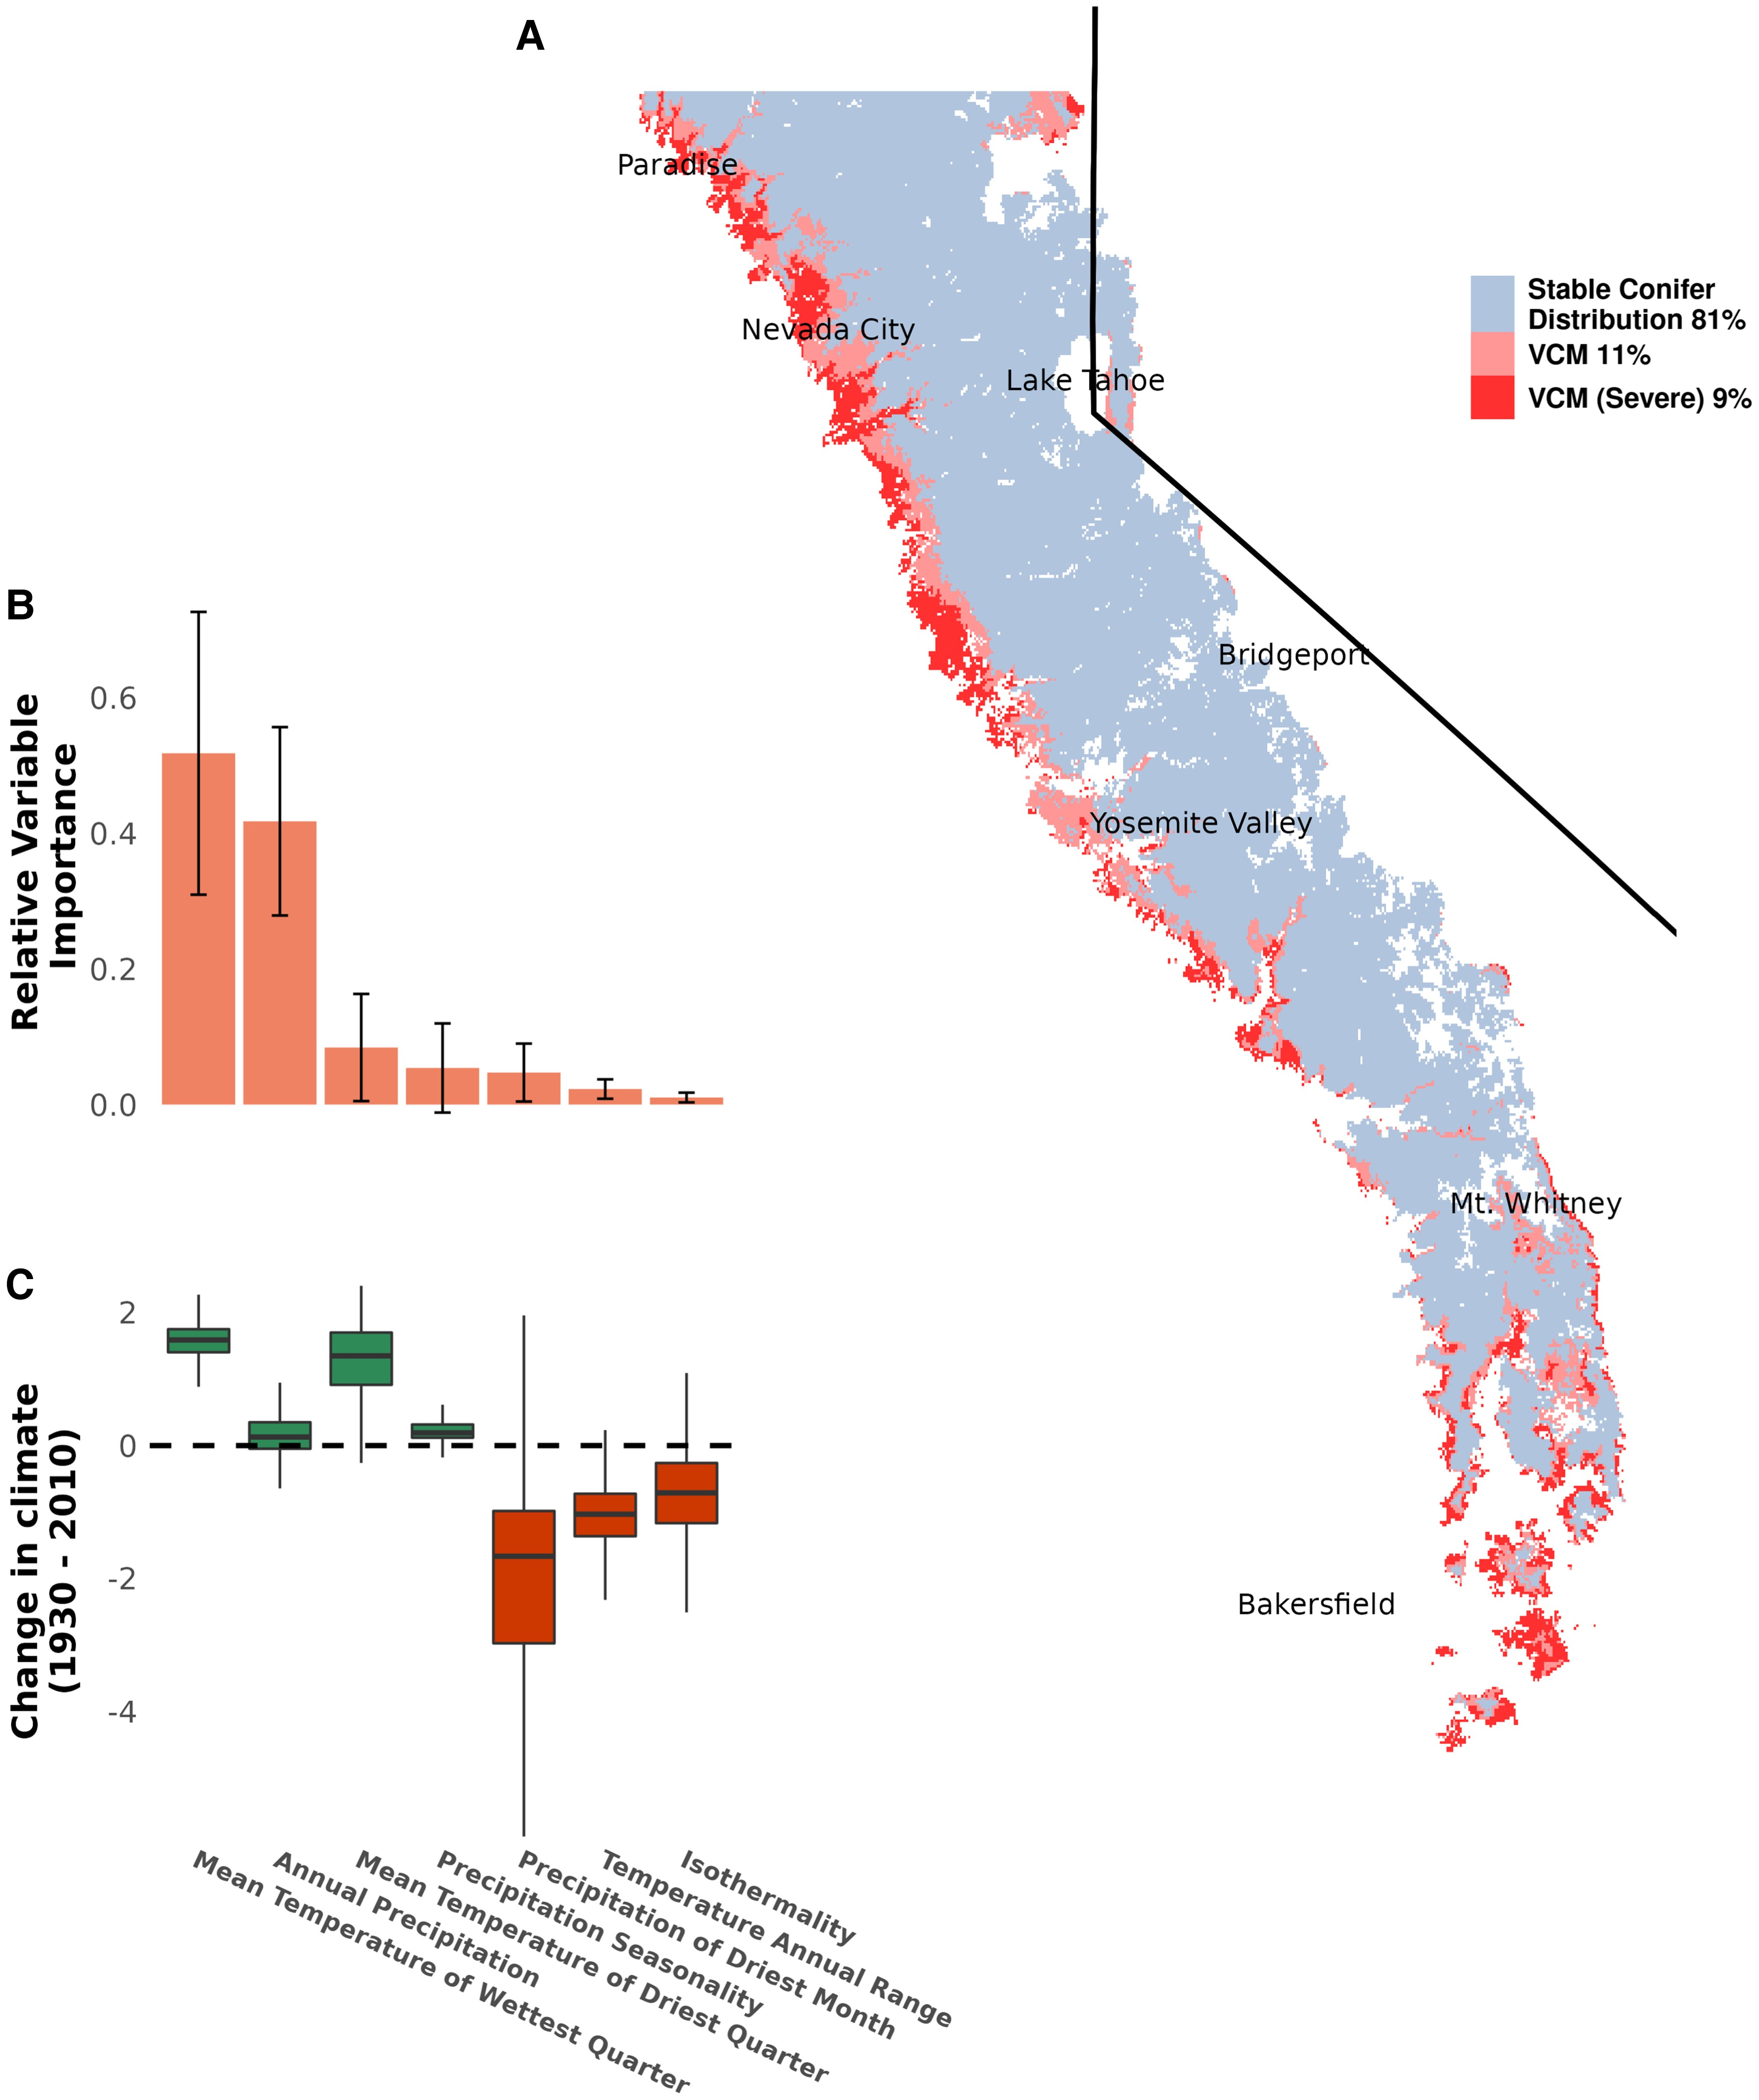
![Habitat suitability of observed vegetation transitions between 1930s and 2010s. Areas that transitioned from conifer-dominated to angiosperm-dominated vegetation from 1930s to present tended to have lower modern conifer habitat suitability (p < 2 × 10⁻¹⁶). (a) All areas in the Sierra Nevada with complete vegetation data from the 1930s (Wieslander) and 2010s (EVeg) area shown. Most transitions from conifer-dominant vegetation are along the low-elevation edges of the historic conifer distribution. (b) The fitted logistic regression line indicates that the odds of conifer forests persisting decreased by 9.2% (95% CI = [0.092, 0.093]) for every 0.1 decrease in predicted habitat suitability. Probability density estimates for the areas of either transition or persistence are included. Graphic: Hill, et al., 2023 / PNAS Nexus](https://desdemonadespair.net/wp-content/uploads/2023/05/image-34.png)
Low-elevation conifers in California’s Sierra Nevada are out of equilibrium with climate
ABSTRACT: Since the 1930s, California’s Sierra Nevada has warmed by an average of 1.2∘
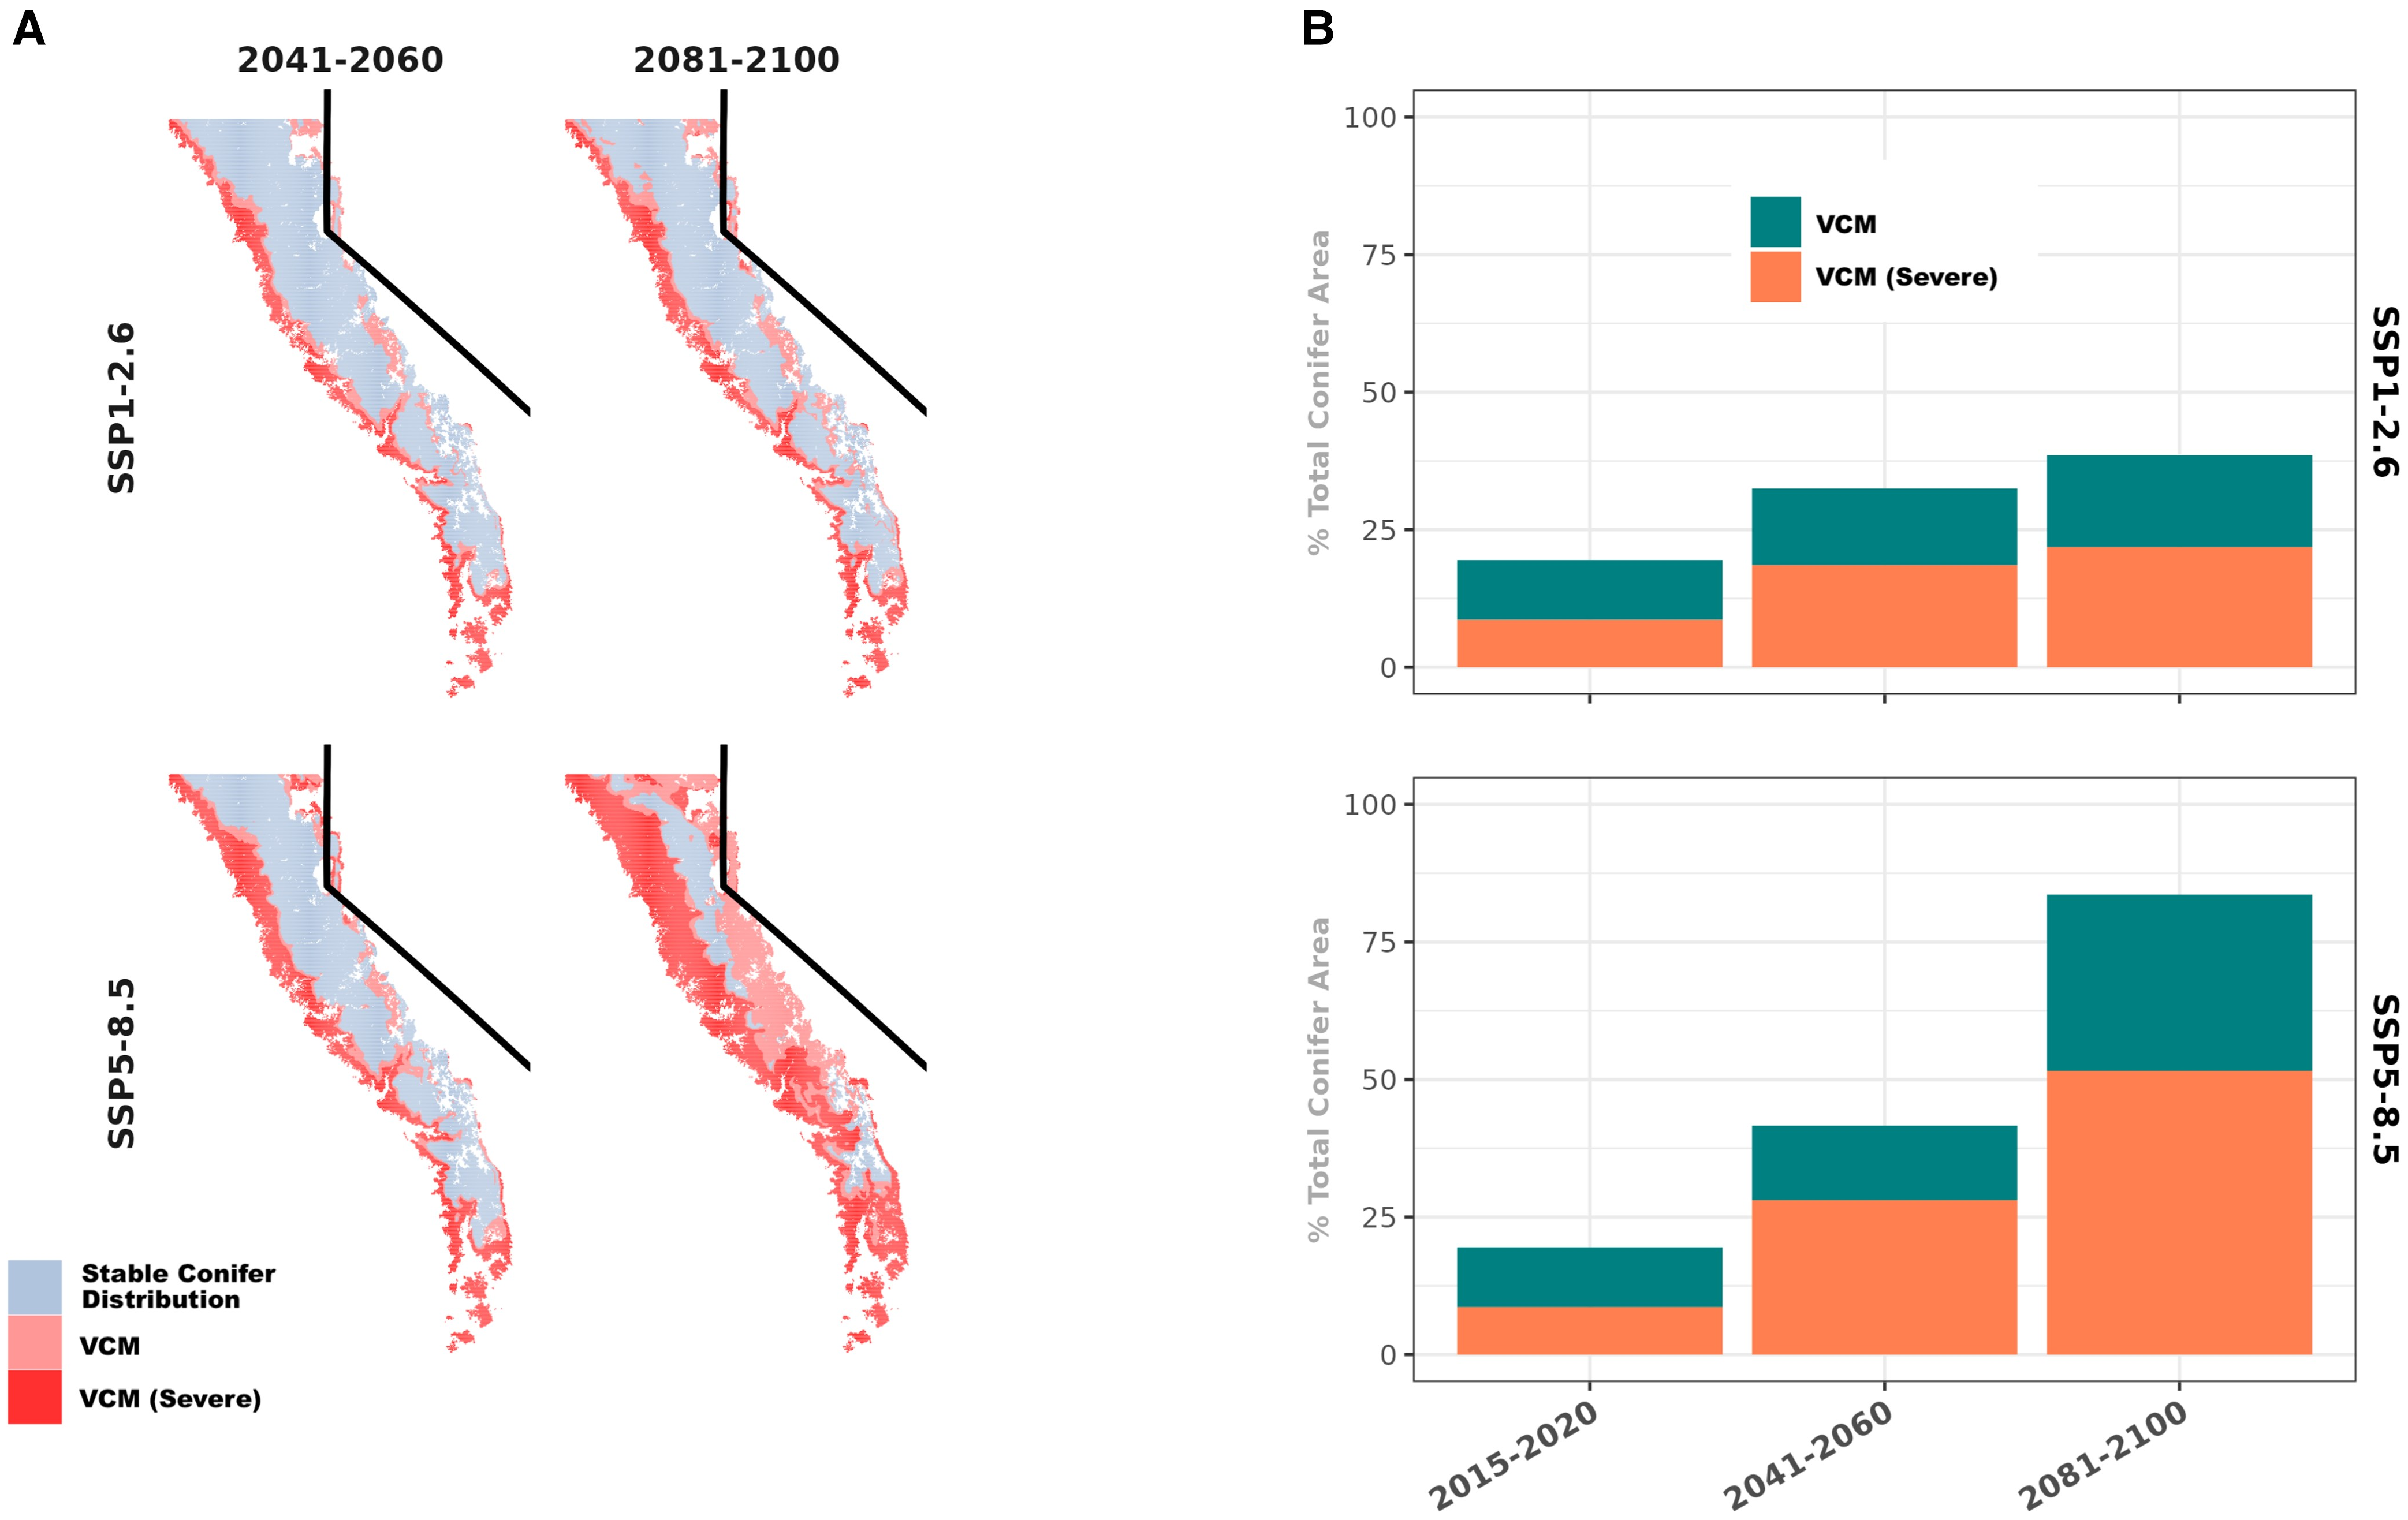
C. Warming directly primes forests for easier wildfire ignition, but the change in climate also affects vegetation species composition. Different types of vegetation support unique fire regimes with distinct probabilities of catastrophic wildfire, and anticipating vegetation transitions is an important but undervalued component of long-term wildfire management and adaptation. Vegetation transitions are more likely where the climate has become unsuitable but the species composition remains static. This vegetation climate mismatch (VCM) can result in vegetation conversions, particularly after a disturbance like wildfire. Here we produce estimates of VCM within conifer-dominated forests in the Sierra Nevada. Observations from the 1930s Wieslander Survey provide a foundation for characterizing the historical relationship between Sierra Nevada vegetation and climate before the onset of recent, rapid climate change. Based on comparing the historical climatic niche to the modern distribution of conifers and climate, ∼19.5% of modern Sierra Nevada coniferous forests are experiencing VCM, 95% of which is below an elevation of 2356 m. We found that these VCM estimates carry empirical consequences: likelihood of type-conversion increased by 9.2% for every 10% decrease in habitat suitability. Maps of Sierra Nevada VCM can help guide long-term land management decisions by distinguishing areas likely to transition from those expected to remain stable in the near future. This can help direct limited resources to their most effective uses—whether it be protecting land or managing vegetation transitions—in the effort to maintain biodiversity, ecosystem services, and public health in the Sierra Nevada.
Low-elevation conifers in California’s Sierra Nevada are out of equilibrium with climate