Accelerated melting of glaciers in Greenland – Greenland’s glaciers have lost at least 587 cubic km of ice over the last century
26 May 2023 (University of Leeds) – A study has found widespread mass loss of glaciers and ice caps in Greenland since the start of the 20th century.
The research provides critical insights into long-term changes to the glaciers and ice caps as a result of climate change, which has contributed about one fifth to global sea-level rise in the last decade.
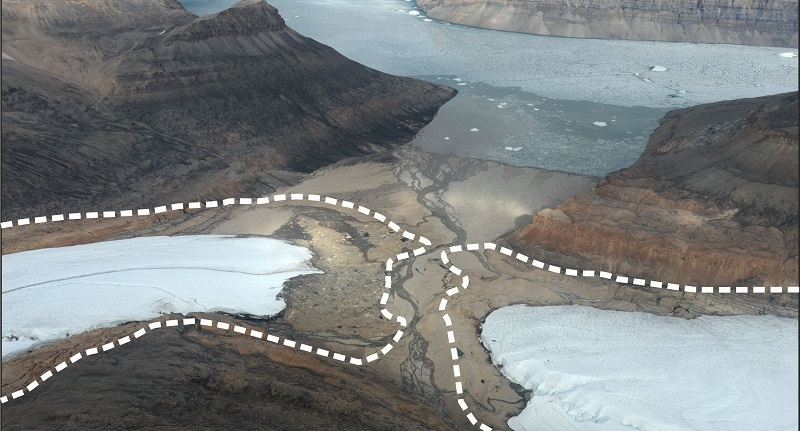
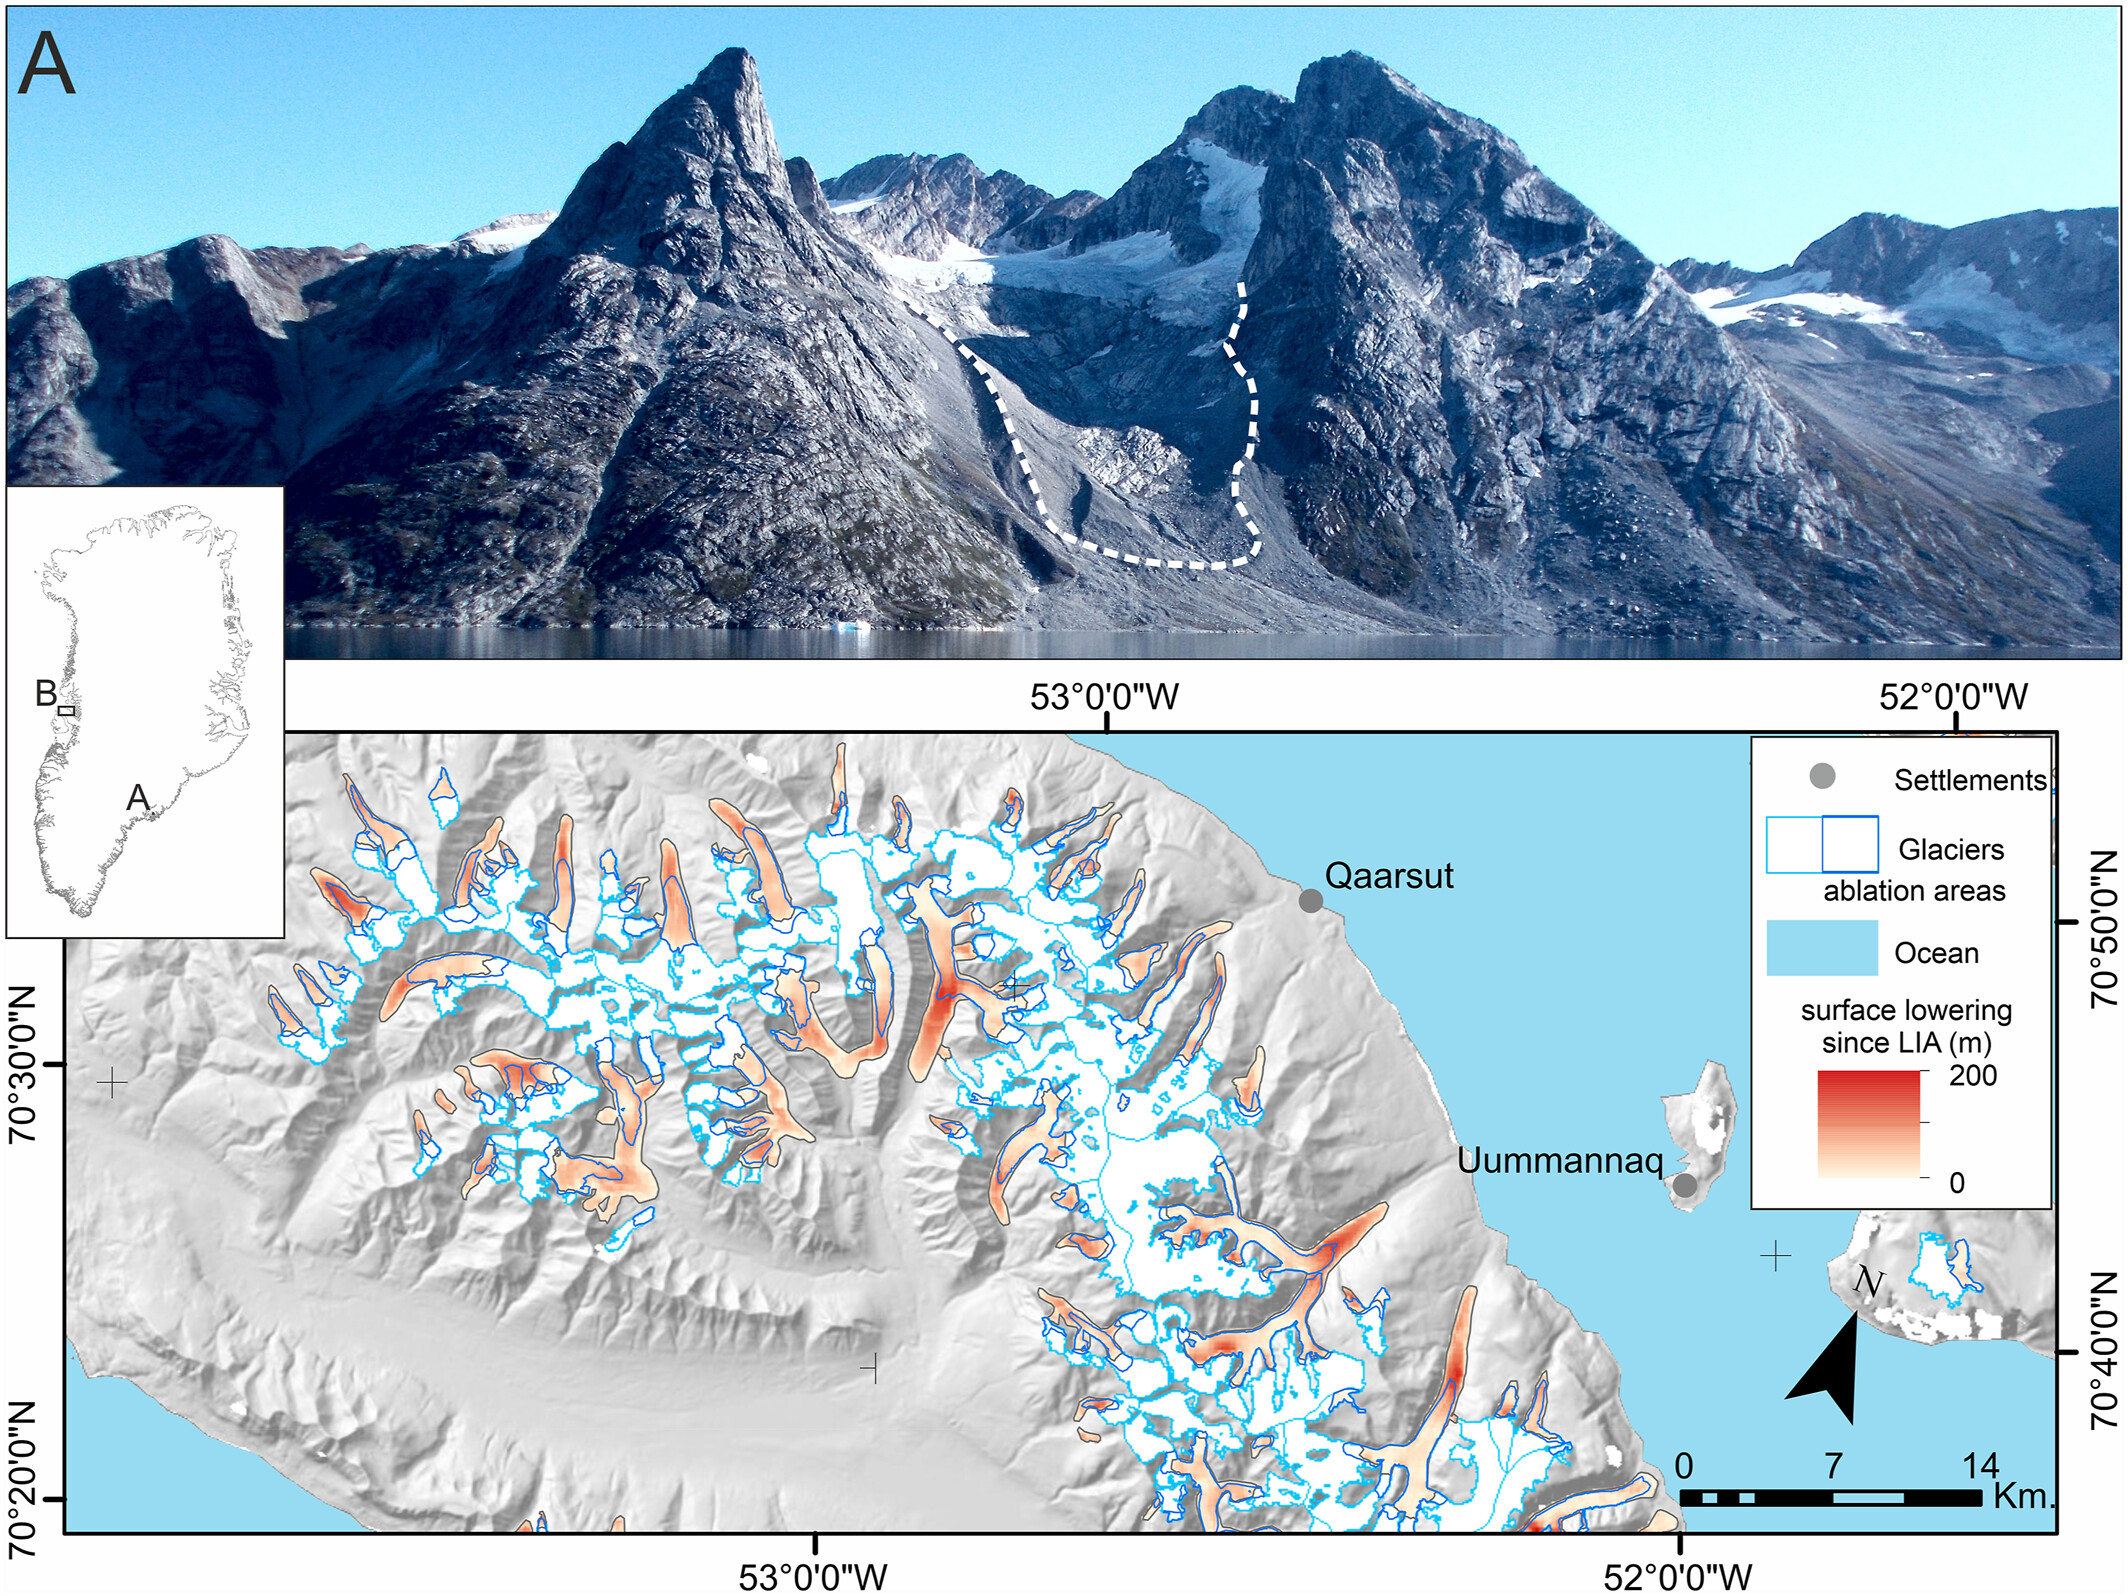
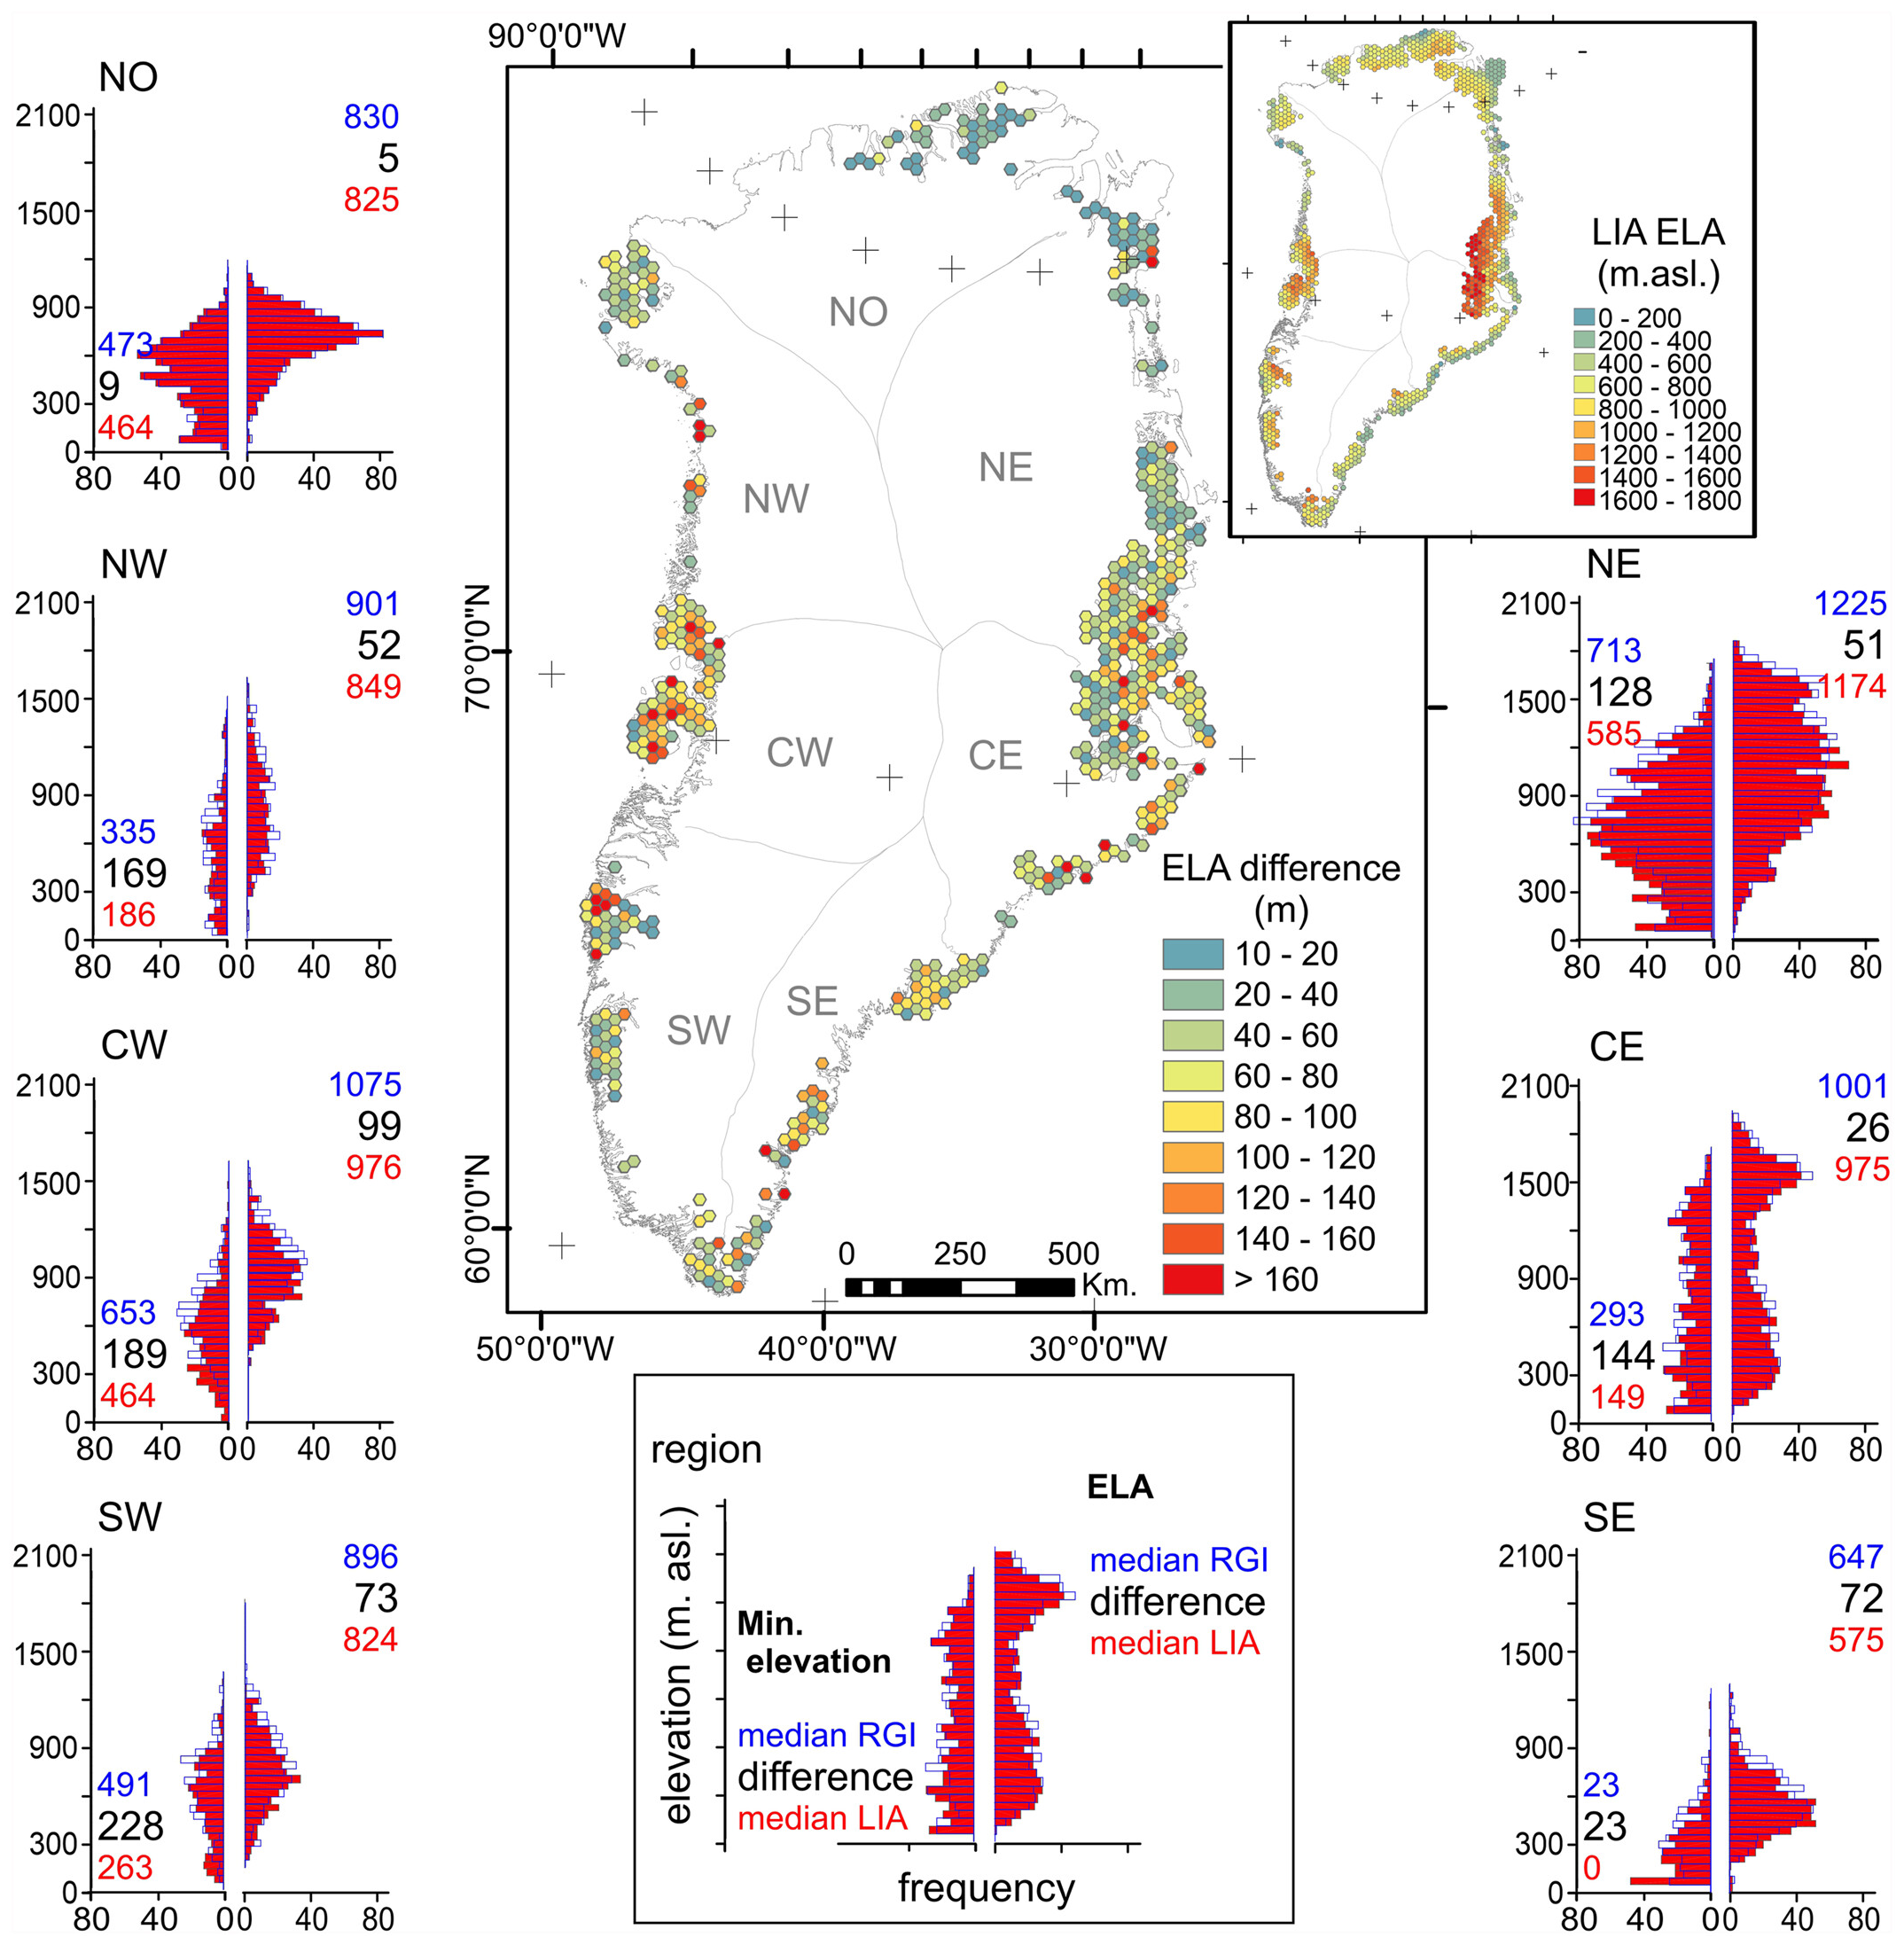
Using historical data, scientists mapped 5,327 glaciers and ice caps that existed at the end of the Little Ice Age in 1900, a period of wide-spread cooling when average global temperatures dropped by as much as 2°C. They were then able to reveal that these fragmented into 5,467 glaciers and ice caps by 2001.
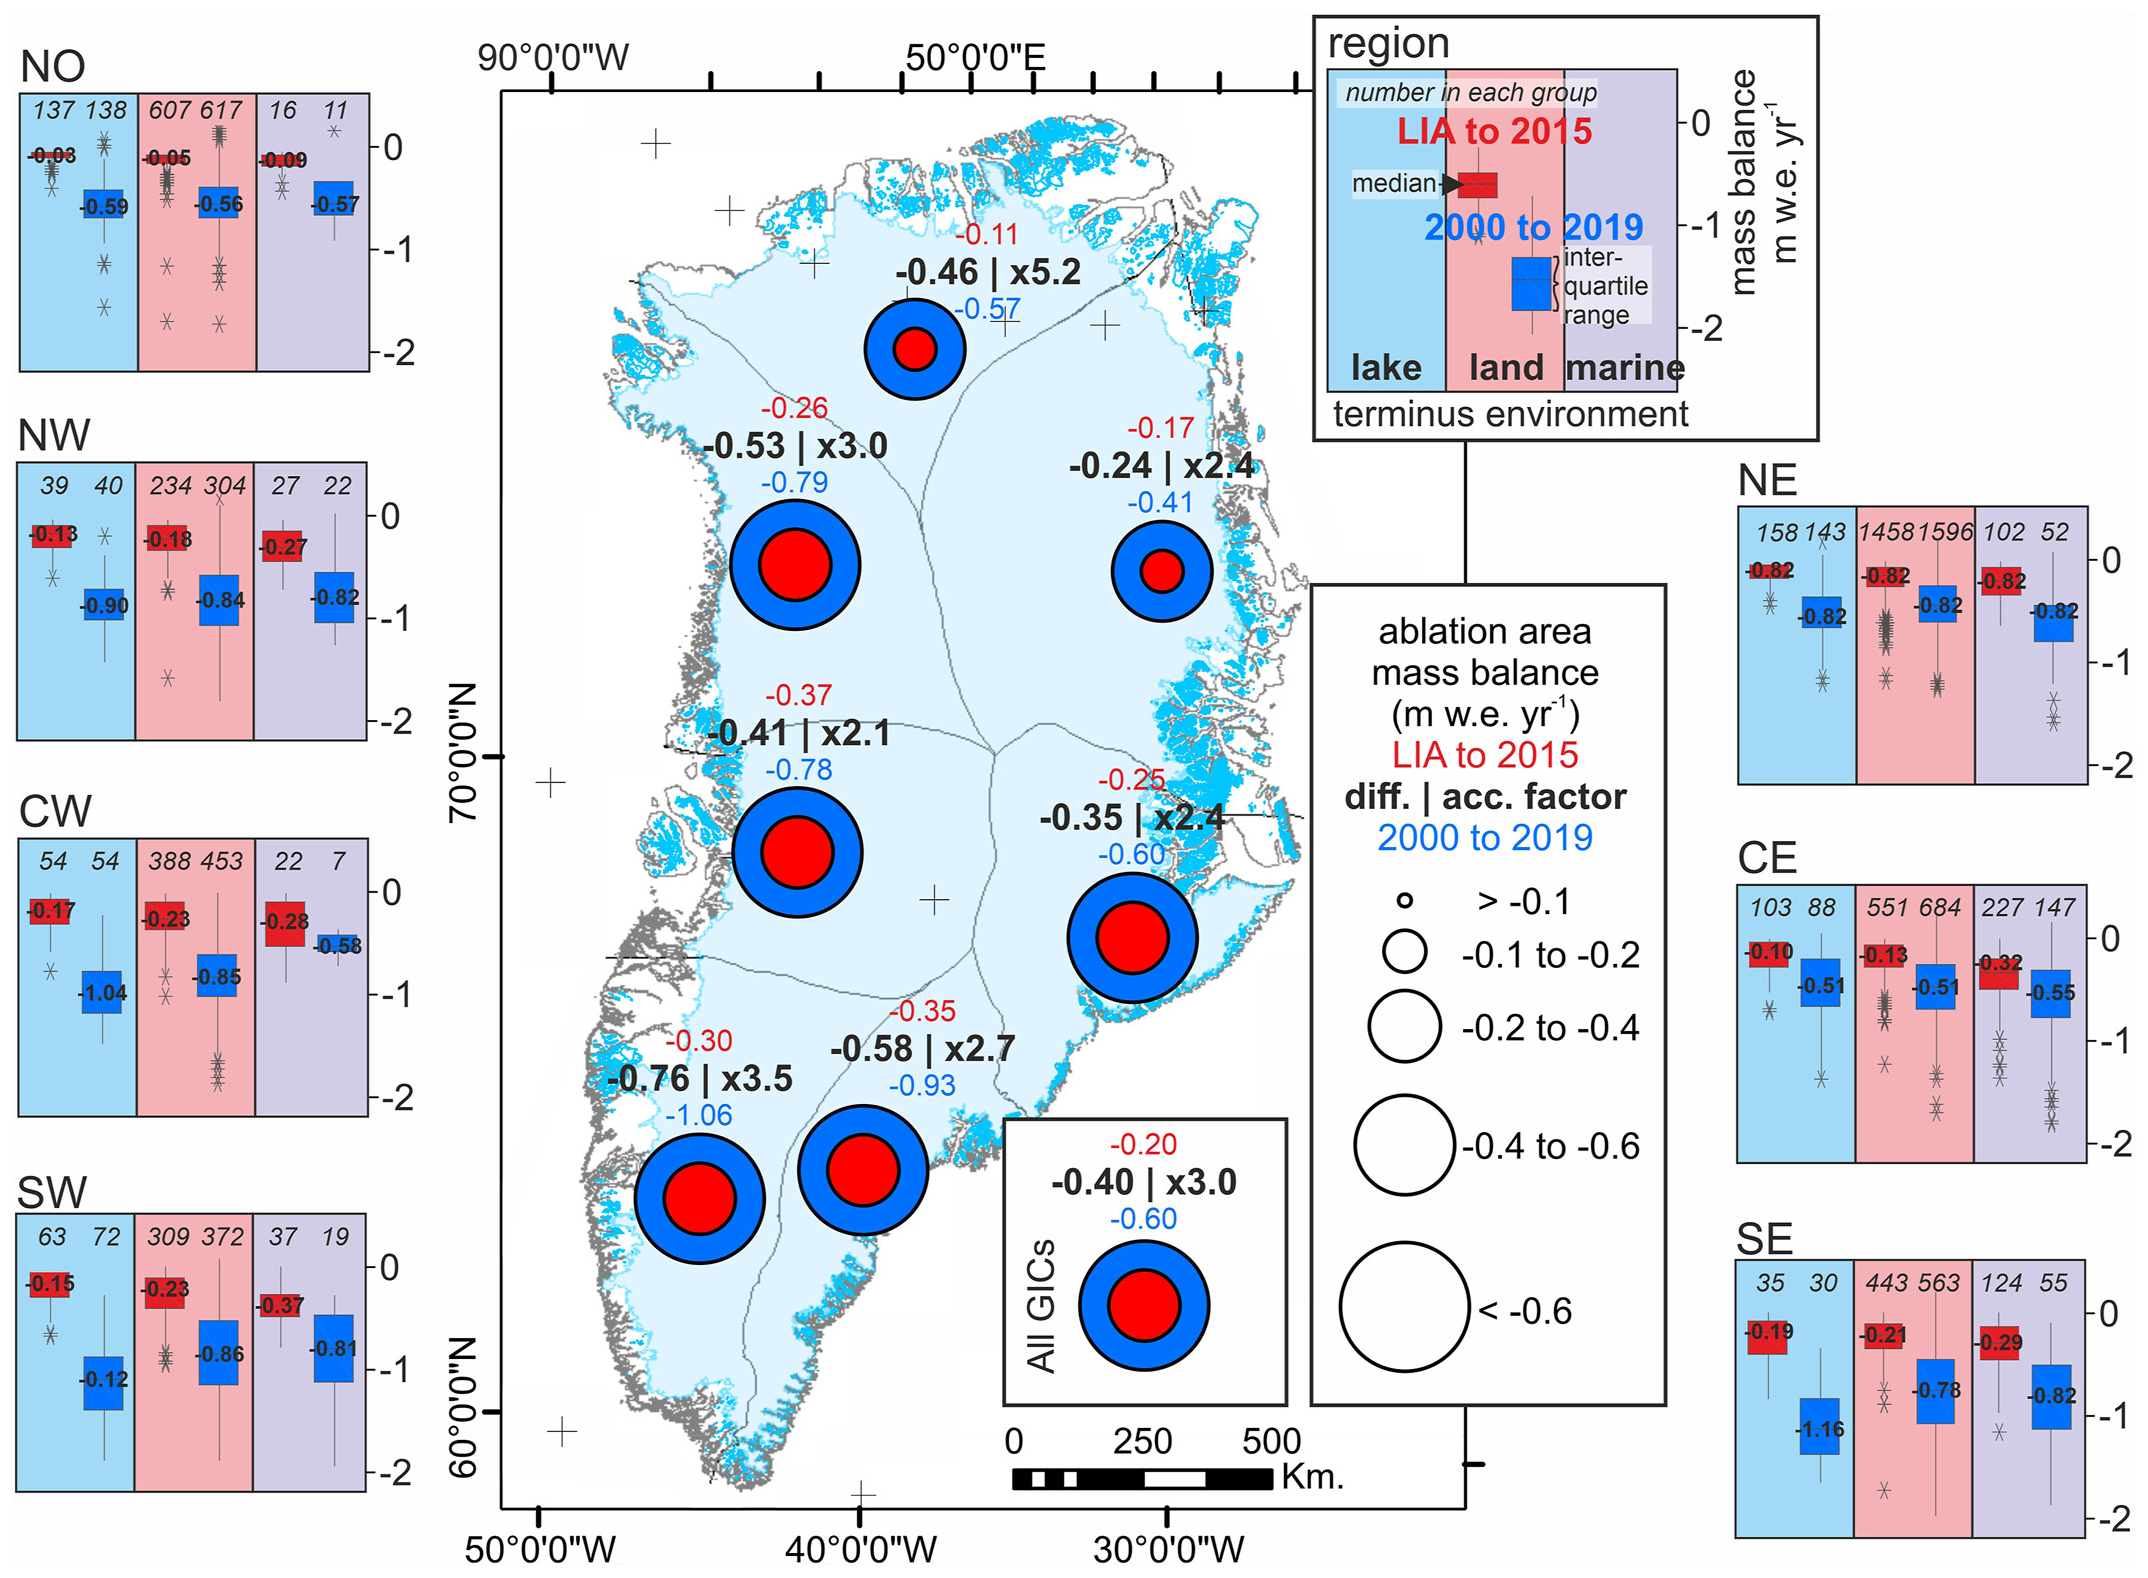
Comparison of mass loss rates between the Little Ice Age to 2015 and 2000-2019 reveals that glacier mass loss has accelerated over the past 20 years by at least two to three times for most regions and by five times for the northern region.
Carrivick, et al., 2023 / Geophysical Research Letters
The study – Mass Loss of Glaciers and Ice Caps Across Greenland Since the Little Ice Age – published in the journal Geophysical Research Letters, said Greenland’s glaciers have lost at least 587 km3 of ice over the last century, accounting for 1.38 millimetres of sea-level rise.
It estimated that the speed at which the water melted between 2000 and 2019 was three times higher than the long-term – since 1900 – average.
Lead author, Dr Jonathan L. Carrivick from the School of Geography at the University of Leeds, said: “The impact of meltwater run off from Greenland into the North Atlantic extends beyond global sea-level rise, affecting North Atlantic ocean circulation, European climate patterns, and Greenlandic fjord water quality and marine ecosystems.
“This has immense implications on humans too, with these glacier changes having a direct impact on the economic activities of fishing, mining, and hydropower, as well as affecting people’s health and behaviour.”
Greenland’s glaciers and ice caps rank as the second-largest source of meltwater, after Alaska.
Co-author, Dr Clare Boston from the School of the Environment, Geography, and Geosciences at the University of Portsmouth, said: “Previous research using satellite data suggests Greenland’s glaciers and ice caps could lose between 19 percent and 28 percent of their volume by 2100.
“These predictions only use information gathered from the past few decades, whereas our research provides baseline data from more than 100 years ago. Seeing how glaciers have evolved over a longer period of time, can give us a better chance of predicting how they’ll change in the future.
“It’s also important to note, that we only looked at glaciers and ice caps that were at least 1 km2 in area, so the overall amount of ice that has melted would be even more than our predictions if you take into account the smaller ones.”
The paper stresses the importance of understanding these changes in the context of global sea-level rise.
The research also emphasises the complex nature of glacier evolution due to considerable differences in locations, temperatures, and the influence of regional and local factors.
Glaciers in the North have experienced the greatest speed up in rate of mass loss compared to other regions. Glaciers terminating in lakes have increased the most in their rate of mass loss.
Dr Carrivick added: “This study contributes great spatial coverage, spatial resolution and temporal detail to our understanding of Greenland’s glacier changes, providing a valuable resource for policymakers, scientists, and stakeholders concerned with climate change and its impacts.
“It represents a crucial step towards unravelling the dynamics of Greenland’s glaciers and their role in global climate change, as the world faces the challenges posed by a warming Arctic.”
Contact
- David Lewis in the the press office at the University of Leeds by email: d.lewis@leeds.ac.uk
Accelerated melting of glaciers in Greenland
Mass Loss of Glaciers and Ice Caps Across Greenland Since the Little Ice Age
ABSTRACT: Glaciers and ice caps (GICs) are important contributors of meltwater runoff and to global sea level rise. However, knowledge of GIC mass changes is largely restricted to the last few decades. Here we show the extent of 5327 Greenland GICs during Little Ice Age (LIA) termination (1900) and reveal that they have fragmented into 5467 glaciers in 2001, losing at least 587 km3 from their ablation areas, equating to 499 Gt at a rate of 4.34 Gt yr−1. We estimate that the long-term mean mass balance in glacier ablation areas has been at least −0.18 to −0.22 m w.e. yr−1 and note the rate between 2000 and 2019 has been three times that. Glaciers with ice-marginal lakes formed since the LIA termination have had the fastest changing mass balance. Considerable spatial variability in glacier changes suggest compounding regional and local factors present challenges for understanding glacier evolution.
- Total volume loss of at least 587 km3 since the Little Ice Age (LIA) termination, equating to 499 Gt and to 1.38 mm sea level equivalent
- Glacier mass balance from 2000 to 2019 is three times more negative than since the LIA but five times more negative in the North region
- Lake-terminating glaciers have experienced the greatest change in rate of mass loss
Glaciers and ice caps of Greenland peripheral to the ice sheet are important contributors of meltwater to the oceans and to global sea-level rise. In this study we map the extent of 5467 glaciers during the Little Ice Age (LIA) termination c. 1900 and calculate that they have lost at least 587 km3. The rate of mass change of these glaciers between 2000 and 2019 was three times more negative than the long-term average (of 4.34 Gt yr−1) since the LIA. Lake-terminating glaciers now lose mass the fastest compared with land- or marine-terminating glaciers. Considerable spatial variability in glacier responses suggests local factors are important and makes glacier evolution complex.
Mass Loss of Glaciers and Ice Caps Across Greenland Since the Little Ice Age