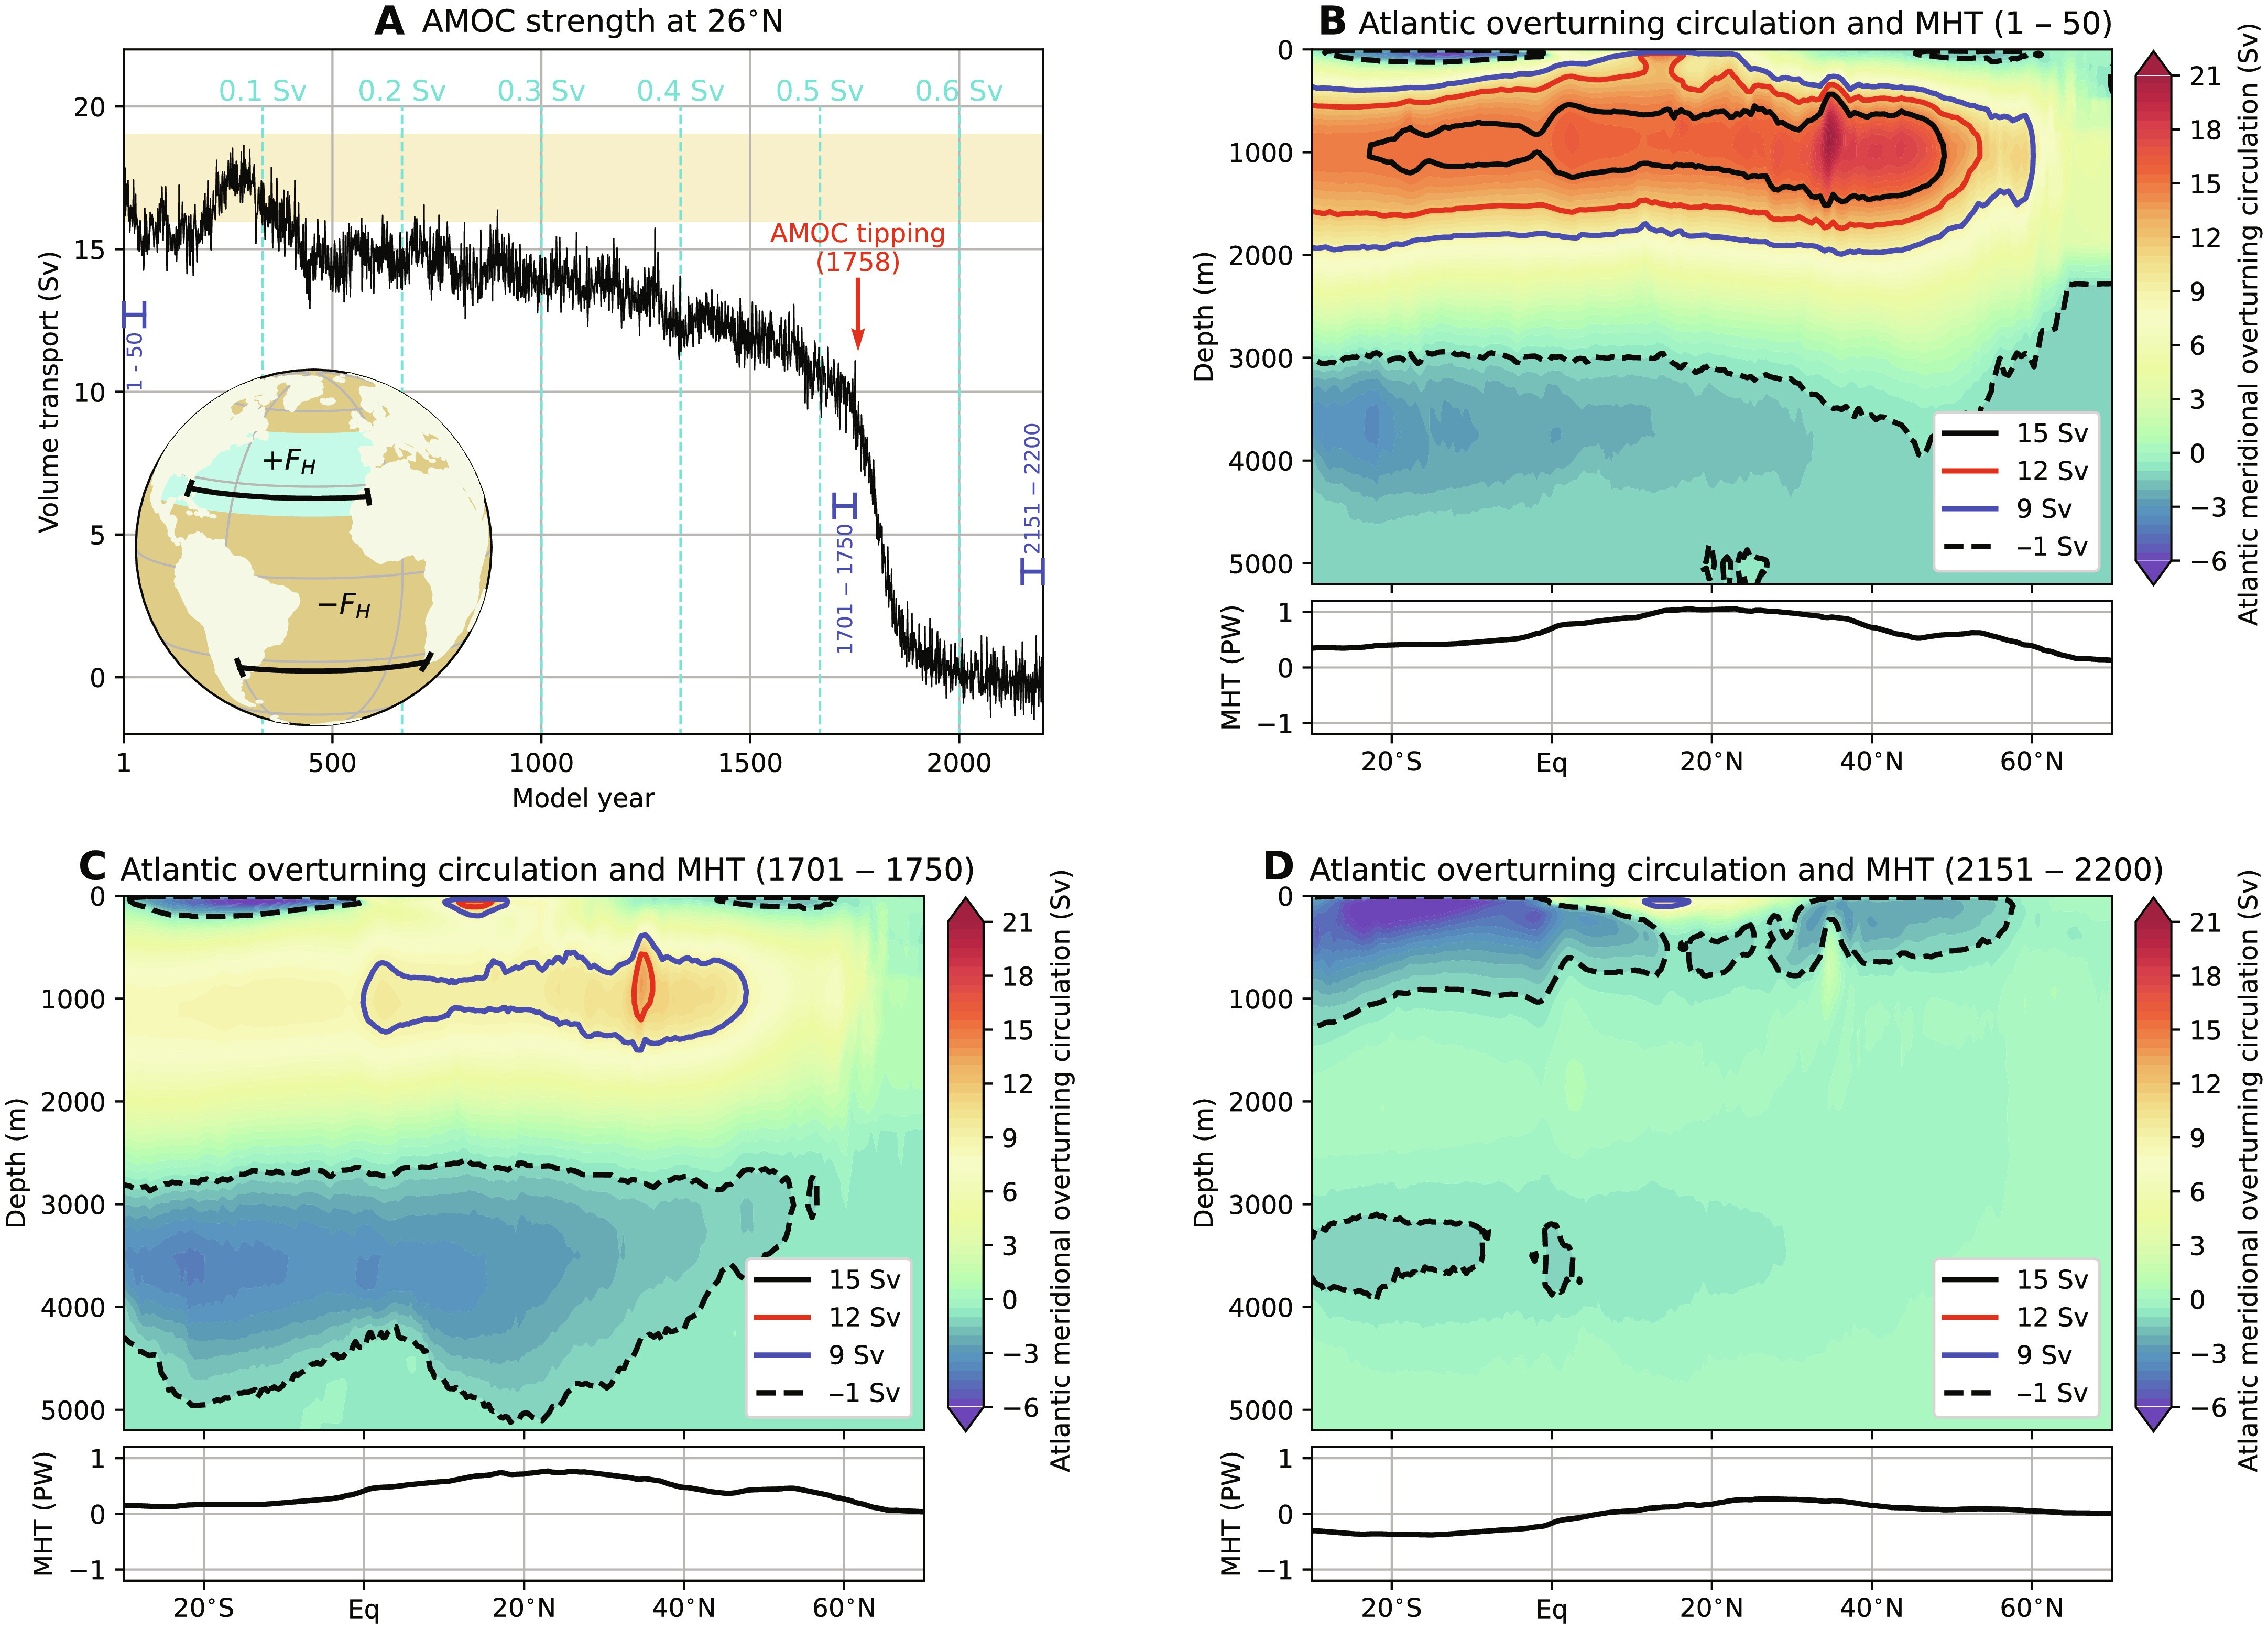
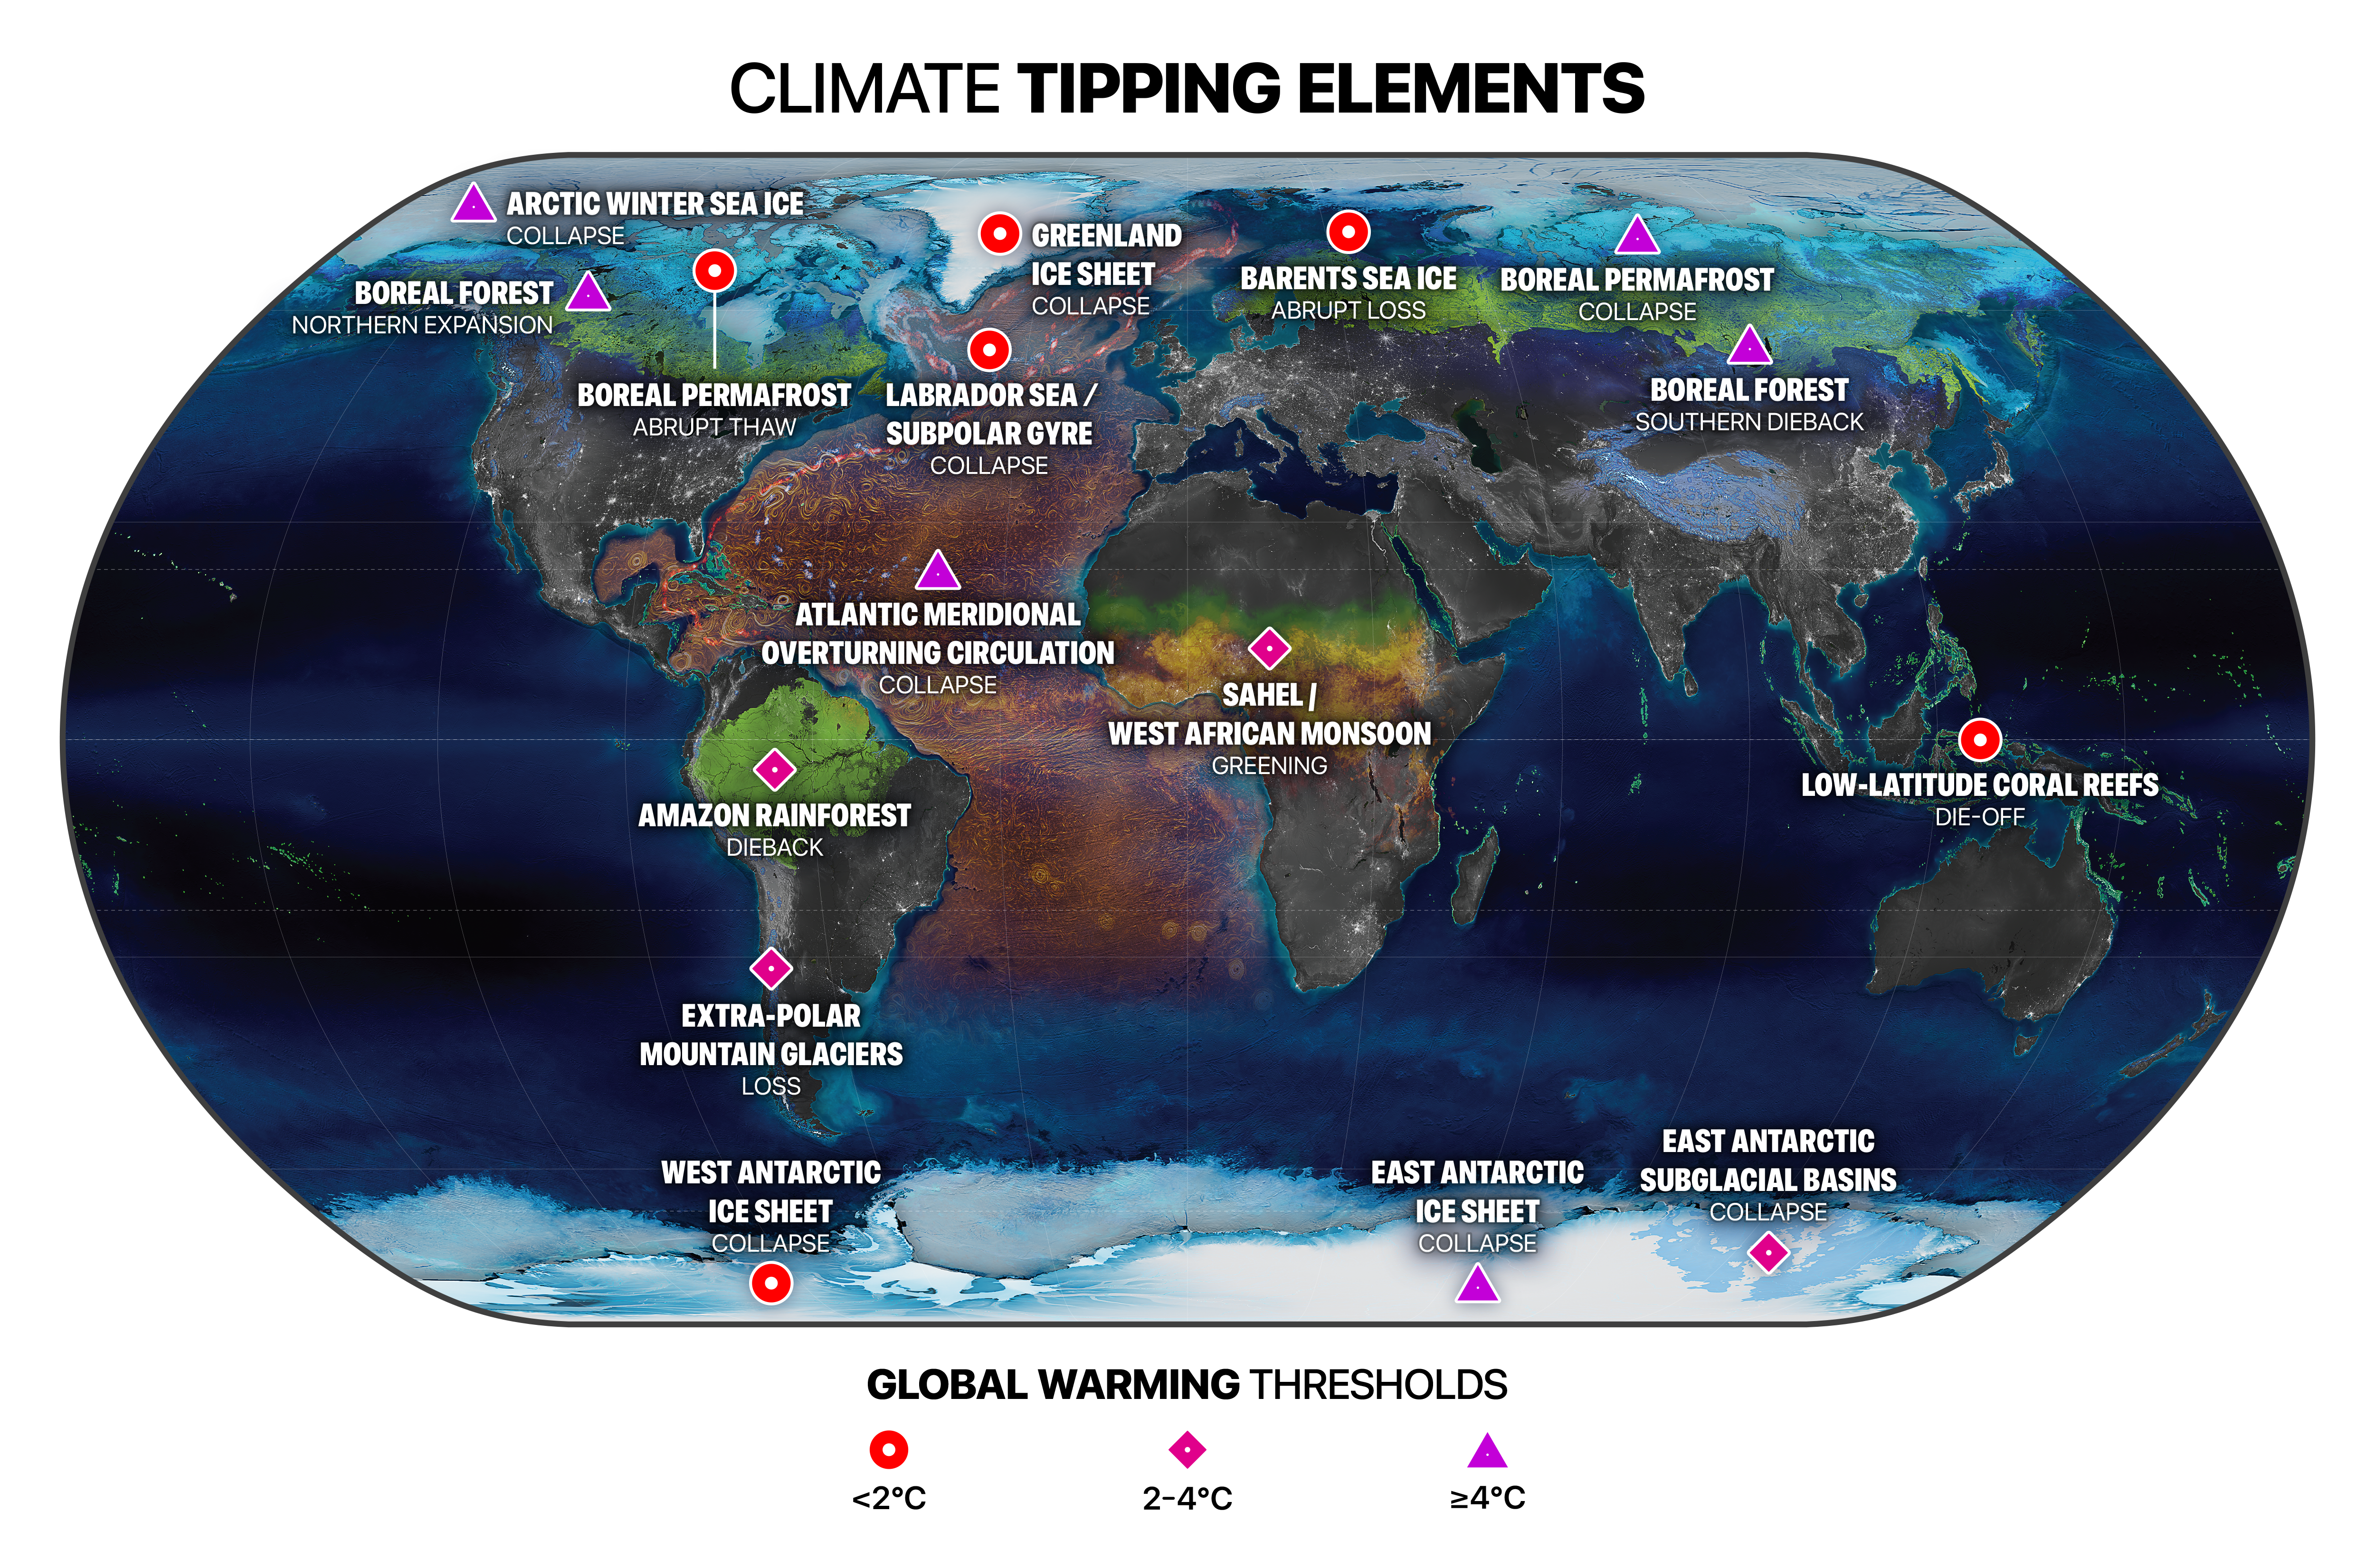
Annual global mean surface temperature anomalies relative to 1850–1900. Global mean near-surface temperature in 2023 was 1.45 ± 0.12 °C above the 1850–1900 average. The analysis is based on a synthesis of six global temperature datasets. 2023 was the warmest year in the 174-year instrumental record in each of the six datasets. The past nine years – from 2015 to 2023 – were the nine warmest years on record. The two previous warmest years were 2016, with an anomaly of 1.29 ± 0.12 °C, and 2020, with an anomaly of 1.27 ± 0.13 °C. Globally, every month from June to December was record warm for the respective month. September 2023 was particularly noteworthy, surpassing the previous global record for September by a wide margin (0.46 °C–0.54 °C) in all datasets. The second-highest margin by which a September record was broken in the past 60 years (the period covered by all datasets) was substantially smaller, at 0.03 °C–0.17 °C in 1983. July is typically the warmest month of the year globally, and thus July 2023 became the warmest month on record. The long-term increase in global temperature is due to increased concentrations of greenhouse gases in the atmosphere. The shift from La Niña, which lasted from mid-2020 to early 2023, to fully developed El Niño conditions by September 2023 likely explains some of the rise in temperature from 2022 to 2023. However, some areas of unusual warming, such as the North-East Atlantic do not correspond to typical patterns of warming or cooling associated with El Niño. Other factors, which are still being investigated, may also have contributed to the exceptional warming from 2022 to 2023, which is unlikely to be due to internal variability alone. Graphic: WMO

WMO: Climate change indicators reached record levels in 2023 – “Sirens are blaring across all major indicators. Some records aren’t just chart-topping, they’re chart-busting. And changes are speeding-up.”

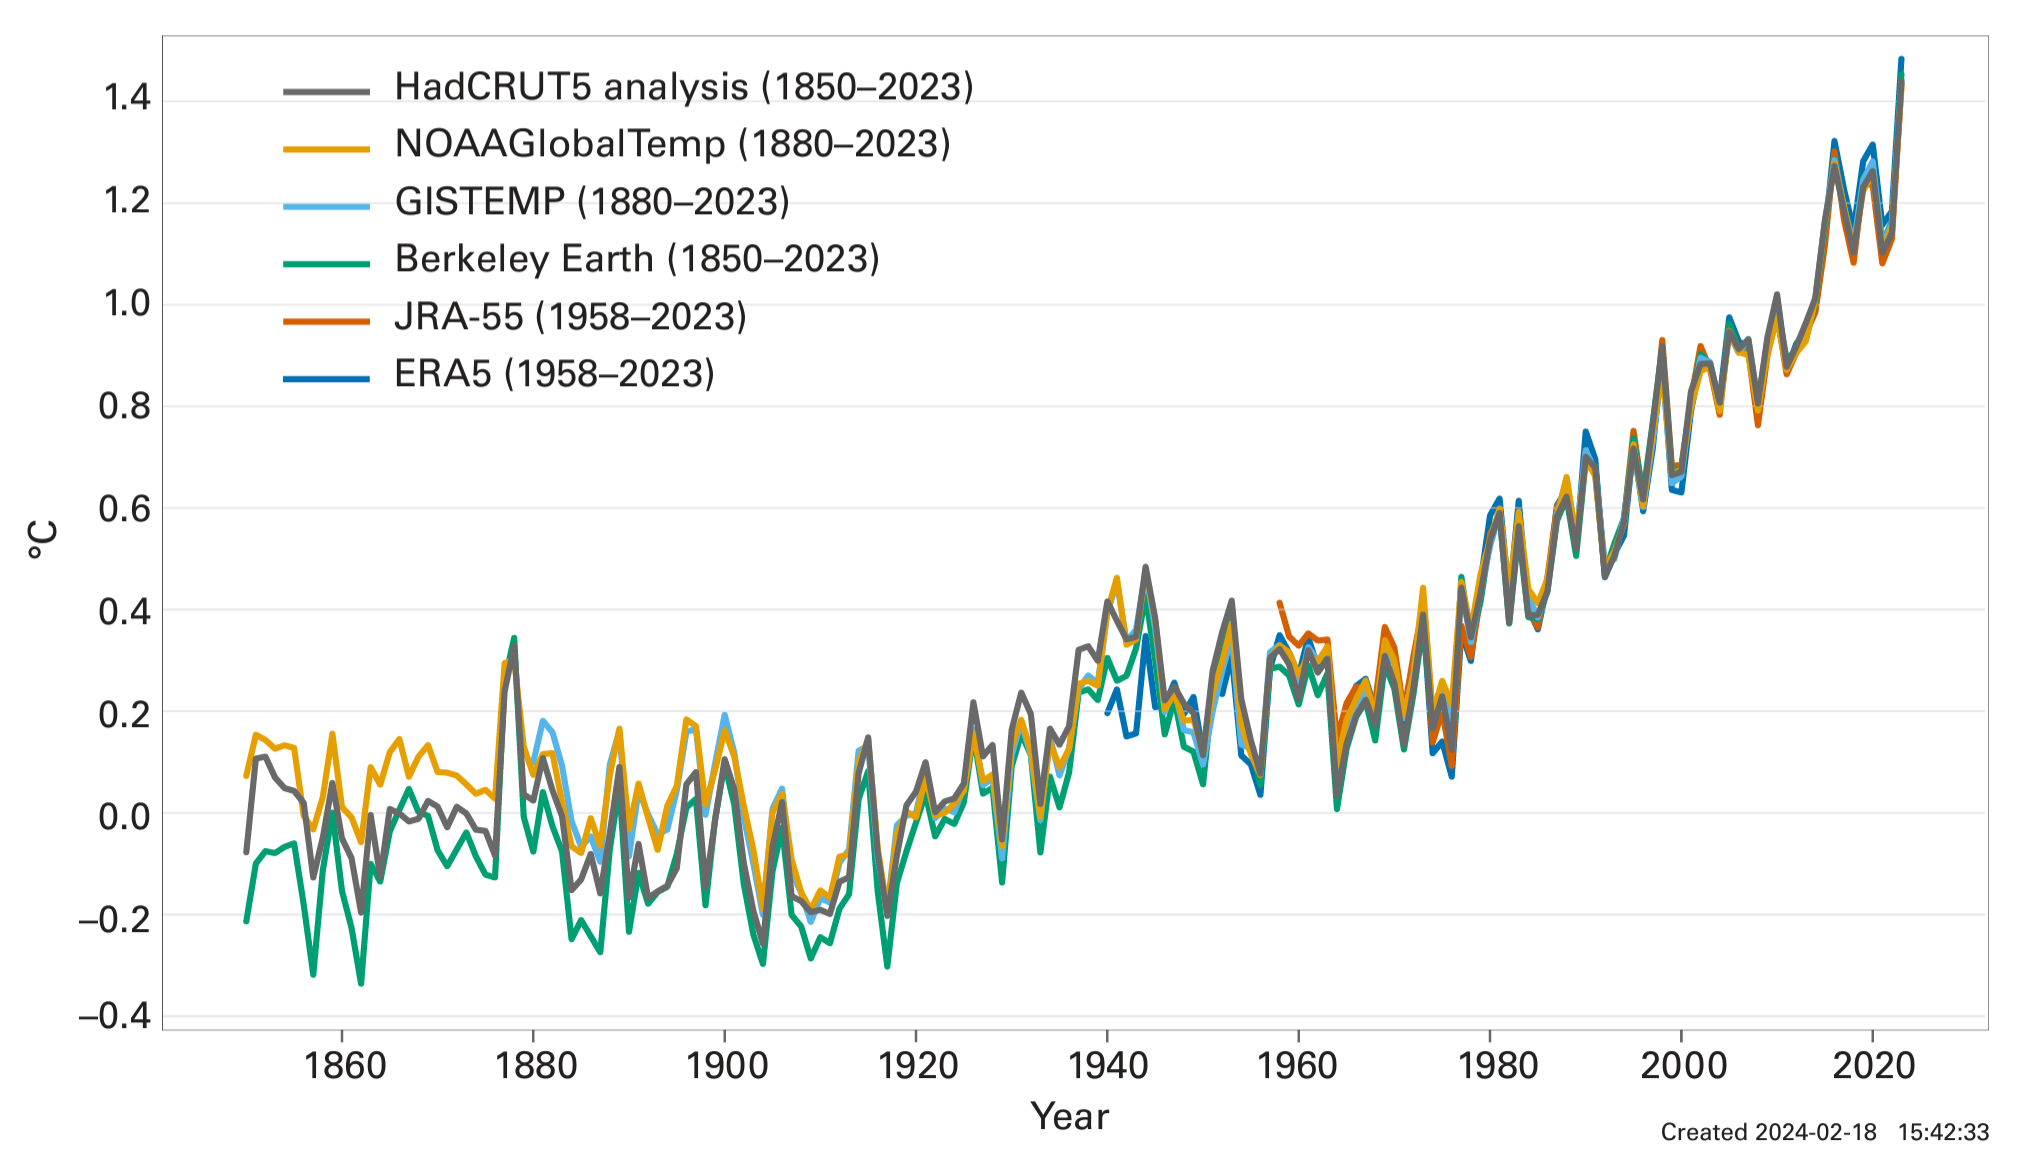
19 March 2024 (WMO) – A new report from the World Meteorological Organization (WMO) shows that records were once again broken, and in some cases smashed, for greenhouse gas levels, surface temperatures, ocean heat and acidification, sea level rise, Antarctic sea ice cover and glacier retreat. Heatwaves, floods, droughts, wildfires, and rapidly intensifying tropical cyclones […]

Map showing seasonal distribution of cumulative concentrations of target contaminants in the dissolved phase of snow collected in snow pits at the top of each glacier in the snowpack on north-western Spitsbergen. Spring – S; Winter – W; Fall – F. BP3 and BPA not displayed in the HDF S sample. Graphic: D'Amico, et al., 2023 / Science of The Total Environment

Traces of sunscreen agents in the snow at the North Pole – “Many of the contaminants we have analysed had never been identified in Arctic snow before”

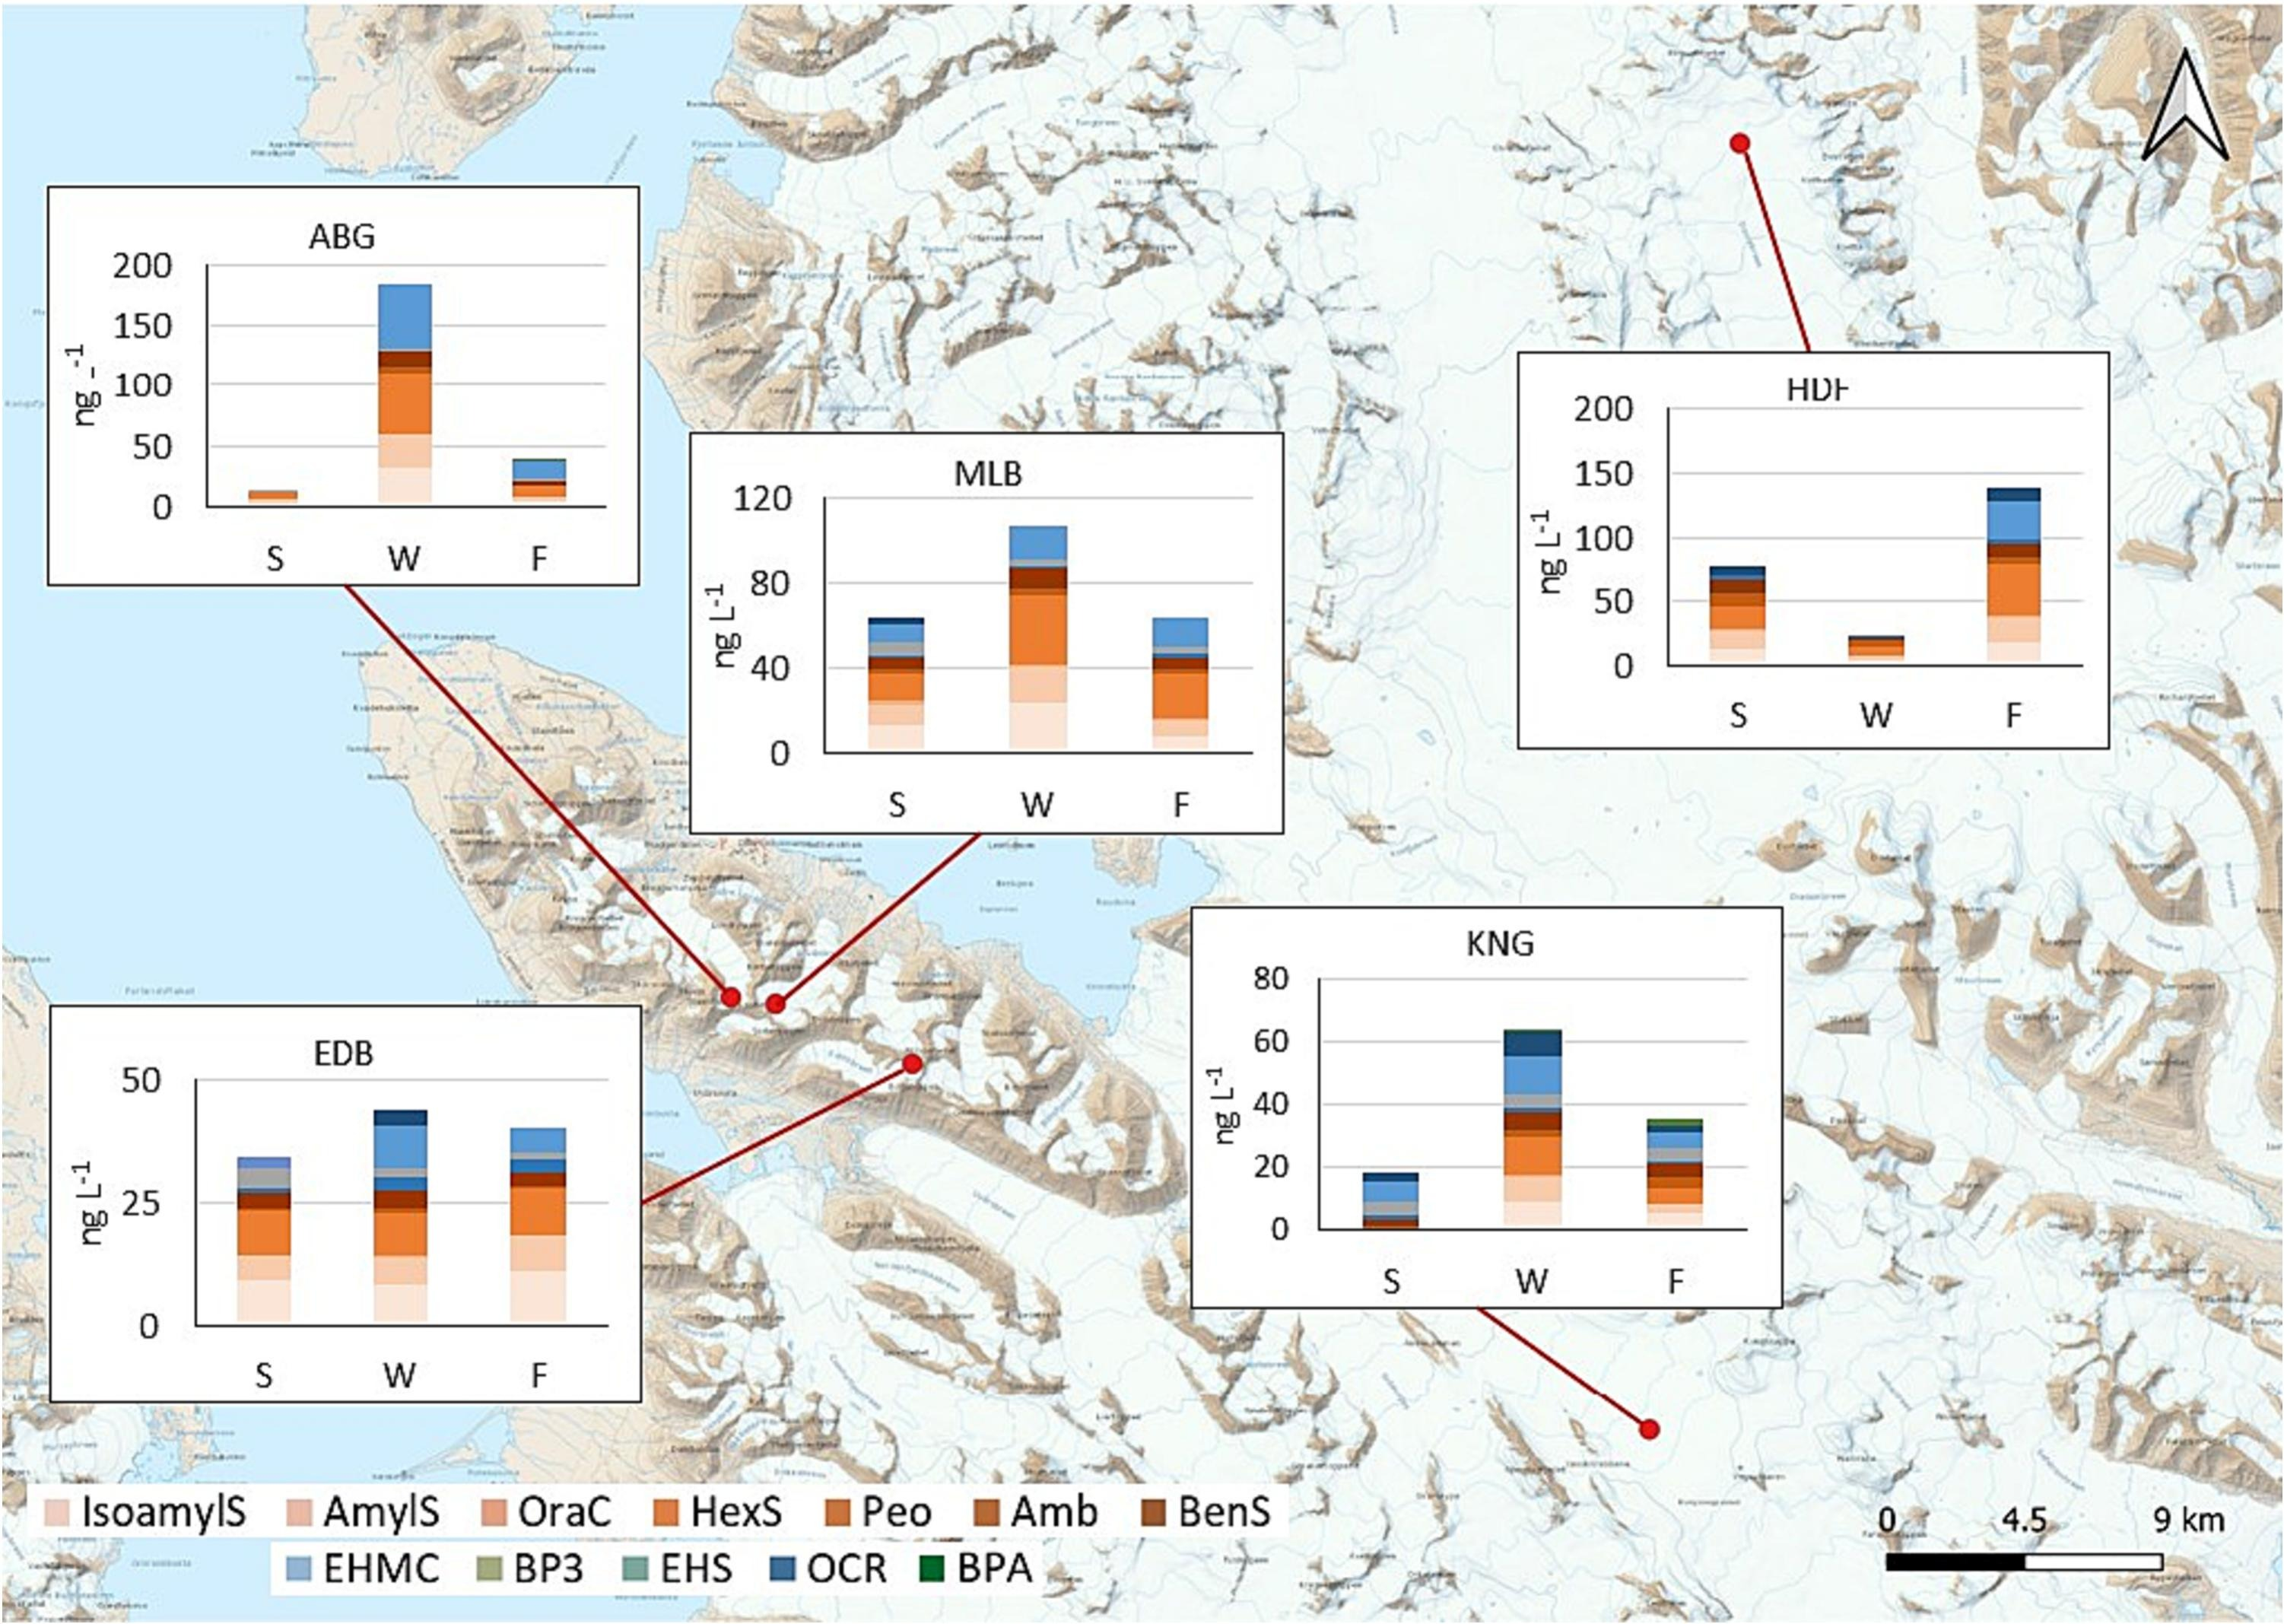
20 December 2023 (Ca’ Foscari University of Venice) – Traces of sunscreen agents were found at the North Pole, on the glaciers of the Svalbard archipelago. They were mainly deposited in winter, when night falls over the Arctic. A study conducted by researchers from Ca’ Foscari University of Venice and the Institute of Polar Sciences – National […]

Graph showing temperatures and atmospheric concentrations of carbon dioxide over the past 66 million years. Paleo-CO2 (including 95 percent credible intervals) is superimposed on the GMST trend over the past 66 million years. Age and CO2 labels highlight notable climate extrema and transitions as described in the text. Graphic: CenCO2PIP, Science 2023

A new 66 million-year history of carbon dioxide offers little comfort for today – “Regardless of exactly how many degrees the temperature changes, it’s clear we have already brought the planet into a range of conditions never seen by our species”

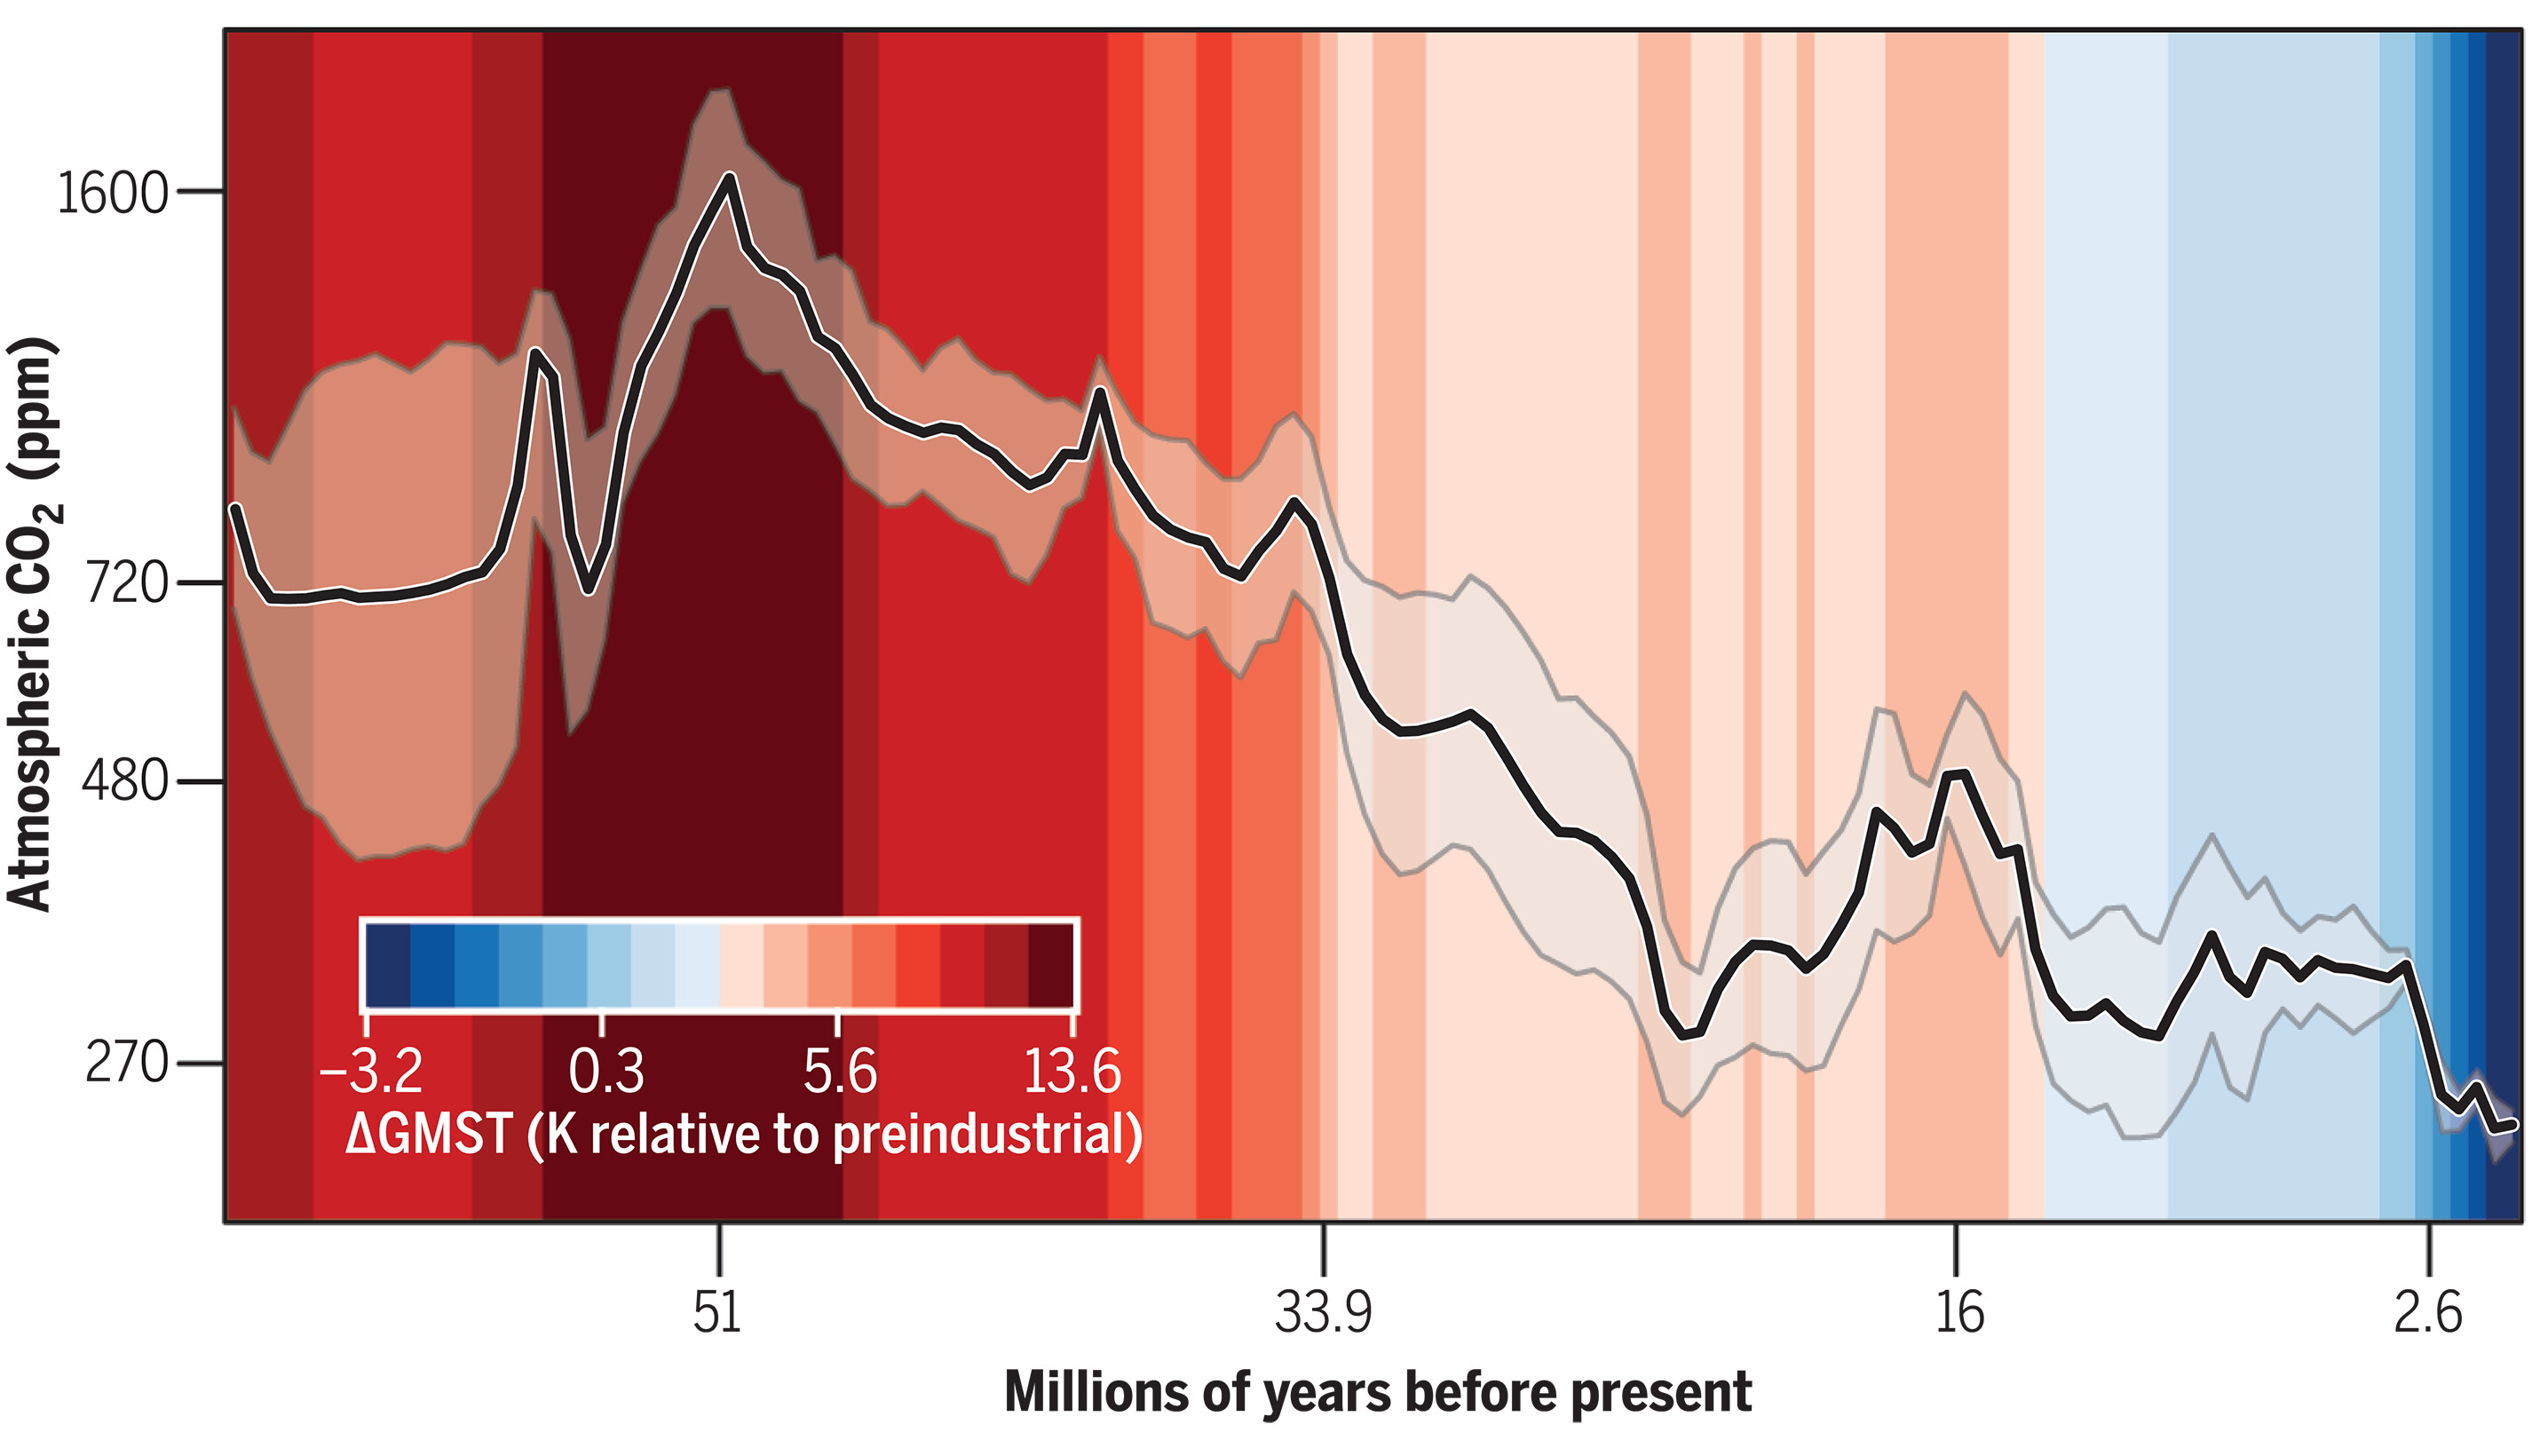
By Kevin Krajick 7 December 2023 (Columbia Climate School) – A massive new review of ancient atmospheric carbon-dioxide levels and corresponding temperatures lays out a daunting picture of where the Earth’s climate may be headed. The study covers geologic records spanning the past 66 million years, putting present-day concentrations into context with deep time. Among […]

The location of climate tipping elements in the cryosphere (blue), biosphere (green) and ocean/atmosphere (orange), and global warming levels their tipping points will likely be triggered at 1.5°C. Researchers see signs of destabilisation already in parts of the West Antarctic and Greenland ice sheets, in permafrost regions, the Amazon rainforest, and potentially the Atlantic overturning circulation as well. Graphic: Earth Commission / Globaïa

Climate collapse could happen fast – “For a long time, we were within the range of normal. And now we’re really not. And it has happened fast enough that people have a memory of it happening.”

By Lois Parshley 20 July 2023 (The Atlantic) – Ever since some of the earliest projections of climate change were made back in the 1970s, they have been remarkably accurate at predicting the rate at which global temperatures would rise. For decades, climate change has proceeded at roughly the expected pace, says David Armstrong McKay, a […]

Aerial view near Jungersen Gletschur in Greenland. The white lines show where scientists believe the glacier edges were in 1900. Photo: Bob Elberling

Accelerated melting of glaciers in Greenland – Greenland’s glaciers have lost at least 587 cubic km of ice over the last century

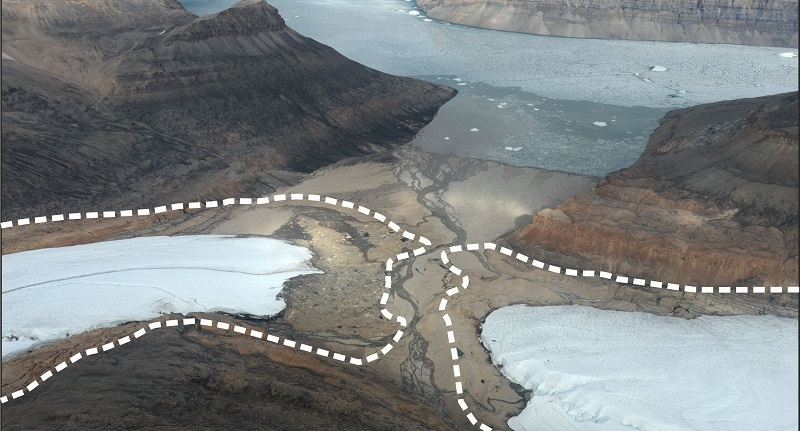
26 May 2023 (University of Leeds) – A study has found widespread mass loss of glaciers and ice caps in Greenland since the start of the 20th century. The research provides critical insights into long-term changes to the glaciers and ice caps as a result of climate change, which has contributed about one fifth to […]

Global annual mean temperature anomalies with respect to pre-industrial conditions (1850-1900) for six global temperature data sets (1850-2022). Graphic: WMO

WMO annual report highlights continuous advance of climate change – “While greenhouse gas emissions continue to rise and the climate continues to change, populations worldwide continue to be gravely impacted by extreme weather and climate events”

Geneva, 21 April 2023 (WMO) – From mountain peaks to ocean depths, climate change continued its advance in 2022, according to the annual report from the World Meteorological Organization (WMO). Droughts, floods, and heatwaves affected communities on every continent and cost many billions of dollars. Antarctic sea ice fell to its lowest extent on record […]

Map showing GFS 2m Temperature Anomaly for 20 December 2022. Much of the Arctic in December 2022 experienced a burst of freak warming. Graphic: Climate Reanalyzer

December 2022 serving up baked Alaska and warming most of Arctic – “Record-setting weather like we’re seeing plenty of examples of in recent years does tell a real story of climate heating”

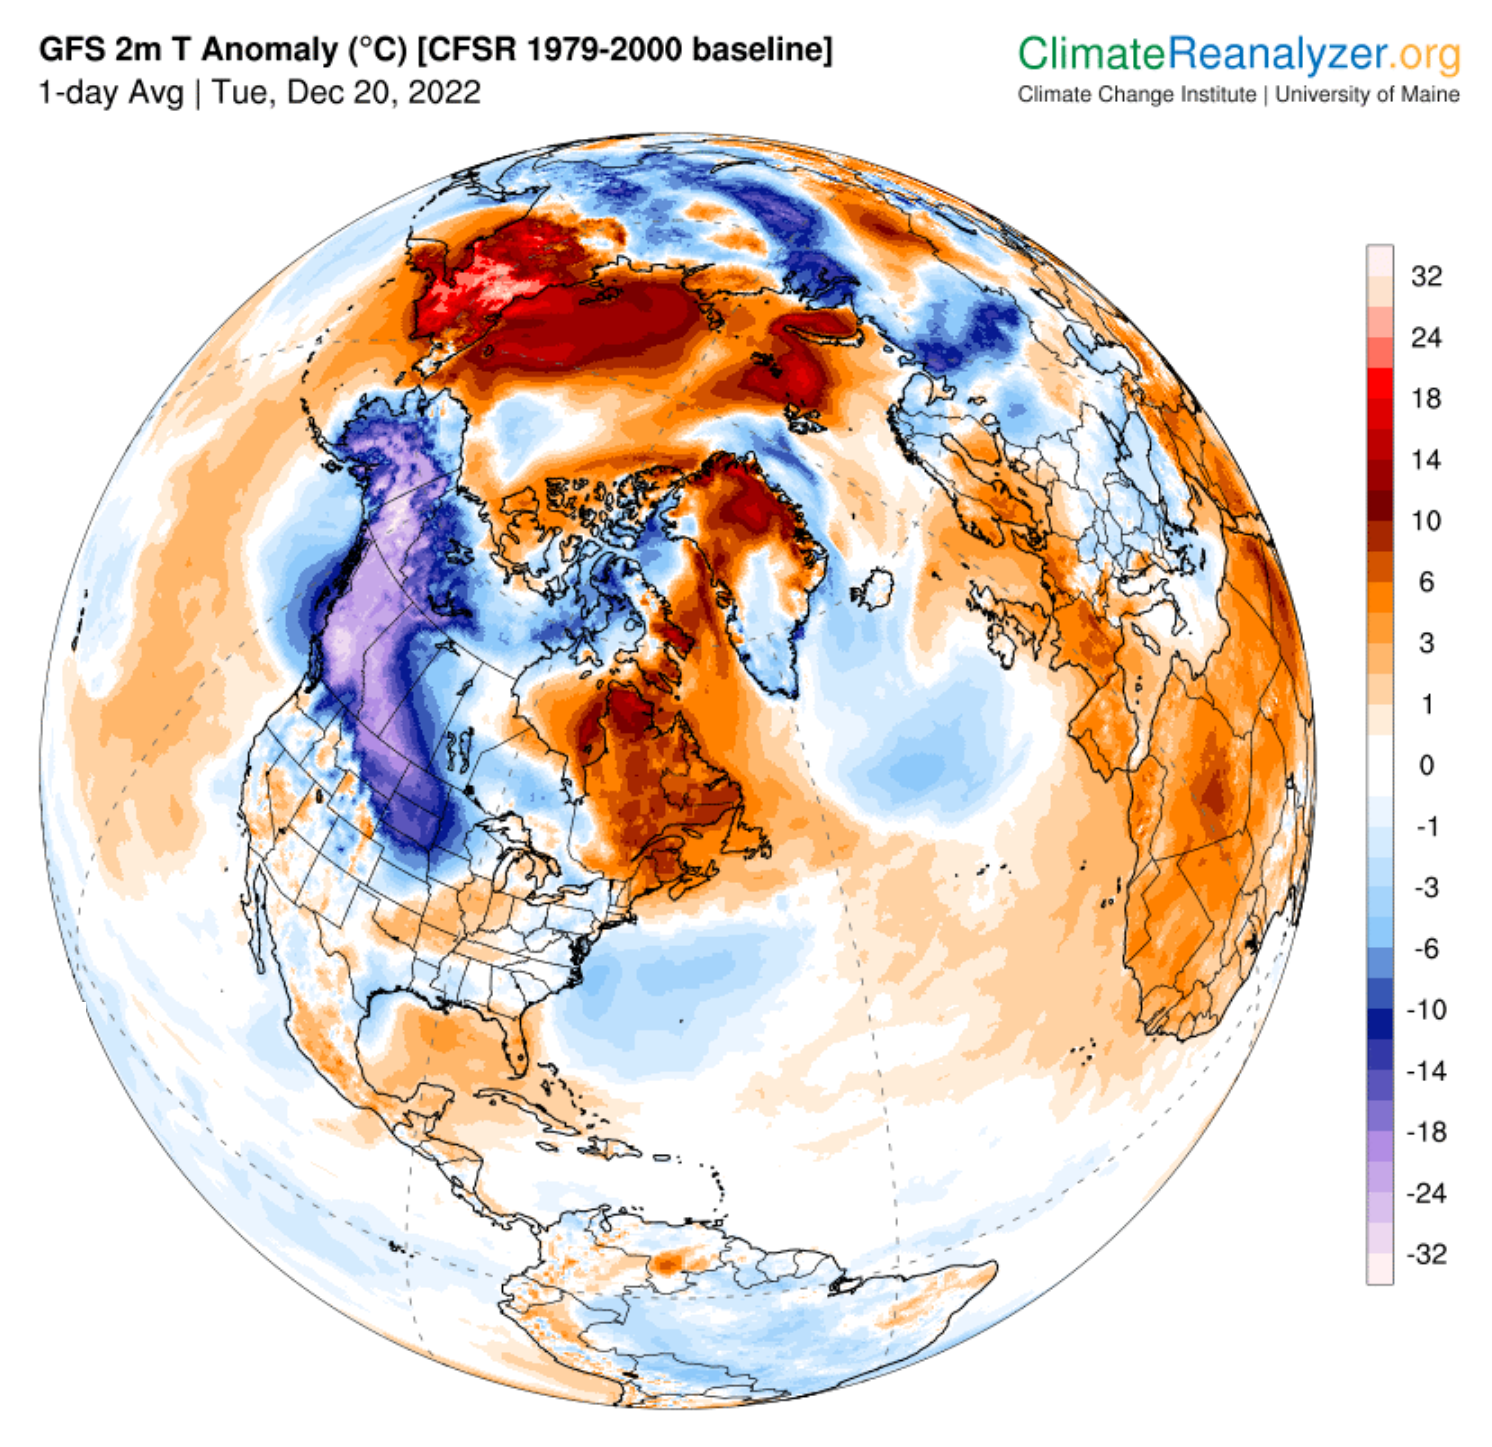
By Seth Borenstein 5 December 2022 (AP) – Much of the Arctic is in a burst of freak December warming. In Utqiagvik, Alaska’s northernmost community formerly known as Barrow, it hit 40 degrees (4.4 degrees Celsius) Monday morning. That’s not only a record by six degrees (3.3 degrees Celsius) but it’s the warmest that region has seen […]

Arctic annual air surface temperatures from October 2021 to September 2022 were the sixth warmest dating back to 1900. The image on the left depicts the departure from the average near-surface temperature across the Arctic during this period, with redder colors showing areas of greater than average warmth. The graphic on the right shows how the rate of Arctic air temperature warming has outpaced the rate of global warming. Data: ERA5 and NASA. Graphic: NOAA / Climate.gov

NOAA: Human-caused climate change fuels warmer, wetter, stormier Arctic

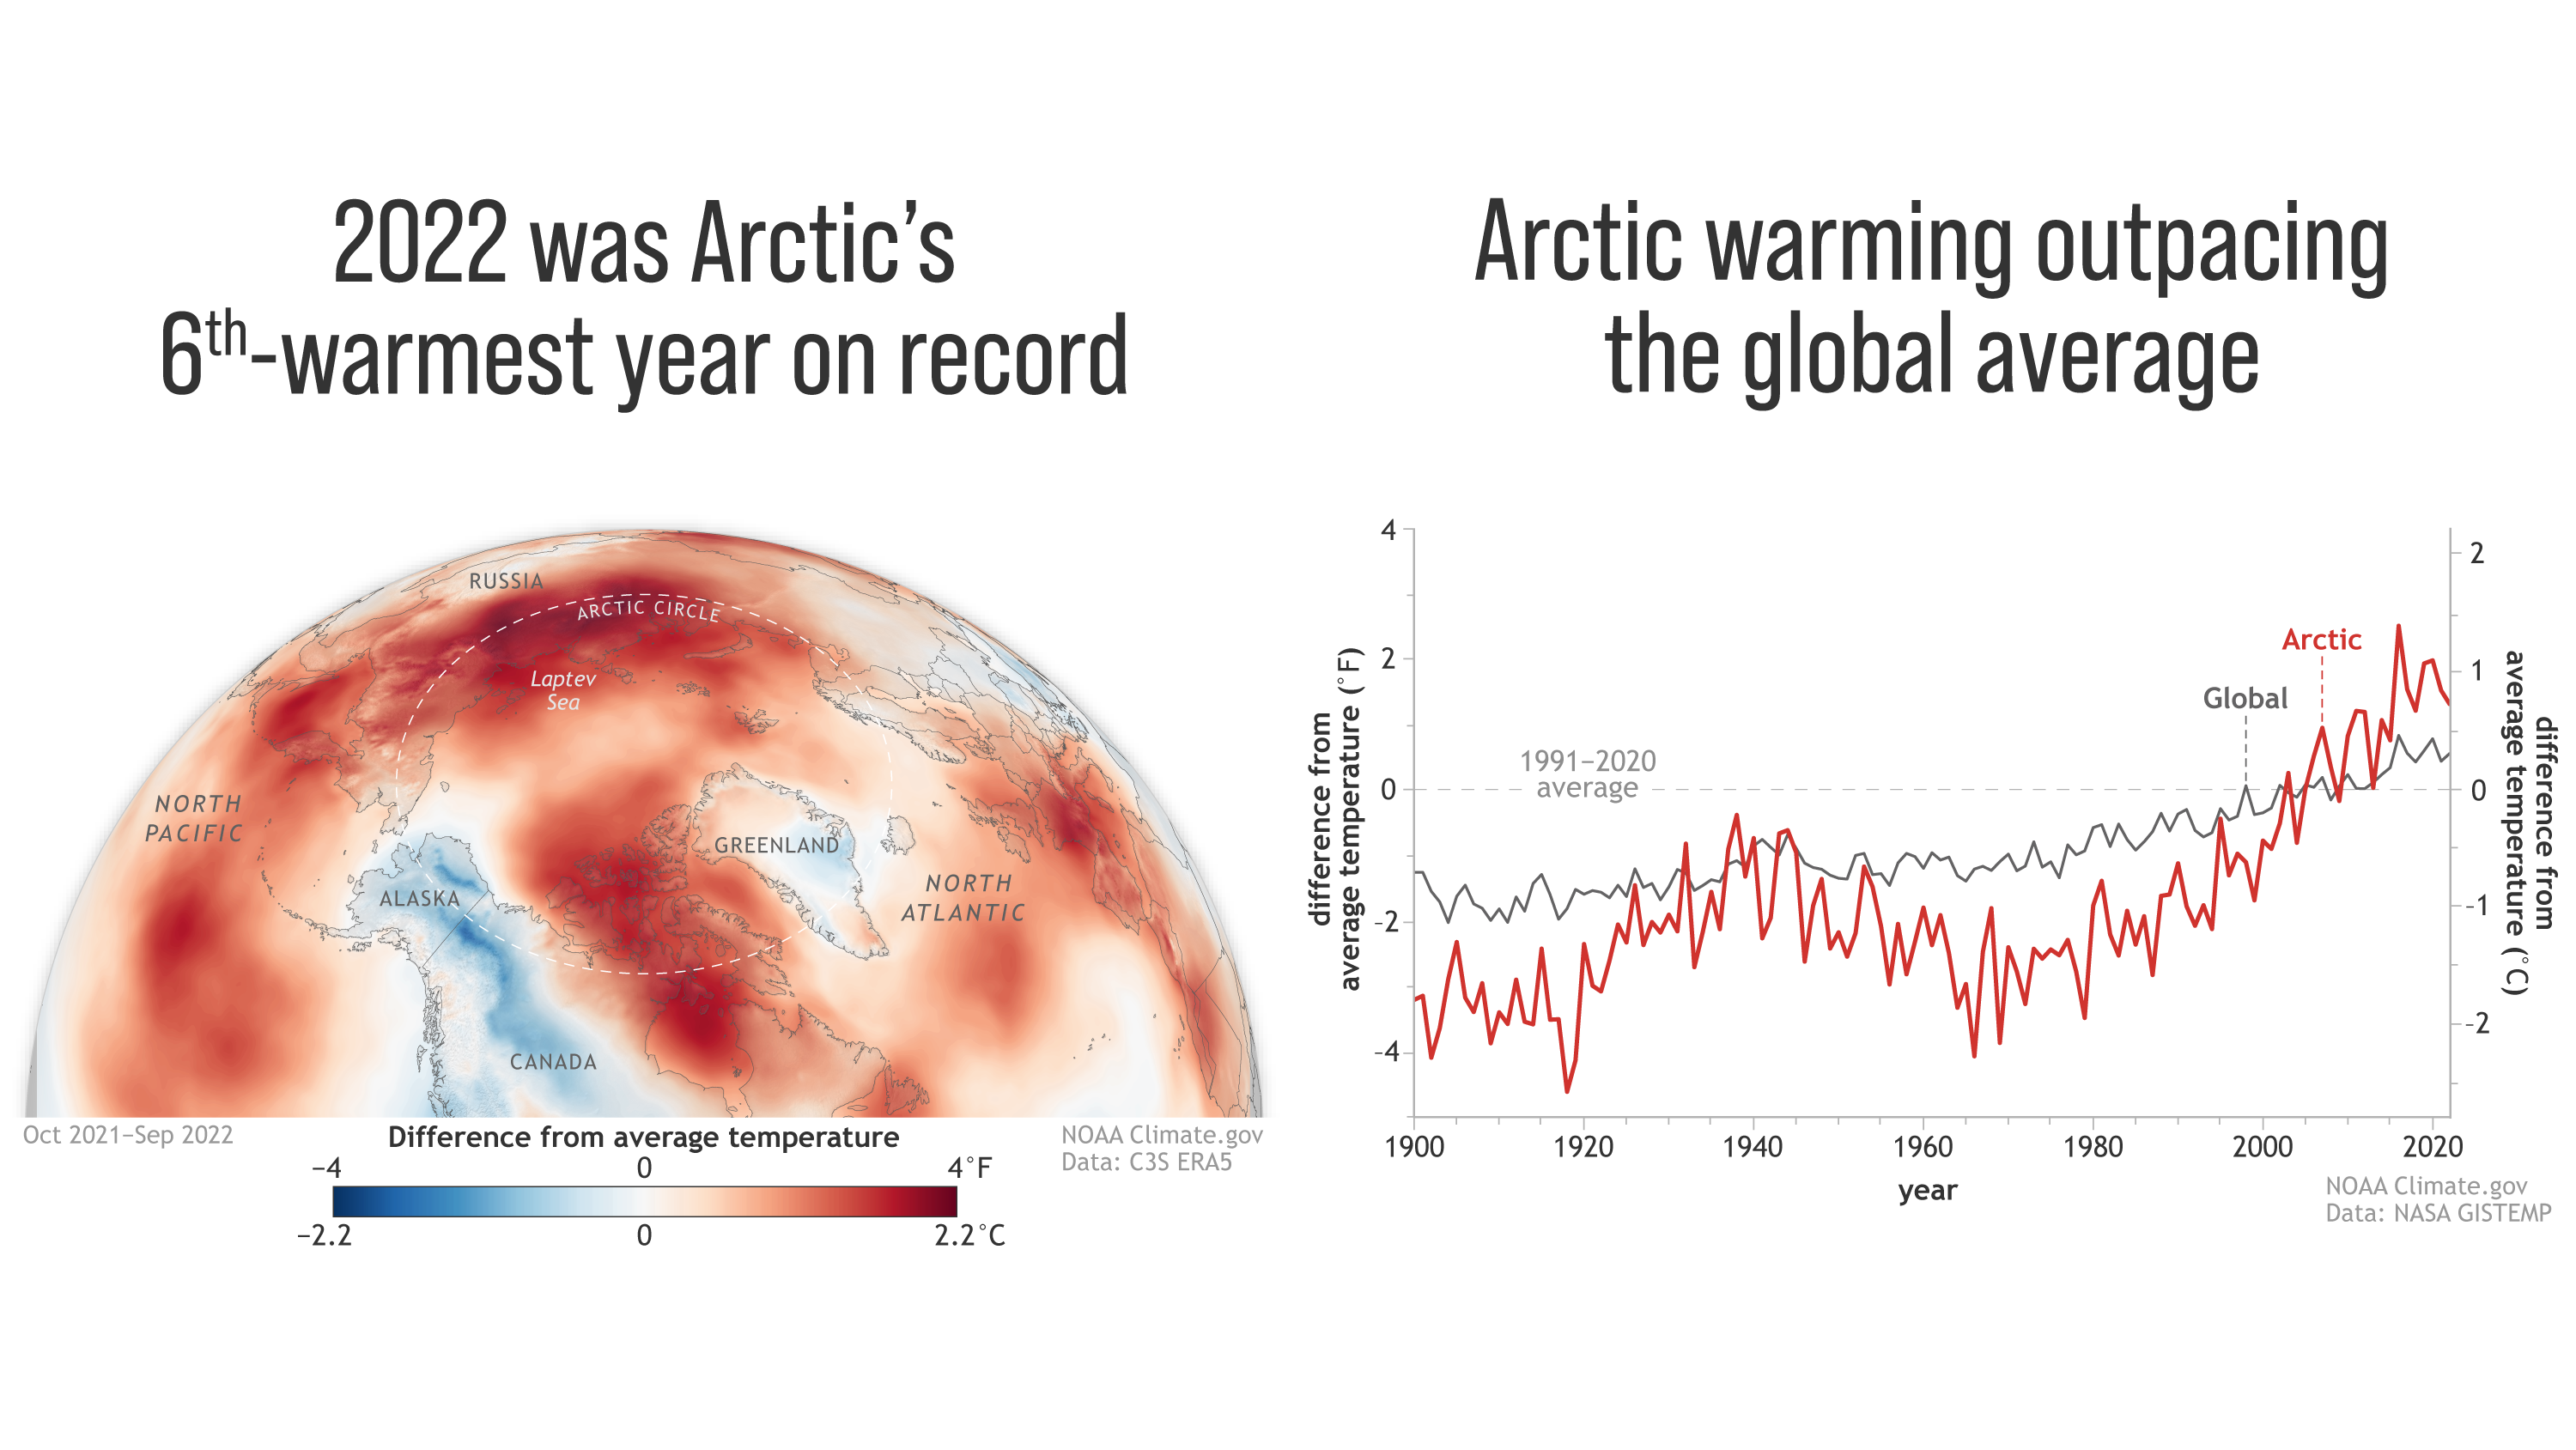
13 December 2022 (NOAA) – A typhoon, smoke from wildfires, and increasing rain are not what most imagine when thinking of the Arctic. Yet these are some of the climate-driven events included in NOAA’s 2022 Arctic Report Card, which provides a detailed picture of how warming is reshaping the once reliably frozen, snow-covered region which […]

Near-surface temperature differences relative to the 1981–2010 average for 2022 to September. The map shows the median anomaly calculated from six data sets: HadCRUT5, ERA5, JRA-55, GISTEMP, NOAAGlobalTemp, and Berkeley Earth. Graphic: WMO

State of the Global Climate 2022: Sea level rise accelerates, European glacier melt shatters records, extreme weather causes devastation – “What climate scientists have warned about for decades is upon us”

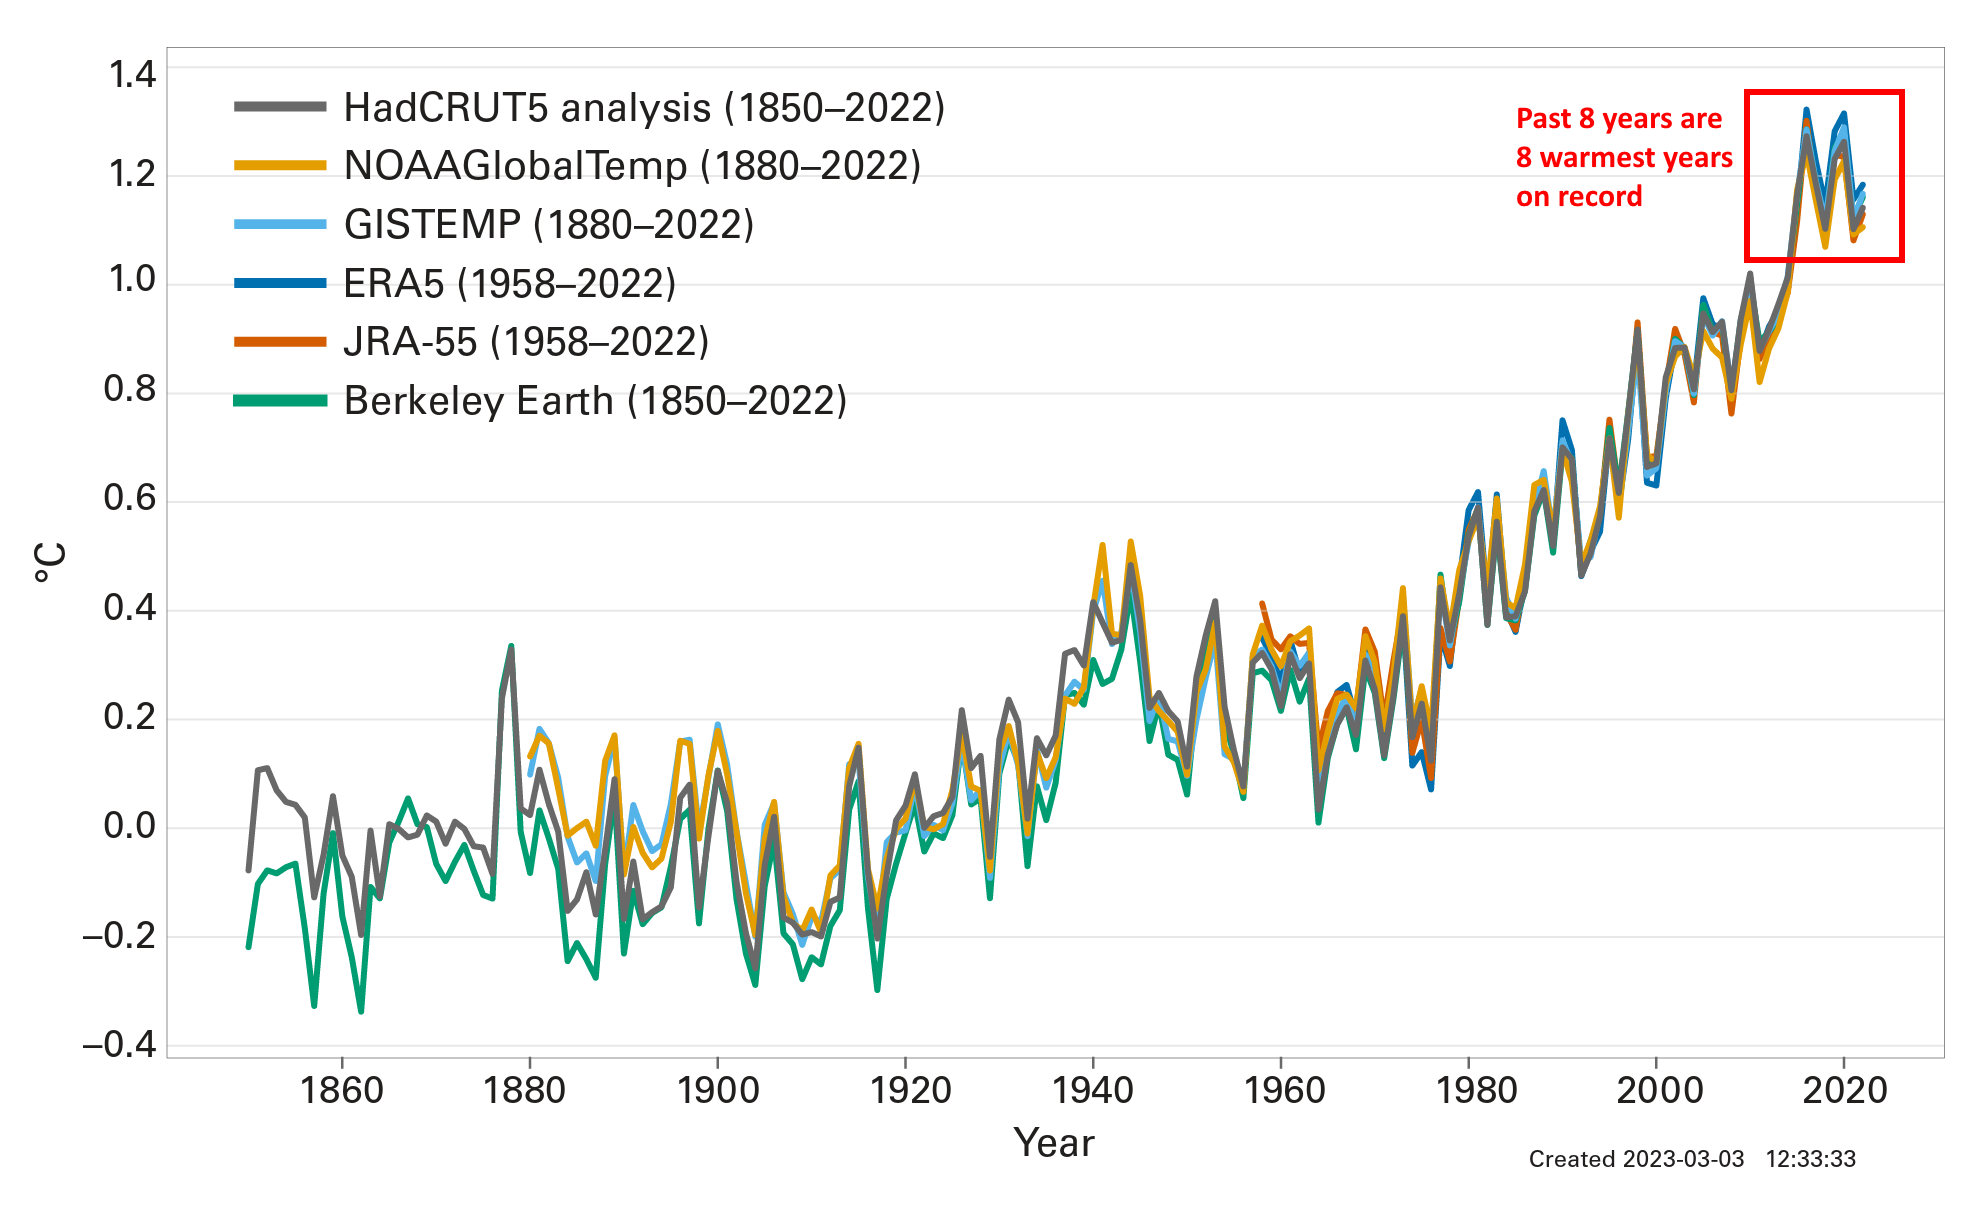
By Seth Borenstein 6 November 2022 SHARM EL-SHEIKH, Egypt (AP) – Earth’s warming weather and rising seas are getting worse and doing so faster than before, the World Meteorological Organization warned Sunday in a somber note as world leaders started gathering for international climate negotiations. [Eight warmest years on record witness upsurge in climate change impacts –Des] […]

Predicted (left) and observed (right) sea levels caused by melting of the Greenland Ice Sheet (GrIS). A statistically significant correlation between the two fields (P < 0.001) provides an unambiguous observational detection of the near-field sea level fingerprint of recent GrIS melting in our warming world. Graphic: Coulson, et al., 2022 / Science

Discovery of “fingerprint” confirms alarming predictions of Greenland ice sheet melt – “How fast the ice sheets in Greenland and Antarctica will respond to warming is a really big unknown, and frankly a very scary unknown”

By Sarah Sloat 29 September 2022 (NBC News) – Scientists now have unambiguous proof that a phenomenon critical to predicting the impact of climate change exists. Researchers announced Thursday that they had detected the sea level “fingerprint” of the Greenland ice sheet melt, pinpointing the unique pattern of sea level change linked to the melting ice.  It’s the […]

Social media & sharing icons powered by UltimatelySocial