Global annual mean temperature difference from pre-industrial conditions (1850–1900) for six global temperature data sets, 1850–2022. 2022 data are based on an average to September. Graphic: WMO

By Seth Borenstein
6 November 2022

SHARM EL-SHEIKH, Egypt (AP) – Earth’s warming weather and rising seas are getting worse and doing so faster than before, the World Meteorological Organization warned Sunday in a somber note as world leaders started gathering for international climate negotiations. [Eight warmest years on record witness upsurge in climate change impacts –Des]

“The latest State of the Global Climate report is a chronicle of climate chaos,” United Nations Secretary-General Antonio Guterres said. “We must answer the planet’s distress signal with action — ambitious, credible climate action.”

In its annual state of the climate report, the United Nations’ weather agency said that sea level rise in the past decade was double what it was in the 1990s and since January 2020 has jumped at a higher rate than that. Since the decade began, seas are rising at 5 millimeters a year (.2 inches) compared to 2.1 millimeters (.08 inches) in the 1990s.

The last eight years have been the warmest on record, the WMO said in a report that didn’t break new ground but was a collection of recent weather trends, data and impacts in one central place.

“The melting (of ice) game we have lost and also the sea level rate,” WMO chief Petteri Taalas told The Associated Press. “There are no positive indicators so far.”

Near-surface temperature differences relative to the 1981–2010 average for 2022 to September. The map shows the median anomaly calculated from six data sets: HadCRUT5, ERA5, JRA-55, GISTEMP, NOAAGlobalTemp, and Berkeley Earth. Graphic: WMO

The only reason that the globe hasn’t broken annual temperature records in the past few years is a rare three-year La Niña weather phenomenon, he said.

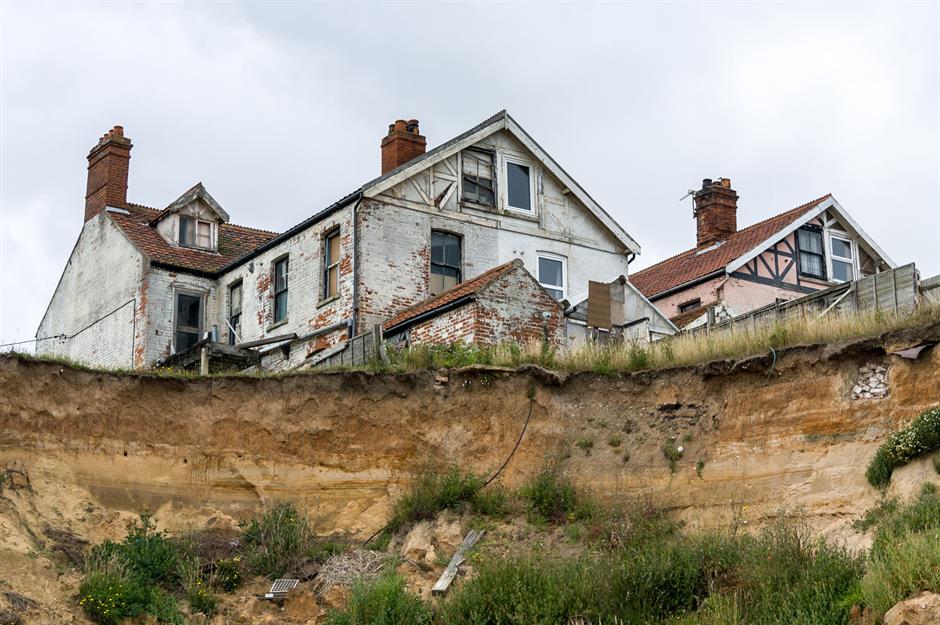
The data on sea level and average temperatures are nothing compared to how climate change has hit people in extreme weather. The report highlights the summer’s incredible flood in Pakistan that killed more than 1,700 people and displaced 7.9 million, a crippling four-year drought in East Africa that has more than 18 million hungry, the Yangtze River drying to its lowest level in August, and record heat-waves broiling people in Europe and China.

“This latest report from the World Meteorological Organization reads like a lab report for a critically ill patient, but in this case the patient is Earth,” said climate scientist Jennifer Francis of the Woodwell Climate Research Center in Cape Cod, who wasn’t part of the report.

Levels of heat-trapping carbon dioxide, methane, and nitrous oxide all reached record high levels, with potent methane increasing at a record pace, the report said.

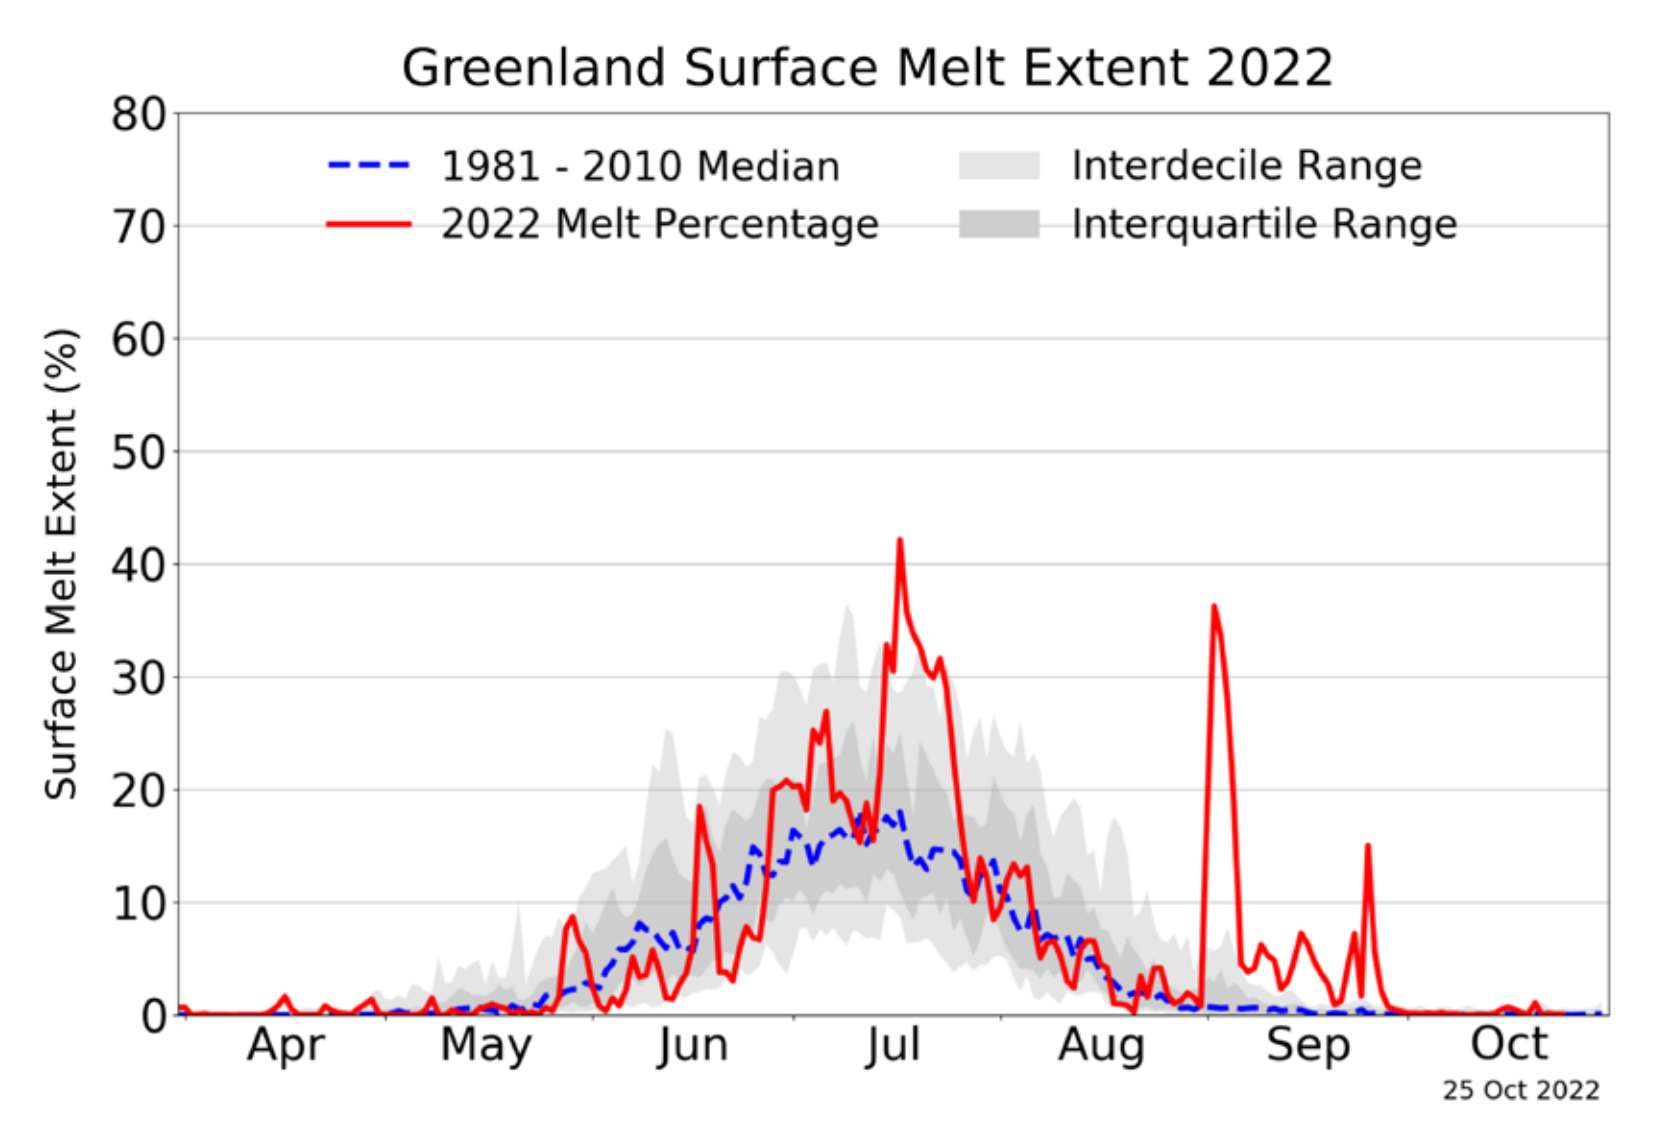
That means more than just warming temperatures on land. Ice, both Greenland’s ice sheet and the world’s glaciers, are shrinking precipitously, the report said. For the 26th year in a row, Greenland lost ice when all types of ice are factored in. The volume of glacier snow in Switzerland dropped by more than one-third from 2001 to 2022, the report said.

Ocean heat content, 1960-2021. The 1960-2021 ensemble mean time series and ensemble standard deviation (2-standard deviations, shaded) of global ocean heat content (OHC) anomalies relative to the 2005-2017 average for the 0-300m (grey), 0-700m (blue), 0-2000m (yellow) and 700-2000m depth layer (green). The upper 2000m of the ocean continued to warm in 2021 (the latest year for which consolidated figures are available) and it is expected that it will continue to warm in the future – a change which is irreversible on centennial to millennial time scales. The ocean heat content in 2021 was the highest on record, exceeding the 2020 value by 14 ± 9 ZJ. All data sets agree that ocean warming rates show a particularly strong increase in the past two decades. The rate of ocean warming for the 0-2000m layer was 0.6 ± 0.1 W·m-2 from 1971-2021, but 1.0 ± 0.1 W·m-2 from 2006-2021. The ensemble mean is an update of the outcome of a concerted international effort, and all products used are referenced in the section on Ocean heat content data. Note that values are given for the ocean surface area between 60°S-60°N and limited to areas deeper than 300m in each product. The ensemble-mean OHC anomalies for the year 2021 has been added as separate points, together with their ensemble spread, and is based on the 4 products listed in Ocean heat content. Graphic: WMO

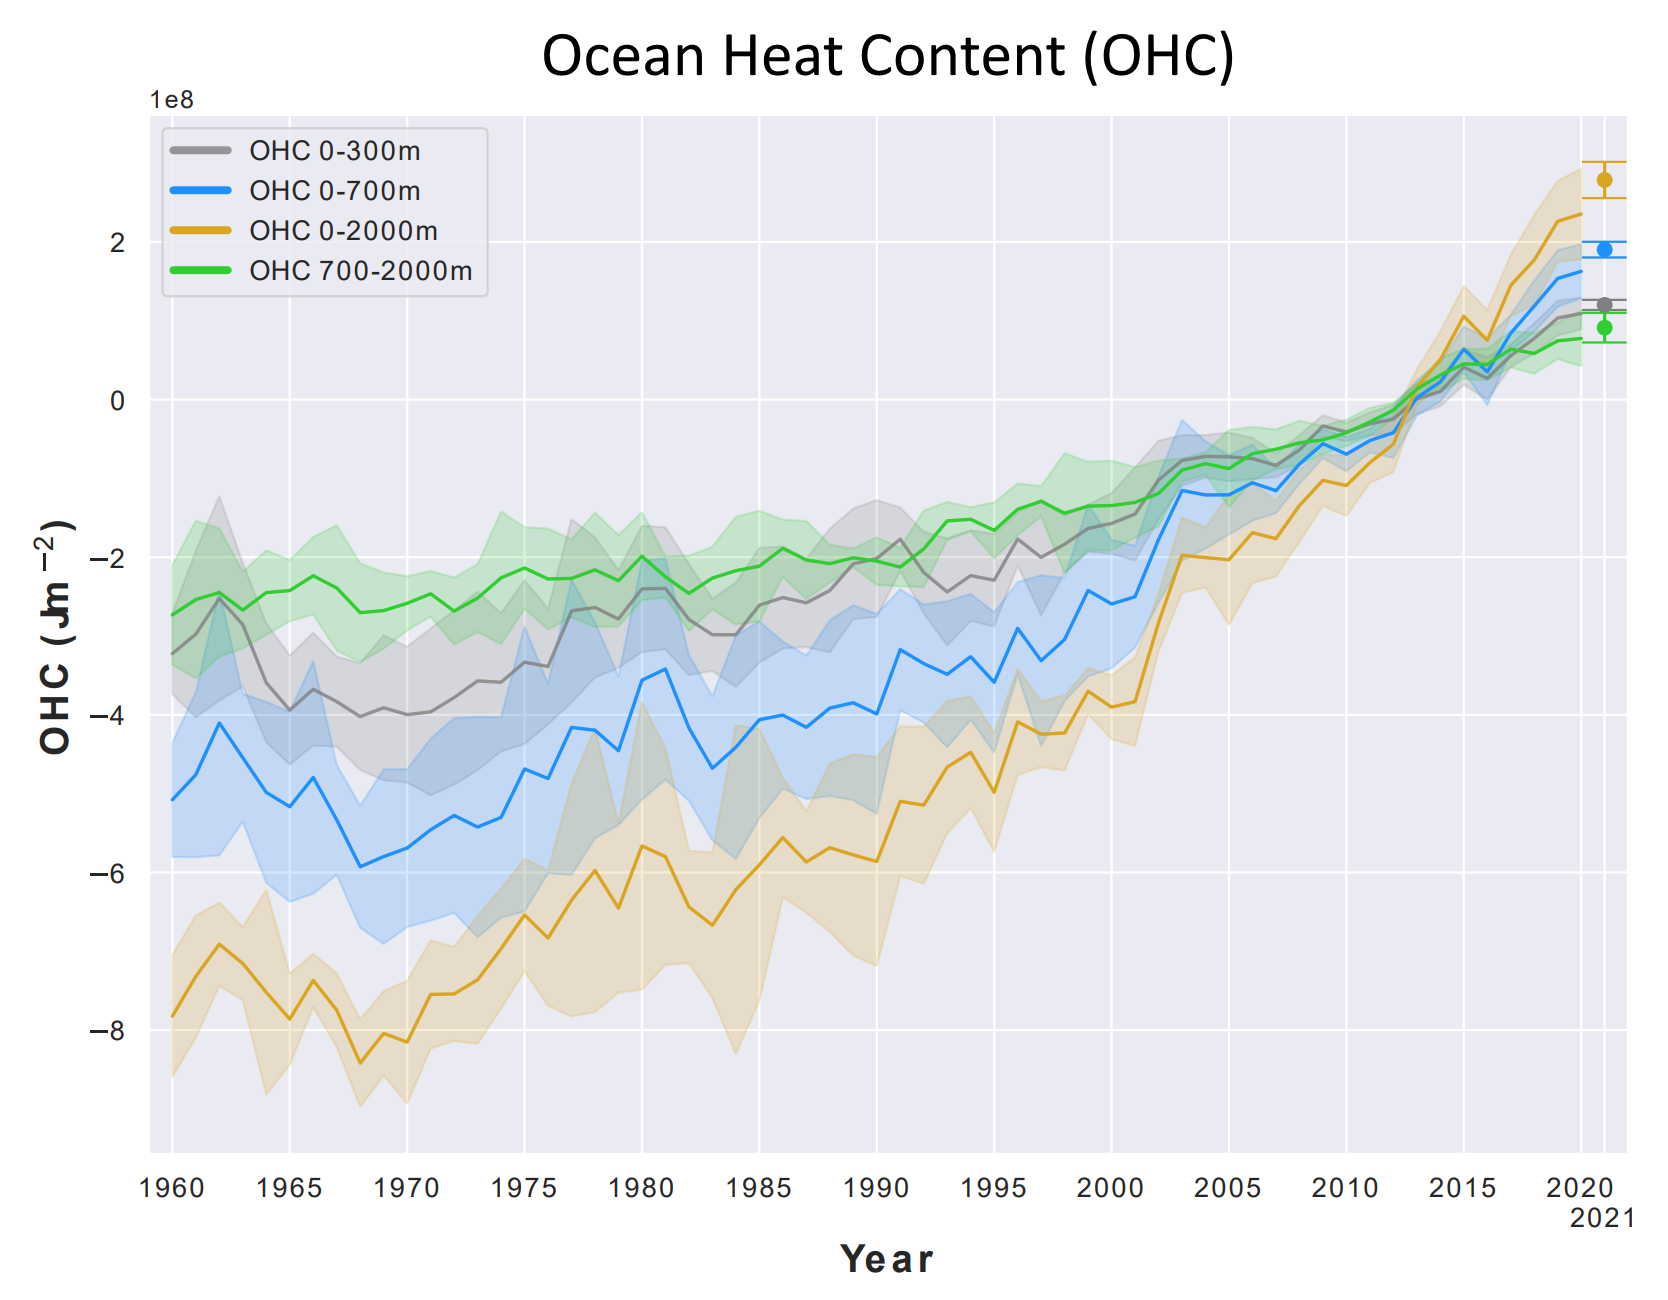
But 90% of the heat trapped on Earth goes into the ocean and the upper 2000 meters (6561 feet) of the ocean is getting warmer faster. The rate of warming the last 15 years is 67% faster than since 1971, the report said.

That ocean heat “will continue to warm in the future – a change which is irreversible on centennial to millennial time scales,” the report said.

Outside experts weren’t surprised by the report and said no one should be.

“What climate scientists have warned about for decades is upon us. And will continue to worsen without action,” said University of Georgia meteorology professor Marshall Shepherd. “Two things must go away: Climate delayism and speaking about climate change impacts in the future tense. It’s here.”

UN weather report: Climate woes bad and getting worse faster


Eight warmest years on record witness upsurge in climate change impacts

Sharm-El-Sheikh, Egypt 6 November (WMO) – The past eight years are on track to be the eight warmest on record, fuelled by ever-rising greenhouse gas concentrations and accumulated heat. Extreme heatwaves, drought, and devastating flooding have affected millions and cost billions this year, according to the World Meteorological Organization’s provisional State of the Global Climate in 2022 report.

2022 took an exceptionally heavy toll on glaciers in the European Alps, with initial indications of record-shattering melt. The Greenland ice sheet lost mass for the 26th consecutive year and it rained (rather than snowed) there for the first time in September.

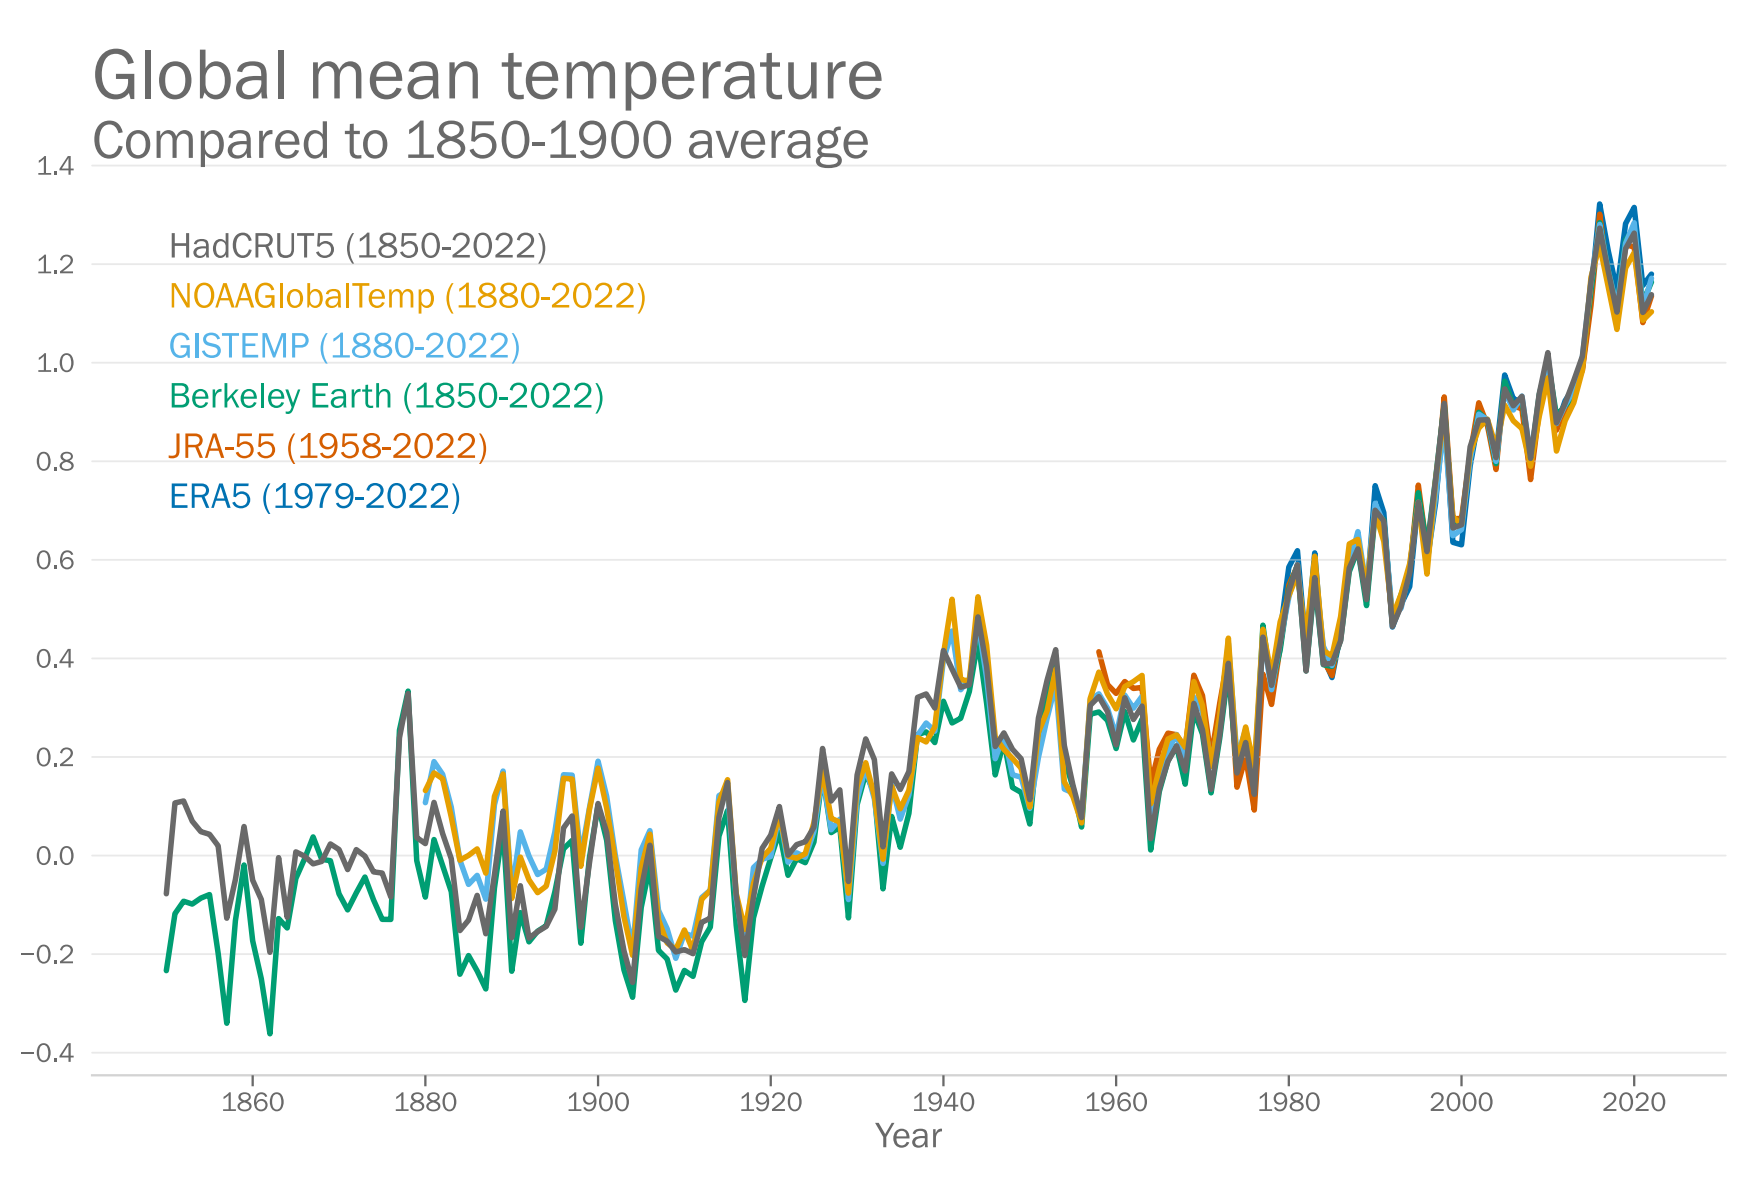
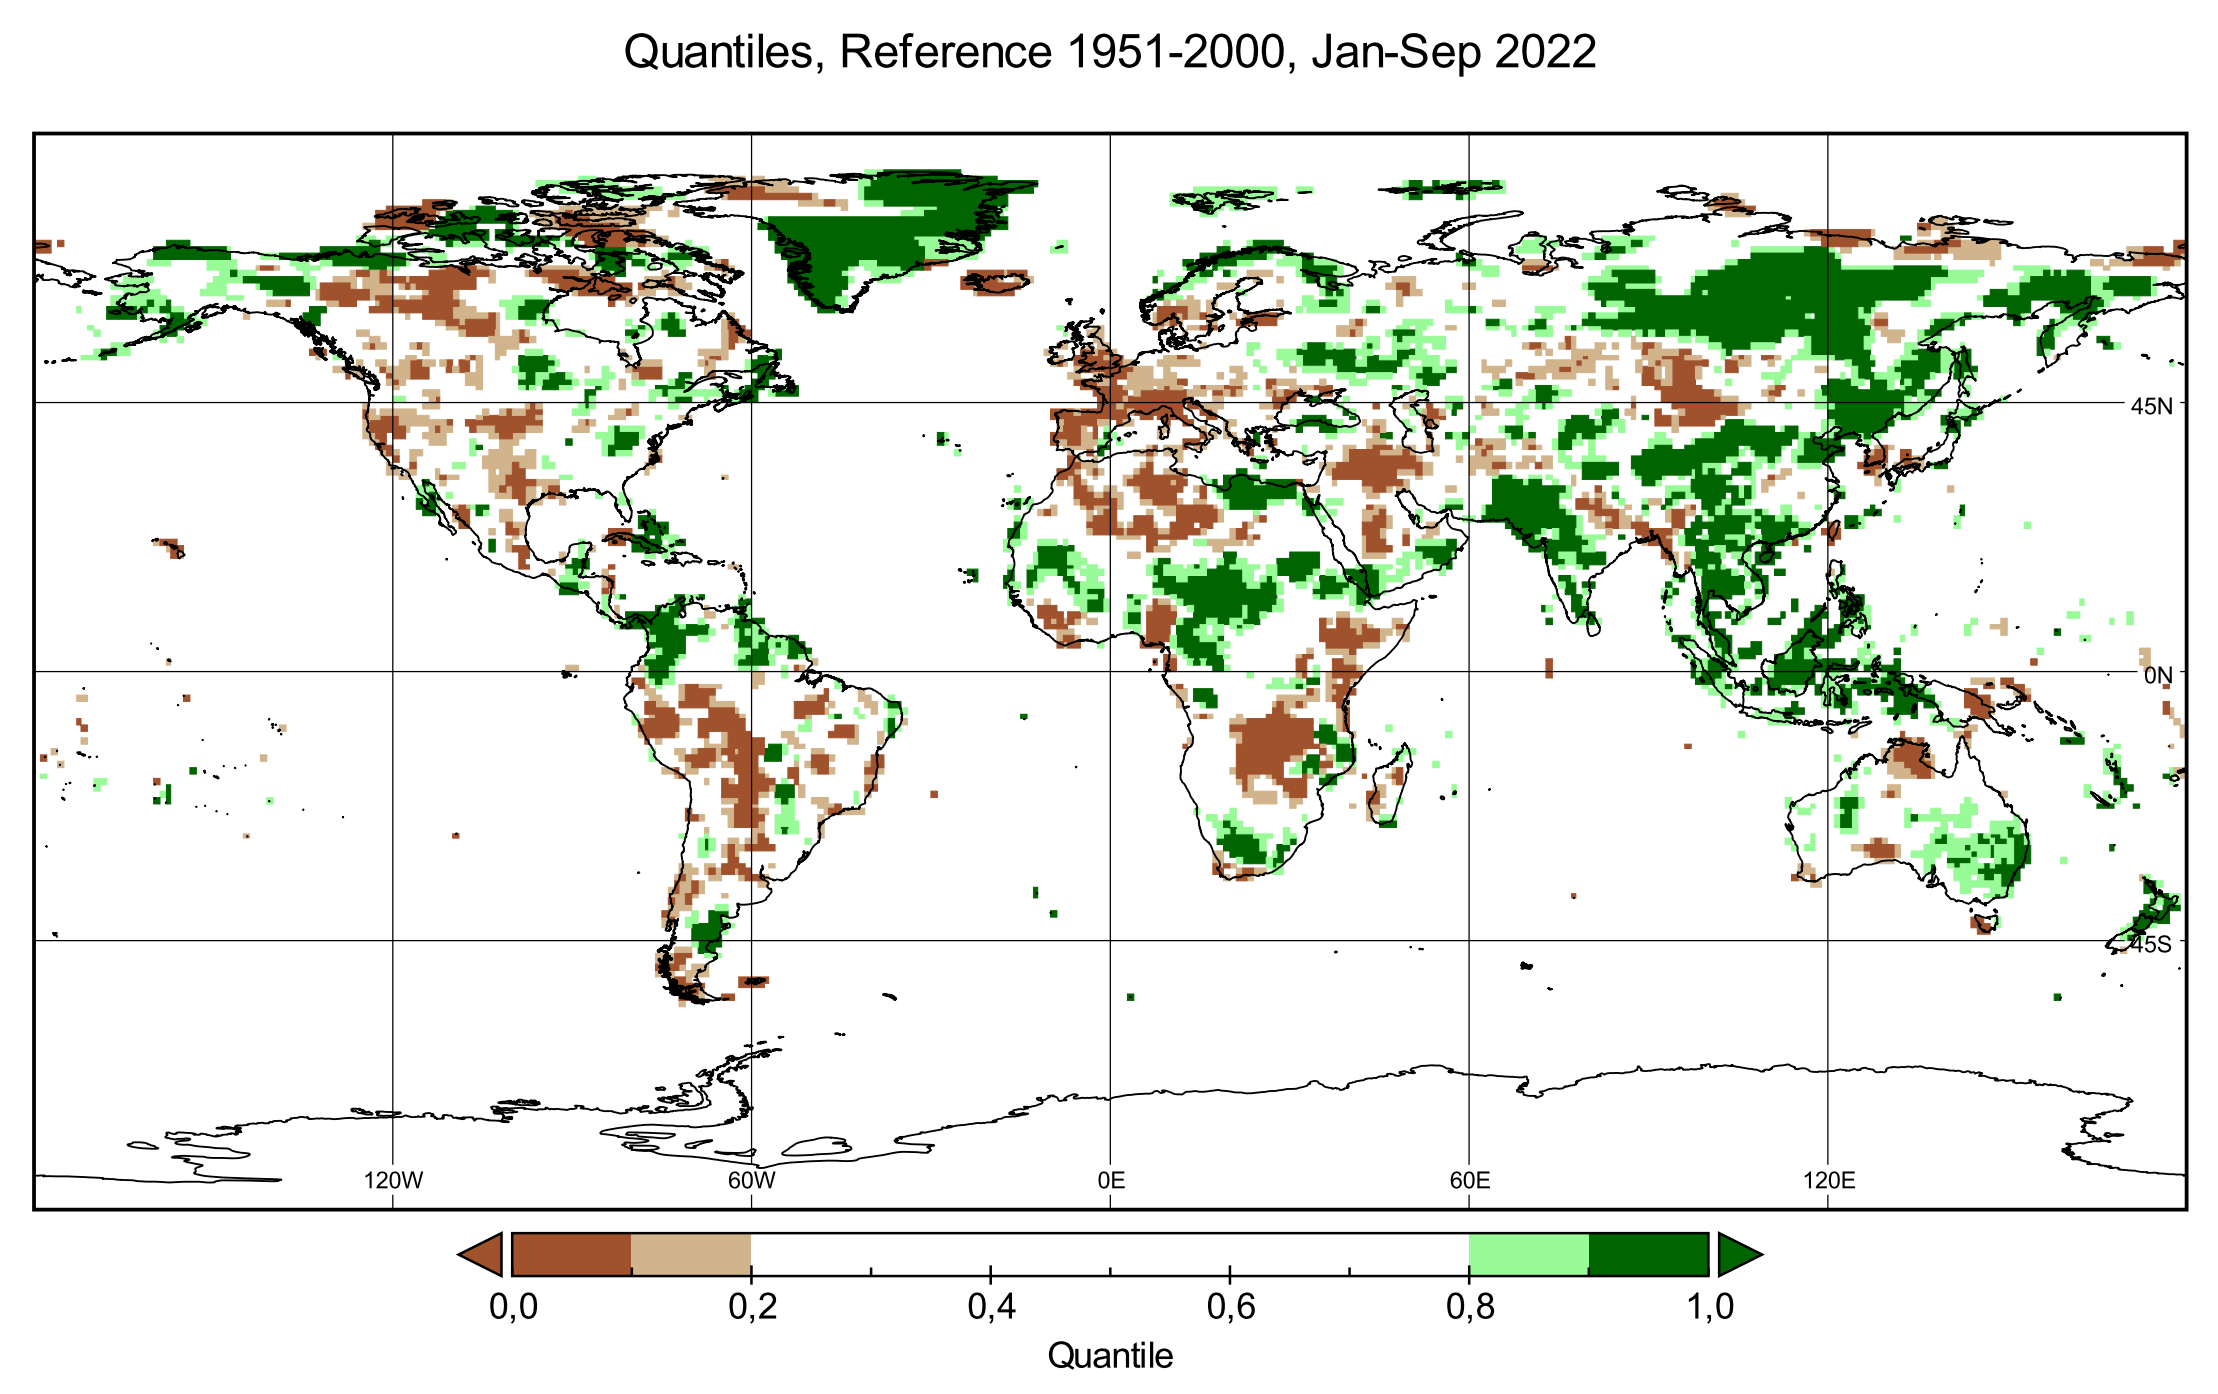
The global mean temperature in 2022 is currently estimated to be about 1.15 [1.02 to 1.28] °C above the 1850-1900 pre-industrial average. A rare triple-dip cooling La Niña means that 2022 is likely to “only” be fifth or sixth warmest. However, this does not reverse the long-term trend; it is only a matter of time until there is another warmest year on record.

Indeed, the warming continues. The 10-year average for the period 2013-2022 is estimated to be 1.14 [1.02 to 1.27] °C above the 1850-1900 pre-industrial baseline. This compares with 1.09°C from 2011 to 2020, as estimated by the Intergovernmental Panel on Climate Change (IPCC) Sixth Assessment report.

(a) Global map showing the highest MHW category (for definitions, see Marine heatwave and marine cold-spell data) experienced at each pixel over 2022 to 17 October 2022 (reference period 1982–2011). Light grey indicates that no MHW occurred in a pixel over the entire year; (b) Stacked bar plot showing the percentage of the surface of the ocean experiencing an MHW on any given day of the year; (c) Stacked bar plot showing the cumulative percentage of the surface of the ocean that experienced an MHW over the year. Graphic: WMO

Ocean heat was at record levels in 2021 (the latest year assessed), with the warming rate particularly high in the past 20 years.

“The greater the warming, the worse the impacts. We have such high levels of carbon dioxide in the atmosphere now that the lower 1.5°C of the Paris Agreement is barely within reach,” said WMO Secretary-General Prof Petteri Taalas.

“It’s already too late for many glaciers and the melting will continue for hundreds if not thousands of years, with major implications for water security. The rate of sea level rise has doubled in the past 30 years. Although we still measure this in terms of millimetres per year, it adds up to half to one meter per century and that is a long-term and major threat to many millions of coastal dwellers and low-lying states,” he said.

“All too often, those least responsible for climate change suffer most – as we have seen with the terrible flooding in Pakistan and deadly, long-running drought in the Horn of Africa. But even well-prepared societies this year have been ravaged by extremes – as seen by the protracted heatwaves and drought in large parts of Europe and southern China,” said Prof. Taalas.

“Increasingly extreme weather makes it more important than ever to ensure that everyone on Earth has access to life-saving early warnings.”

Total annual loss of Swiss glaciers related to the current ice volume, 2002-2022. The vertical bars indicate the percentage change in ice volume relative to the previous year. Red bars are the 10 largest relative mass losses on record. The purple bar is the relative mass loss for 2022. The blue shaded area in the background represents the overall ice volume. In the European Alps, records of glacier mass loss were shattered in 2022. Mass losses were far beyond the range of historical variability. Average thickness changes of between 3 and over 4 metres were measured throughout the Alps, substantially more than in the previous record year 2003. In Switzerland 6 percent of the glacier ice volume was lost between 2021 and 2022. There are three reasons for this extreme glacier melt. First, there was very little winter snow and this meant that the ice was unprotected in early summer. Second, Saharan dust blew over the Alps darkening the snow surface, thus further accelerating melt. Third, long and persistent heat waves between May and early September 2022 led to massive ice loss. For the first time in history, no snow outlasted the summer season even at the very highest measurement sites and thus no accumulation of fresh ice occurred. Between 2001 and 2022 the volume of glacier ice in Switzerland decreased from 77 km3 to 49 km3, a decline of more than a third. Graphic: WMO

WMO released the provisional State of the Global Climate report and an accompanying interactive storymap on the eve of the UN climate negotiations in Sharm-El-Sheikh, COP27. UN Secretary-General Antonio Guterres will unveil an Action Plan at COP27 to achieve Early Warnings for All in the next five years. Currently half the countries in the world lack these. Mr Guterres has asked WMO to spearhead the initiative.

The WMO State of the Global Climate report is produced annually. It provides an authoritative voice on the current state of the climate using key climate indicators and reporting on extreme events and their impacts. The temperature figures used in the provisional 2022 report are until the end of September. The final version will be issued next April.

Highlights

Concentrations of the main greenhouse gases – carbon dioxide, methane, and nitrous oxide – once again reached record levels in 2021. The annual increase in methane concentration was the highest on record. Data from key monitoring stations show atmospheric levels of the three gases continue to increase in 2022.

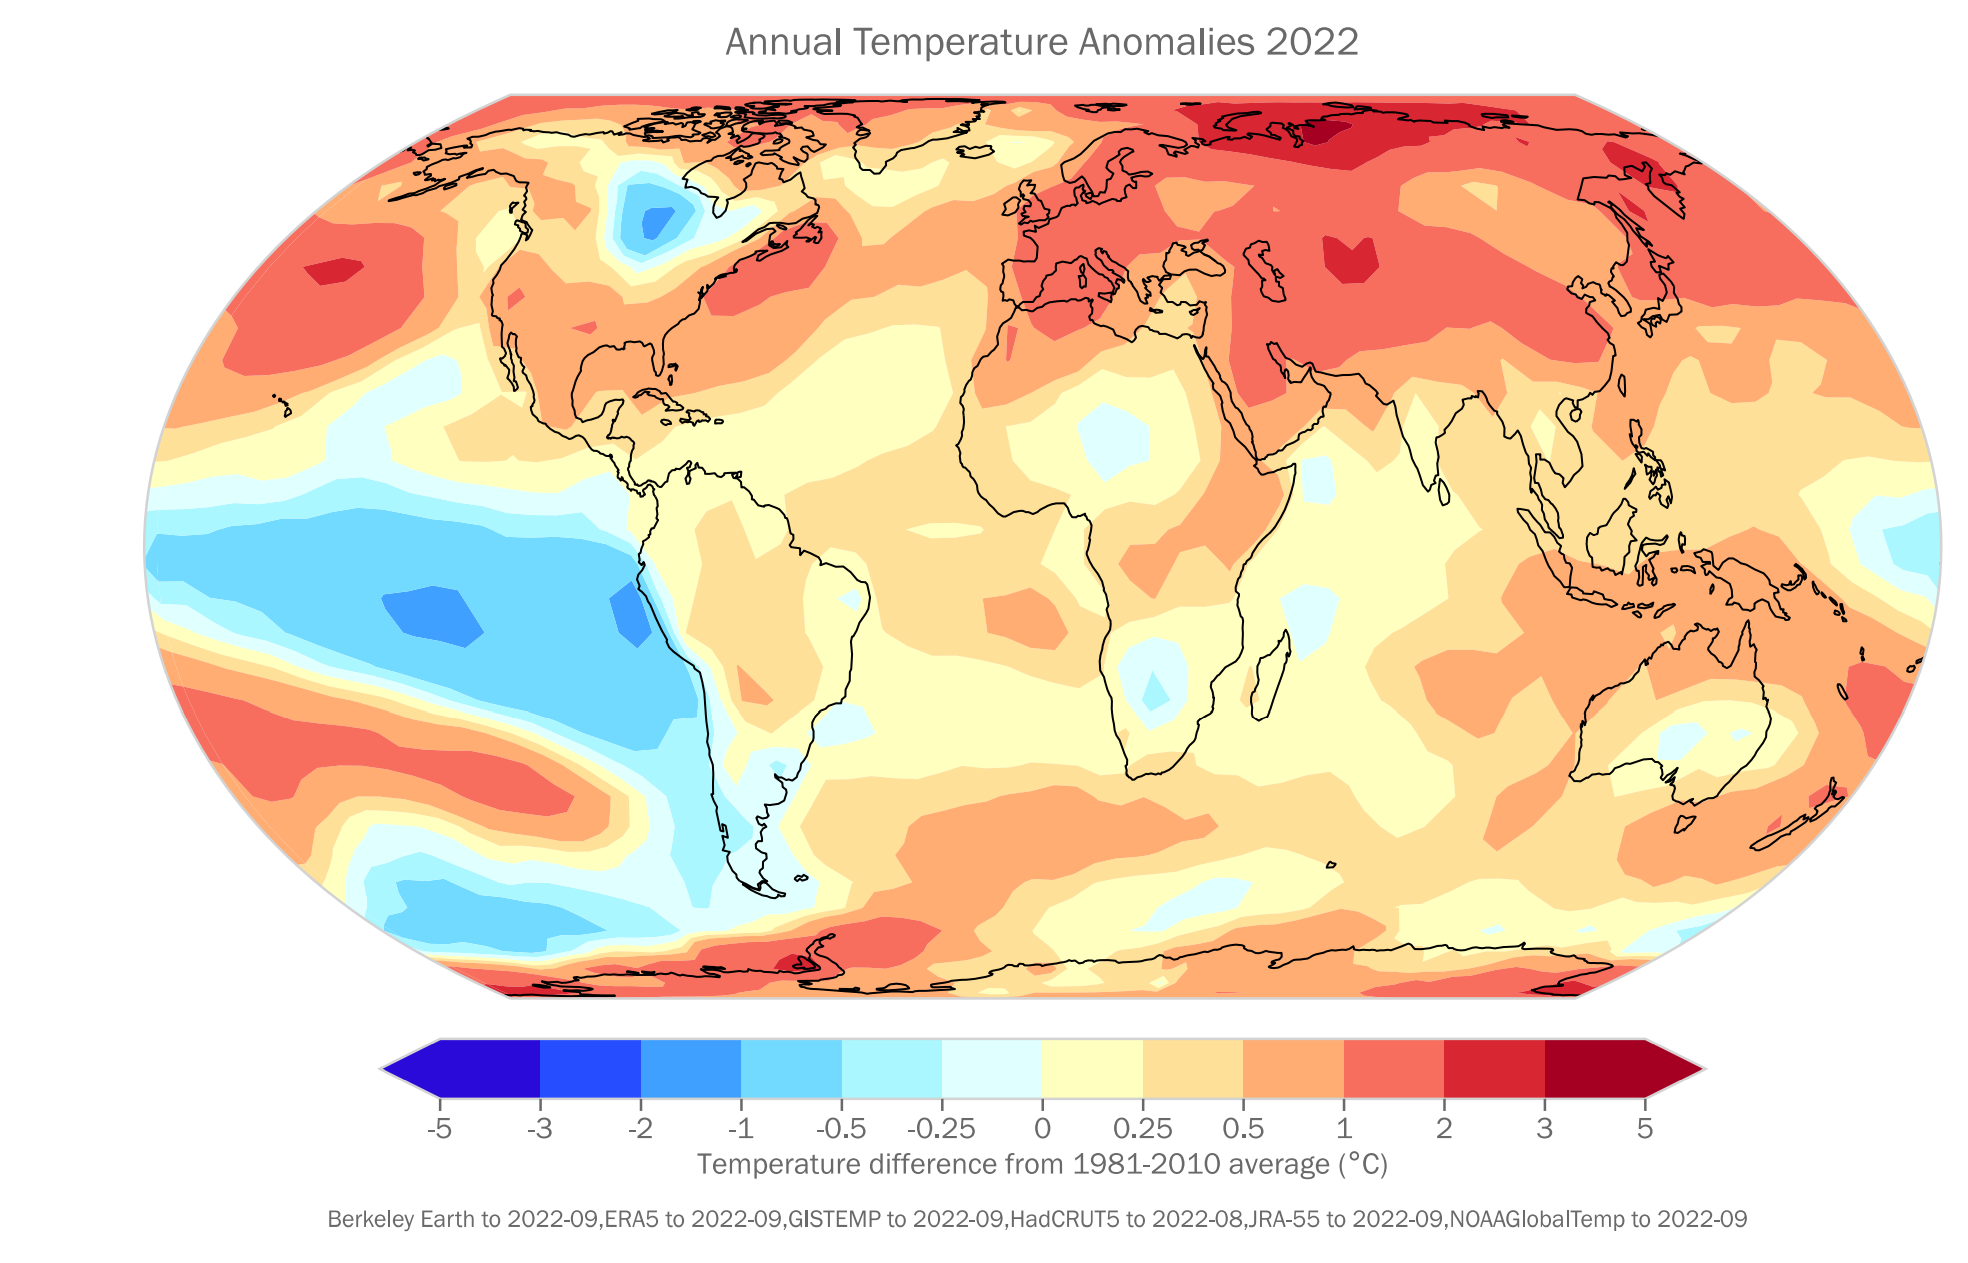
Temperature: The global average temperature in 2022 is estimated to be about 1.15 [1.02 to 1.28] °C above the 1850-1900 average. 2015 to 2022 are likely to be the eight warmest years on record. La Niña conditions have dominated since late 2020 and are expected to continue until the end of 2022. Continuing La Niña has kept global temperatures relatively «low» for the past two years – albeit higher than the last significant La Niña in 2011.

Greenland Ice Sheet melt extent, 2022. For Greenland, the estimated total mass balance was -85 Gt representing a net ice loss during the 2022 mass balance year (1 September 2021 – 31 August 2022). This year, the Greenland ice sheet ended with a surface mass balance of about 423 Gt, which is the 10th highest value in the dataset that goes back 1980. Nevertheless, the Greenland Ice Sheet ended with a negative total mass balance for the 26th year in a row, mainly due to the strong negative marine mass balance of -486 Gt. The melting and ablation seasons in Greenland began late in 2022 and the summer was relatively cool compared with recent years. However, there was a period of high temperatures at the end of July 2022 with intense surface melt over large parts of the ice sheet and large ice losses over a few days. September 2022 was also extraordinarily warm, with widespread and generally high positive temperature anomalies along with widespread melting early in the month. Summit Station, the highest point in Greenland (3,200 m), had its warmest September on record (since 1991) and experienced melting conditions on 3 September 2022, the first time melting has been registered at this site in September. Later in September, heavy rain associated with post-tropical cyclone Fiona fell on the ice sheet, also a first for September. Graphic: Thomas Mote / U.S. National Snow and Ice Data Center

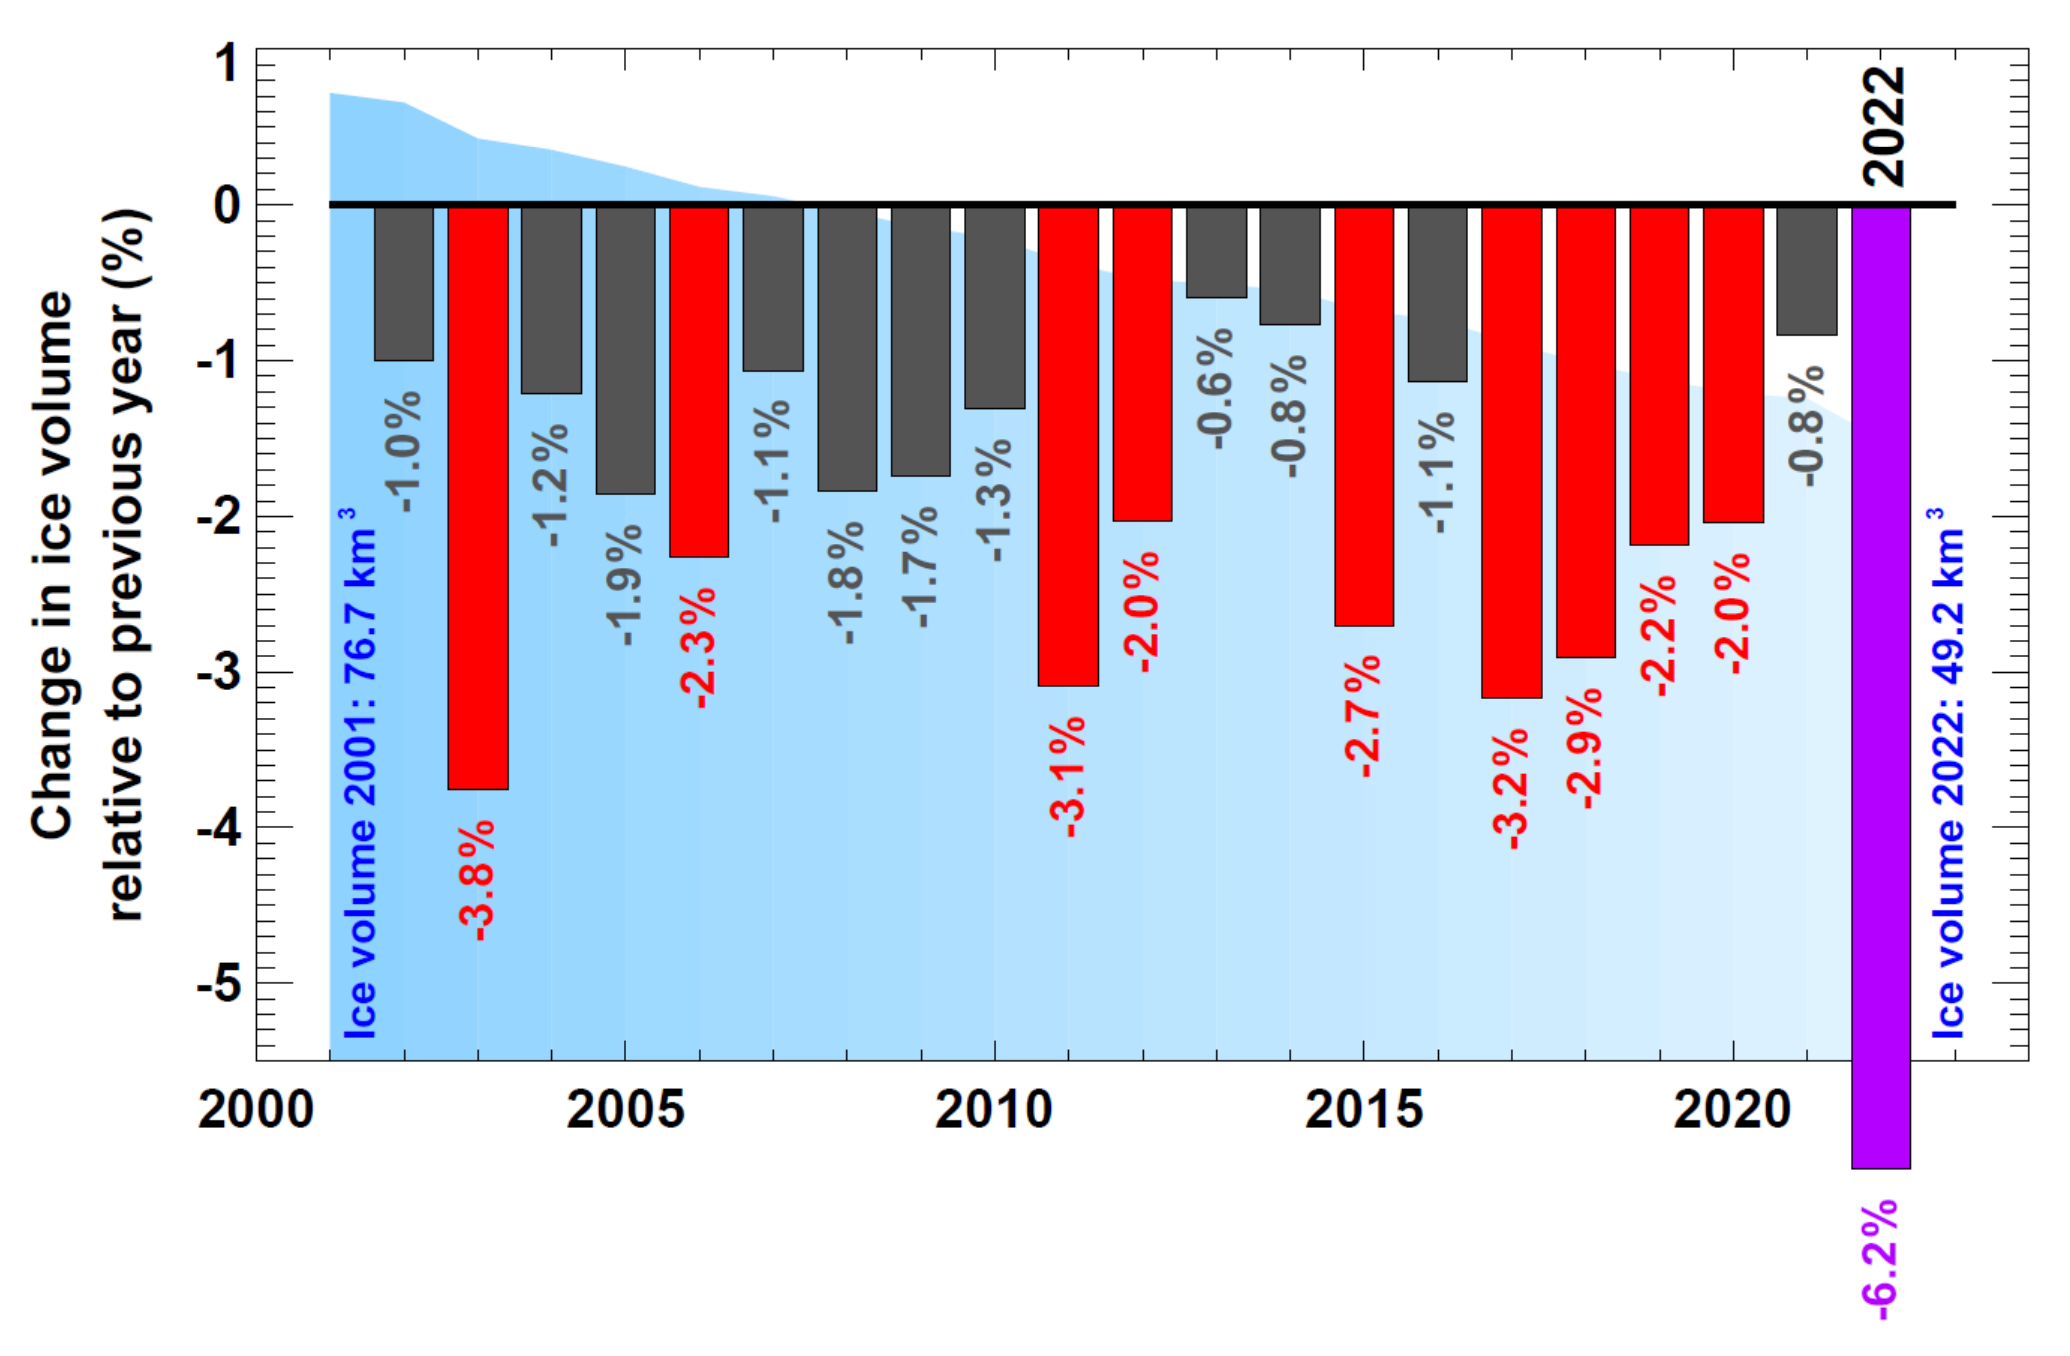
Glaciers and ice: In the European Alps, glacier melt records were shattered in 2022. Average thickness losses of between 3 and over 4 metres were measured throughout the Alps, substantially more than in the previous record year 2003.

In Switzerland, 6% of the glacier ice volume was lost between 2021 and 2022, according to initial measurements. For the first time in history, no snow outlasted the summer season even at the very highest measurement sites and thus no accumulation of fresh ice occurred. Between 2001 and 2022 the volume of glacier ice in Switzerland decreased from 77 km3 to 49 km3, a decline of more than a third.

A low snowpack at the end of winter and repeated coverings of Saharan dust set the scene for unprecedented ice loss between May and early September as a result of the long and intense heatwaves.

Global mean sea level evolution, January 1993 - August 2022 (black curve) with associated uncertainty (shaded area) The horizontal, coloured straight lines represent the average linear trends over three successive time spans. In 2022, global mean sea level (GMSL) continued to rise. The GMSL rise is estimated to be 3.4 ± 0.3 mm·yr -1 over the 30 years (1993-2022) of the satellite altimeter record, but the rate has doubled between the first decade of the record (1993-2002) and the last (2013-2022) during which the rate has exceeded 4.4 mm·yr -1. The GMSL acceleration is estimated to be 0.12 ± 0.05 mm·yr -2 over the 30-year period. GMSL increased by about 5 mm between January 2021 and August 2022. Since January 2020, the increase in GMSL amounts to around 10 mm, a substantial fraction of the GMSL rise since 1993 (around 100 mm), despite the ongoing La Niña. Date: LEGOS / AVISO altimetry www.aviso.altimetry.fr. Graphic: WMO
Global mean sea level evolution, January 1993 – August 2022 (black curve) with associated uncertainty (shaded area) The horizontal, coloured straight lines represent the average linear trends over three successive time spans. In 2022, global mean sea level (GMSL) continued to rise. The GMSL rise is estimated to be 3.4 ± 0.3 mm·yr-1 over the 30 years (1993-2022) of the satellite altimeter record, but the rate has doubled between the first decade of the record (1993-2002) and the last (2013-2022) during which the rate has exceeded 4.4 mm·yr-1. The GMSL acceleration is estimated to be 0.12 ± 0.05 mm·yr-2 over the 30-year period. GMSL increased by about 5 mm between January 2021 and August 2022. Since January 2020, the increase in GMSL amounts to around 10 mm, a substantial fraction of the GMSL rise since 1993 (around 100 mm), despite the ongoing La Niña. Date: LEGOS / AVISO altimetry www.aviso.altimetry.fr. Graphic: WMO

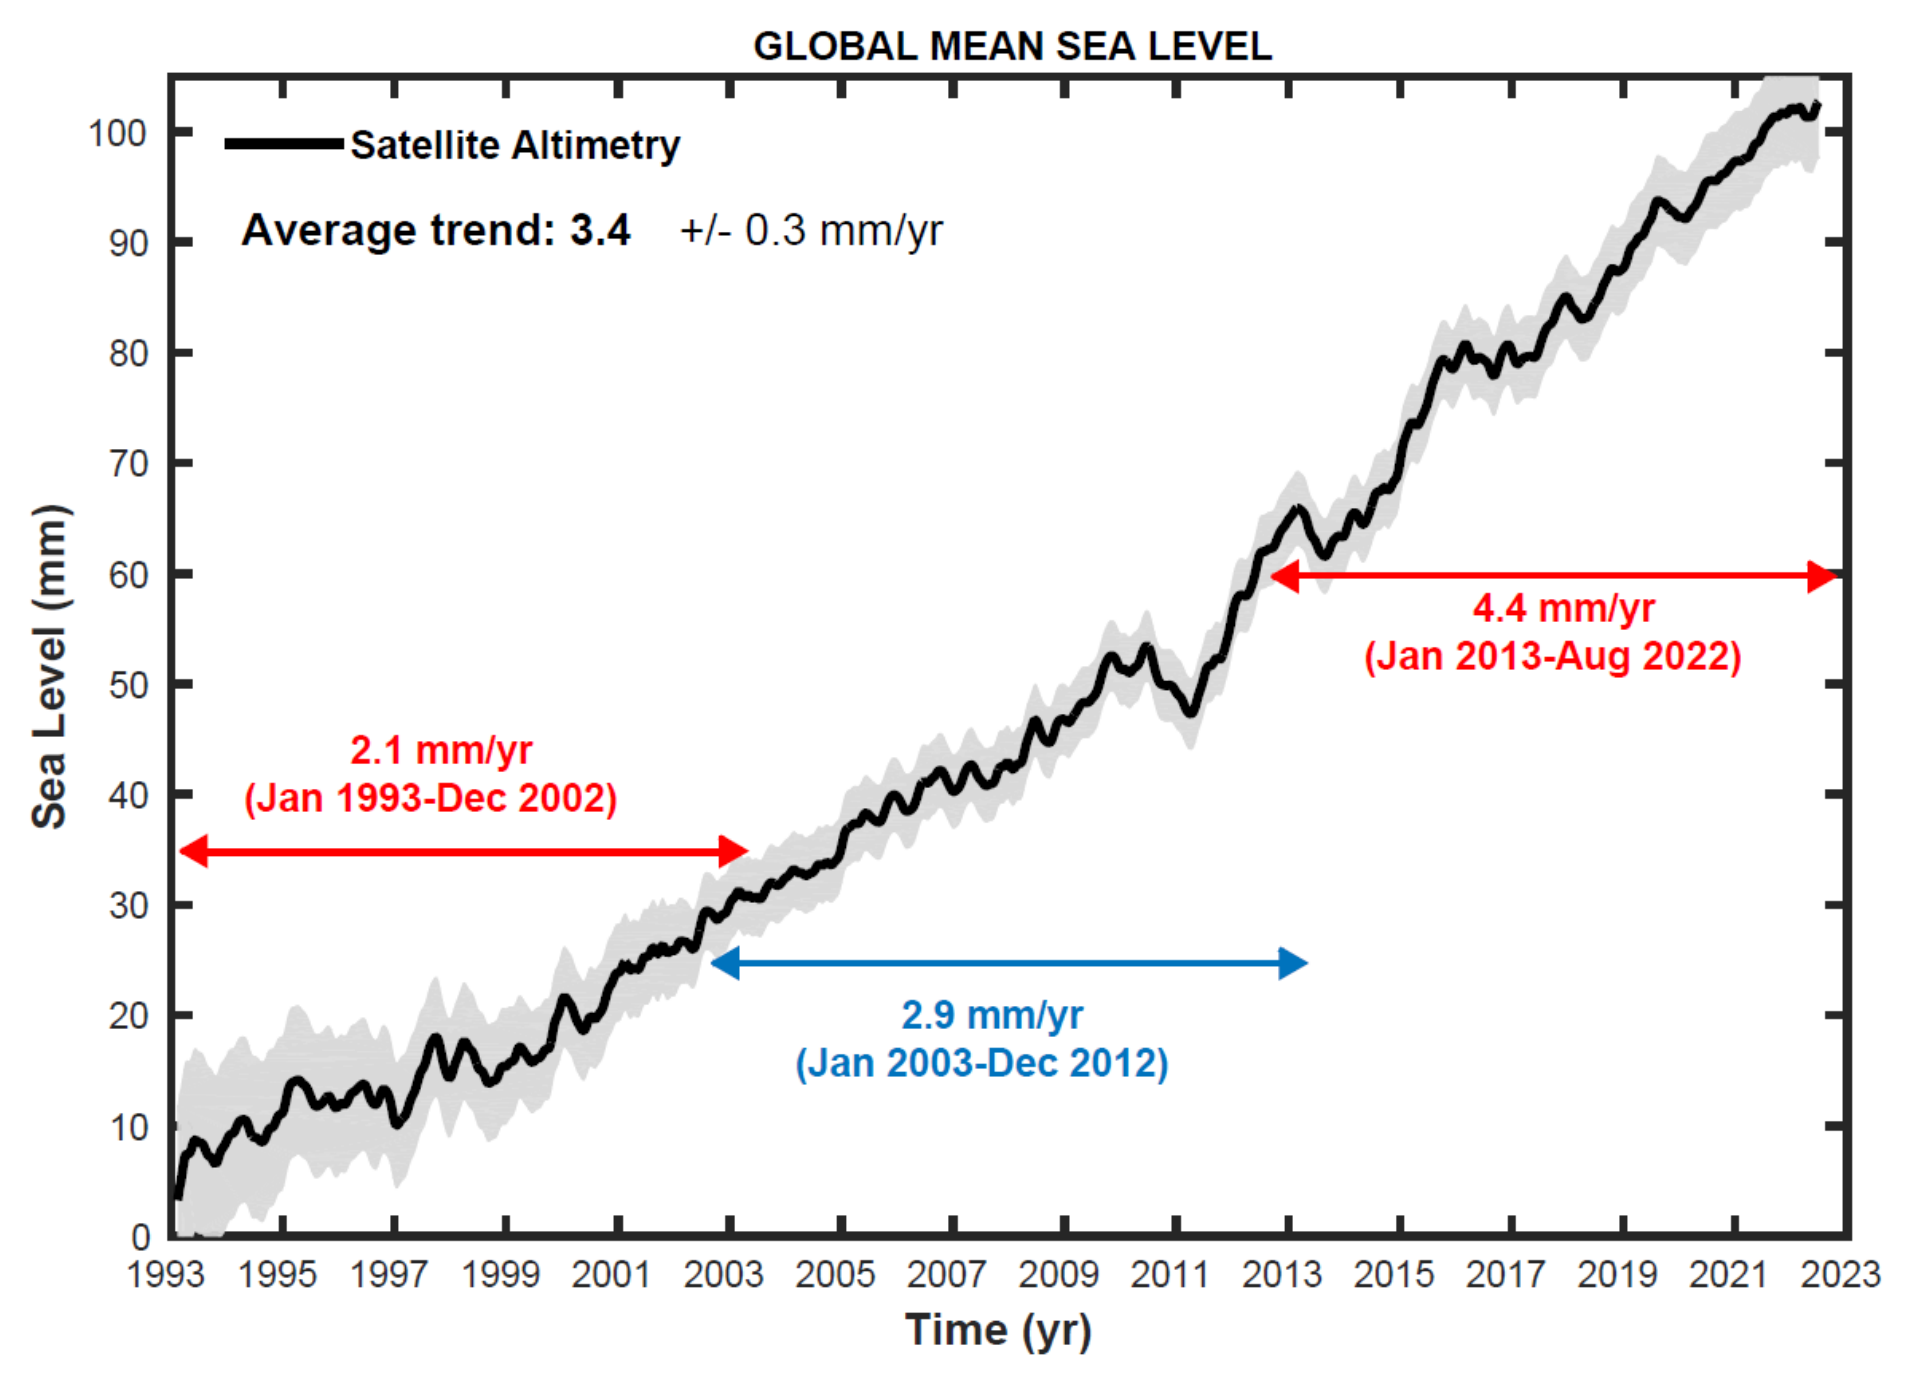
Global mean sea level has risen by an estimated 3.4 ± 0.3 mm per year over the 30 years (1993-2022) of the satellite altimeter record. The rate has doubled between 1993-2002 and 2013-2022 and sea level increased by about 5 mm between January 2021 and August 2022. The acceleration is due to increasing ice melt.

Ocean heat: The ocean stores around 90% of the accumulated heat from human emissions of greenhouse gases. The upper 2000m of the ocean continued to warm to record levels in 2021 (the latest year for which figures are available). Warming rates are especially high in the past two decades. It is expected that it will continue to warm in the future – a change which is irreversible on centennial to millennial time scales.

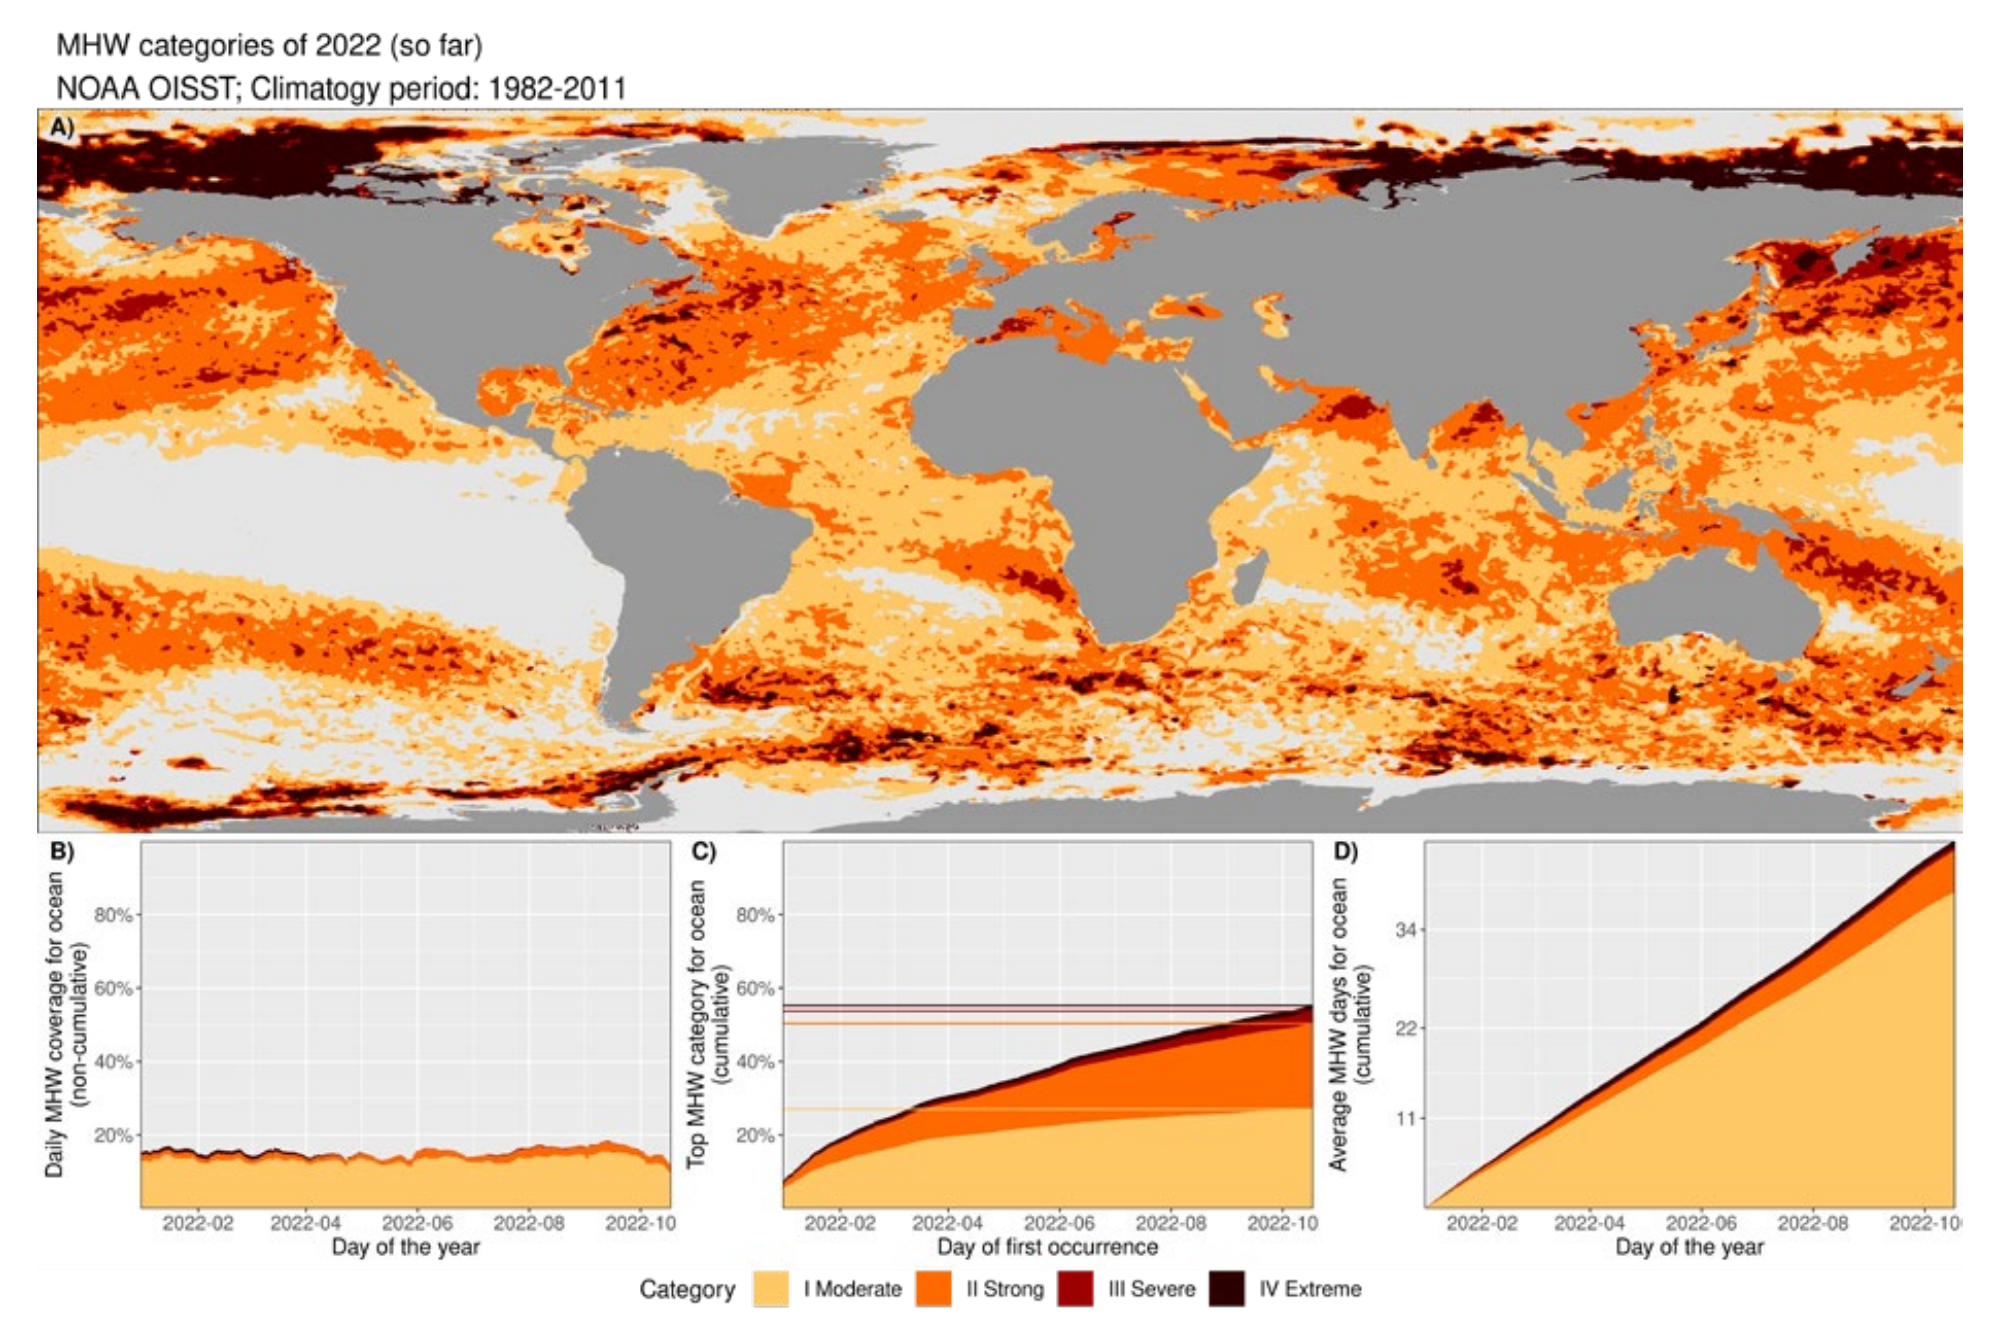
Overall, 55% of the ocean surface experienced at least one marine heatwave in 2022. In contrast only 22% of the ocean surface experienced a marine cold spell. Marine heatwaves are becoming more frequent, in contrast to cold waves.

Sea ice extent anomalies, 1979-2022, relative to the 1981-2010 average for (top) the Arctic and (bottom) the Antarctic. Blue/green lines indicate the anomalies in annual maximum ice extent (March for the Arctic and September for the Antarctic) and orange/red correspond to the annual minimum ice extent (September for the Arctic and February for the Antarctic). Arctic sea-ice extent was below the long-term (1981-2010) average for most of the year, with a Spring sea-ice maximum of 14.59 million km2 in March 2022, 0.84 million km2 below the long-term mean. The September extent was 4.87 million km2, 1.54 million km2 below the long-term mean extent. This represents greater ice extent than the average minimum values of the last decade – a moderate summer for Arctic sea-ice melt – but it is tied for the 11th lowest monthly minimum ice extent in the satellite record. The smallest daily extent of the year, 4.67 million km2, occurred around 18 September 2022 and was the 9th or 10th lowest annual-minimum daily extent on record. Data: EUMETSAT OSI SAF v2p1 and National Snow and Ice Data Centre (NSIDC) v3 / Fetterer et al., 2017. Graphic: WMO

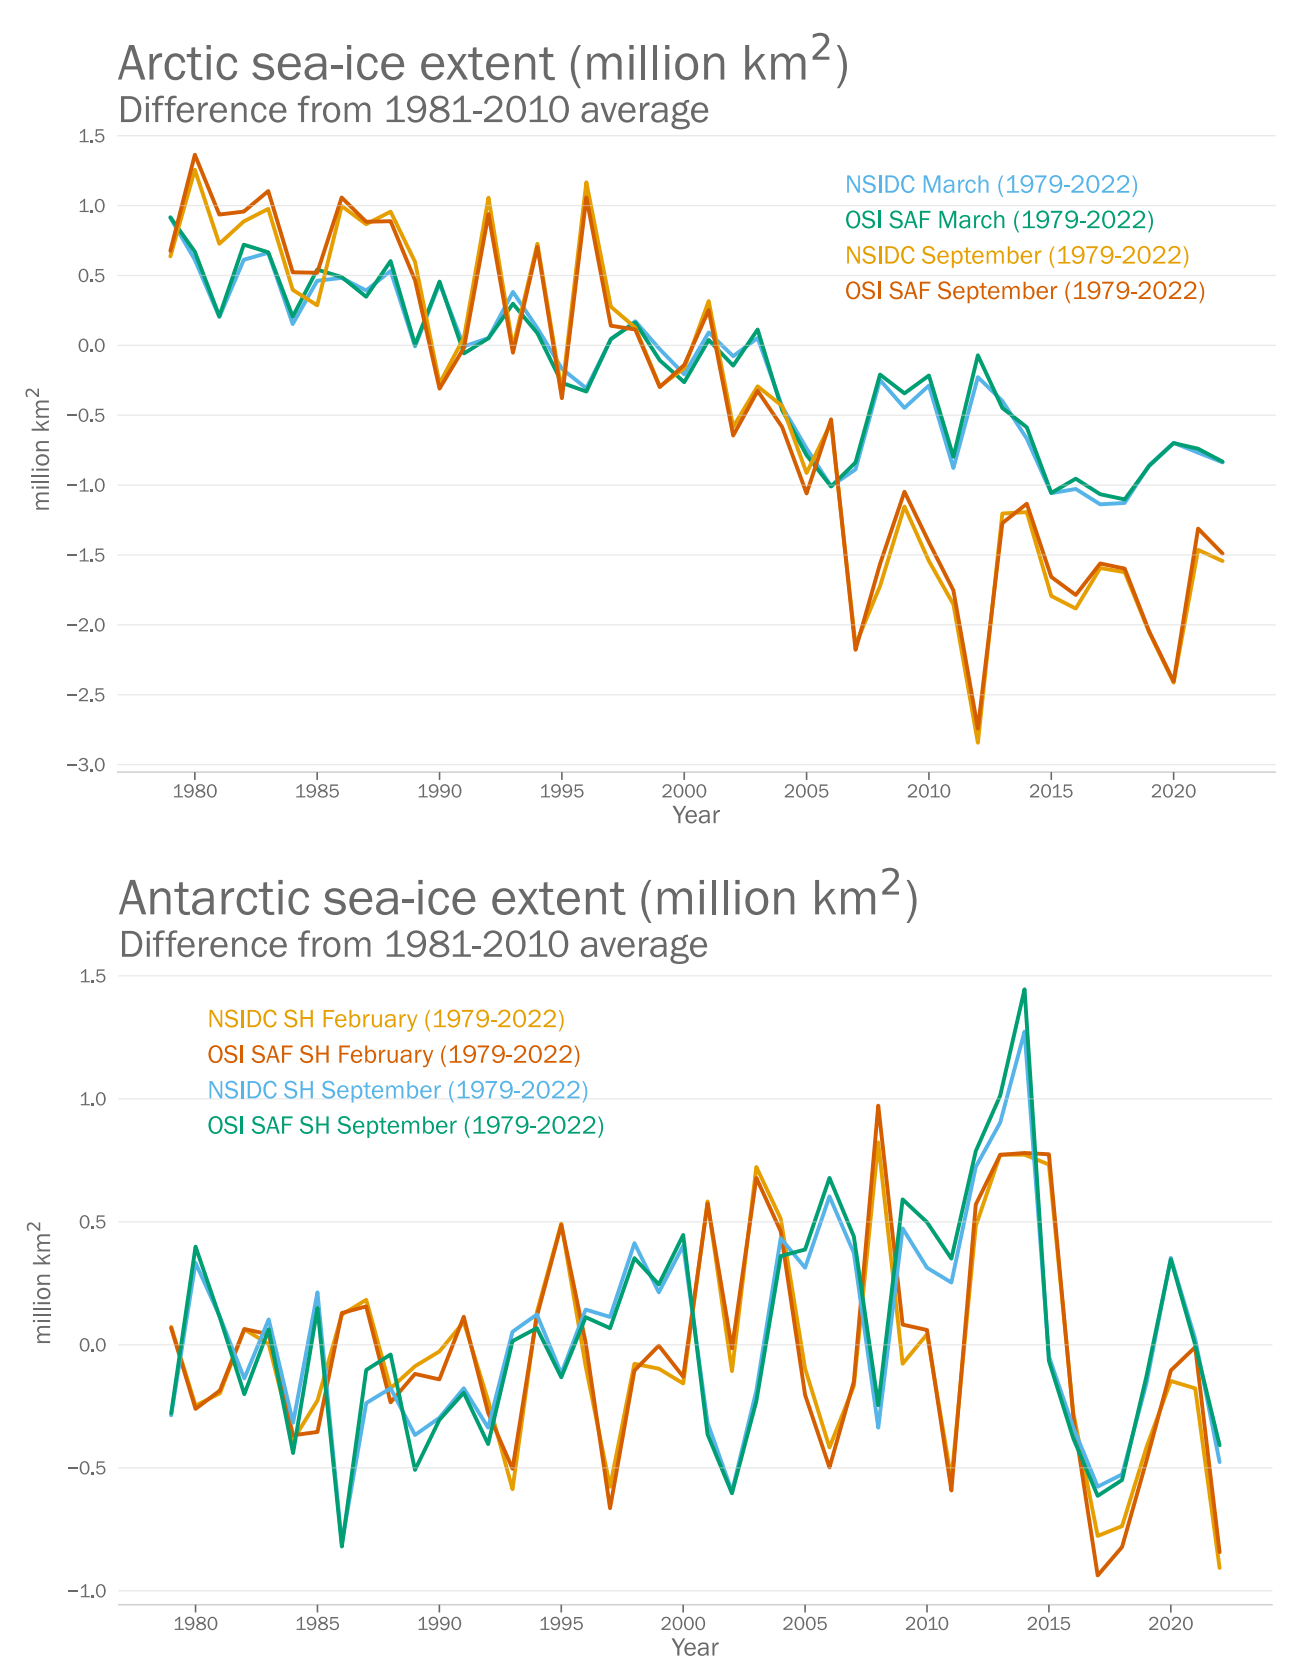
Arctic sea-ice extent was below the long-term (1981-2010) average for most of the year. The September extent was 4.87 million km2, or 1.54 million km2 below the long-term mean extent. Antarctic sea-ice extent dropped to 1.92 million km2 on 25 February, the lowest level on record and almost 1 million km2 below the long-term average.

Extreme weather: In East Africa, rainfall has been below average in four consecutive wet seasons, the longest in 40 years, with indications that the current season could also be dry. As a result of the persistent drought and other compounding factors, an estimated 18.4 to 19.3 million people faced food “Crisis” or worse levels of acute food insecurity before June 2022. Humanitarian agencies are warning that another below-average season will likely result in crop failure and further exacerbate the food insecurity situations in Kenya, Somalia, and Ethiopia.

Record breaking rain in July and August led to extensive flooding in Pakistan. There were at least 1 700 deaths and 33 million people affected. 7.9 million people were displaced. The flooding came hard on the heels of an extreme heatwave in March and April in both India and Pakistan.

Total precipitation in January 2022-September 2022, expressed as a percentile of the 1951-2000 reference period, for areas that would have been in the driest 20 percent (brown) and wettest 20 percent (green) of years during the reference period, with darker shades of brown and green indicating the driest and wettest 10 percent, respectively. Precipitation totals were above the long-term average in northeast Asia, the western Indian summer monsoon region, southeast Asia, the Maritime Continent, Australia, New Zealand, areas of northern South America, parts of North America and the Caribbean, west Africa, Sudan, coastal areas extending from western Libya to Egypt, and the southern Arabian Peninsula including UAE, Oman and Yemen. Regions with a marked rainfall deficit included: Europe, Central Asia, Northern Australia, Eastern Africa, most of North Africa, central and southern South America, and central and western North America. The Indian Monsoon onset was earlier and the withdrawal later than normal this year. The majority of the Indian Subcontinent received high precipitation totals and the monsoon extended farther westward then usual towards Pakistan where there was extensive flooding. Data: Global Precipitation Climatology Centre (GPCC), Deutscher Wetterdienst, Germany. Graphic: WMO

The southern Africa region was battered by a series of cyclones over two months at the start of the year, hitting Madagascar hardest with torrential rain and devastating floods. Hurricane Ian caused extensive damage and loss of life in Cuba and southwest Florida in September.

Large parts of the northern hemisphere were exceptionally hot and dry. China had the most extensive and long-lasting heatwave since national records began and the second-driest summer on record. The Yangtze River at Wuhan reached its lowest recorded level for August.

Large parts of Europe sweltered in repeated episodes of extreme heat. The United Kingdom saw a new national record on 19 July, when the temperature topped more than 40°C  for the first time. This was accompanied by a persistent and damaging drought and wildfires. European rivers including the Rhine, Loire and Danube fell to critically low levels. 

Contact

Eight warmest years on record witness upsurge in climate change impacts