Annual global mean surface temperature anomalies relative to 1850–1900. Global mean near-surface temperature in 2023 was 1.45 ± 0.12 °C above the 1850–1900 average. The analysis is based on a synthesis of six global temperature datasets. 2023 was the warmest year in the 174-year instrumental record in each of the six datasets. The past nine years – from 2015 to 2023 – were the nine warmest years on record. The two previous warmest years were 2016, with an anomaly of 1.29 ± 0.12 °C, and 2020, with an anomaly of 1.27 ± 0.13 °C. Globally, every month from June to December was record warm for the respective month. September 2023 was particularly noteworthy, surpassing the previous global record for September by a wide margin (0.46 °C–0.54 °C) in all datasets. The second-highest margin by which a September record was broken in the past 60 years (the period covered by all datasets) was substantially smaller, at 0.03 °C–0.17 °C in 1983. July is typically the warmest month of the year globally, and thus July 2023 became the warmest month on record. The long-term increase in global temperature is due to increased concentrations of greenhouse gases in the atmosphere. The shift from La Niña, which lasted from mid-2020 to early 2023, to fully developed El Niño conditions by September 2023 likely explains some of the rise in temperature from 2022 to 2023. However, some areas of unusual warming, such as the North-East Atlantic do not correspond to typical patterns of warming or cooling associated with El Niño. Other factors, which are still being investigated, may also have contributed to the exceptional warming from 2022 to 2023, which is unlikely to be due to internal variability alone. Graphic: WMO

19 March 2024 (WMO) – A new report from the World Meteorological Organization (WMO) shows that records were once again broken, and in some cases smashed, for greenhouse gas levels, surface temperatures, ocean heat and acidification, sea level rise, Antarctic sea ice cover and glacier retreat.

Heatwaves, floods, droughts, wildfires, and rapidly intensifying tropical cyclones caused misery and mayhem, upending every-day life for millions and inflicting many billions of dollars in economic losses, according to the WMO State of the Global Climate 2023 report.

The WMO report confirmed that 2023 was the warmest year on record, with the global average near-surface temperature at 1.45 °Celsius (with a margin of uncertainty of ± 0.12 °C) above the pre-industrial baseline. It was the warmest ten-year period on record.

The climate crisis is THE defining challenge that humanity faces and is closely intertwined with the inequality crisis – as witnessed by growing food insecurity and population displacement, and biodiversity loss.

Andrea Celeste Saulo, Secretary-General of the World Meteorological Organization

“Sirens are blaring across all major indicators… Some records aren’t just chart-topping, they’re chart-busting. And changes are speeding-up.” said United Nations Secretary-General António Guterres.

“Never have we been so close – albeit on a temporary basis at the moment – to the 1.5° C lower limit of the Paris Agreement on climate change.” said WMO Secretary-General Celeste Saulo. “The WMO community is sounding the Red Alert to the world.”

“Climate change is about much more than temperatures. What we witnessed in 2023, especially with the unprecedented ocean warmth, glacier retreat and Antarctic sea ice loss, is cause for particular concern,” she said.

On an average day in 2023, nearly one third of the global ocean was gripped by a marine heatwave, harming vital ecosystems and food systems. Towards the end of 2023, over 90% of the ocean had experienced heatwave conditions at some point during the year.

The global set of reference glaciers suffered the largest loss of ice on record (since 1950), driven by extreme melt in both western North America and Europe, according to preliminary data.

19 March 2024: The State of the Climate in 2023 gave ominous new significance to the phrase “off the charts.” A new report from the World Meteorological Organization (WMO) shows that records were once again broken, and in some cases smashed, for greenhouse gas levels, surface temperatures, ocean heat and acidification, sea level rise, Antarctic sea ice cover and glacier retreat. Video: World Meteorological Organization

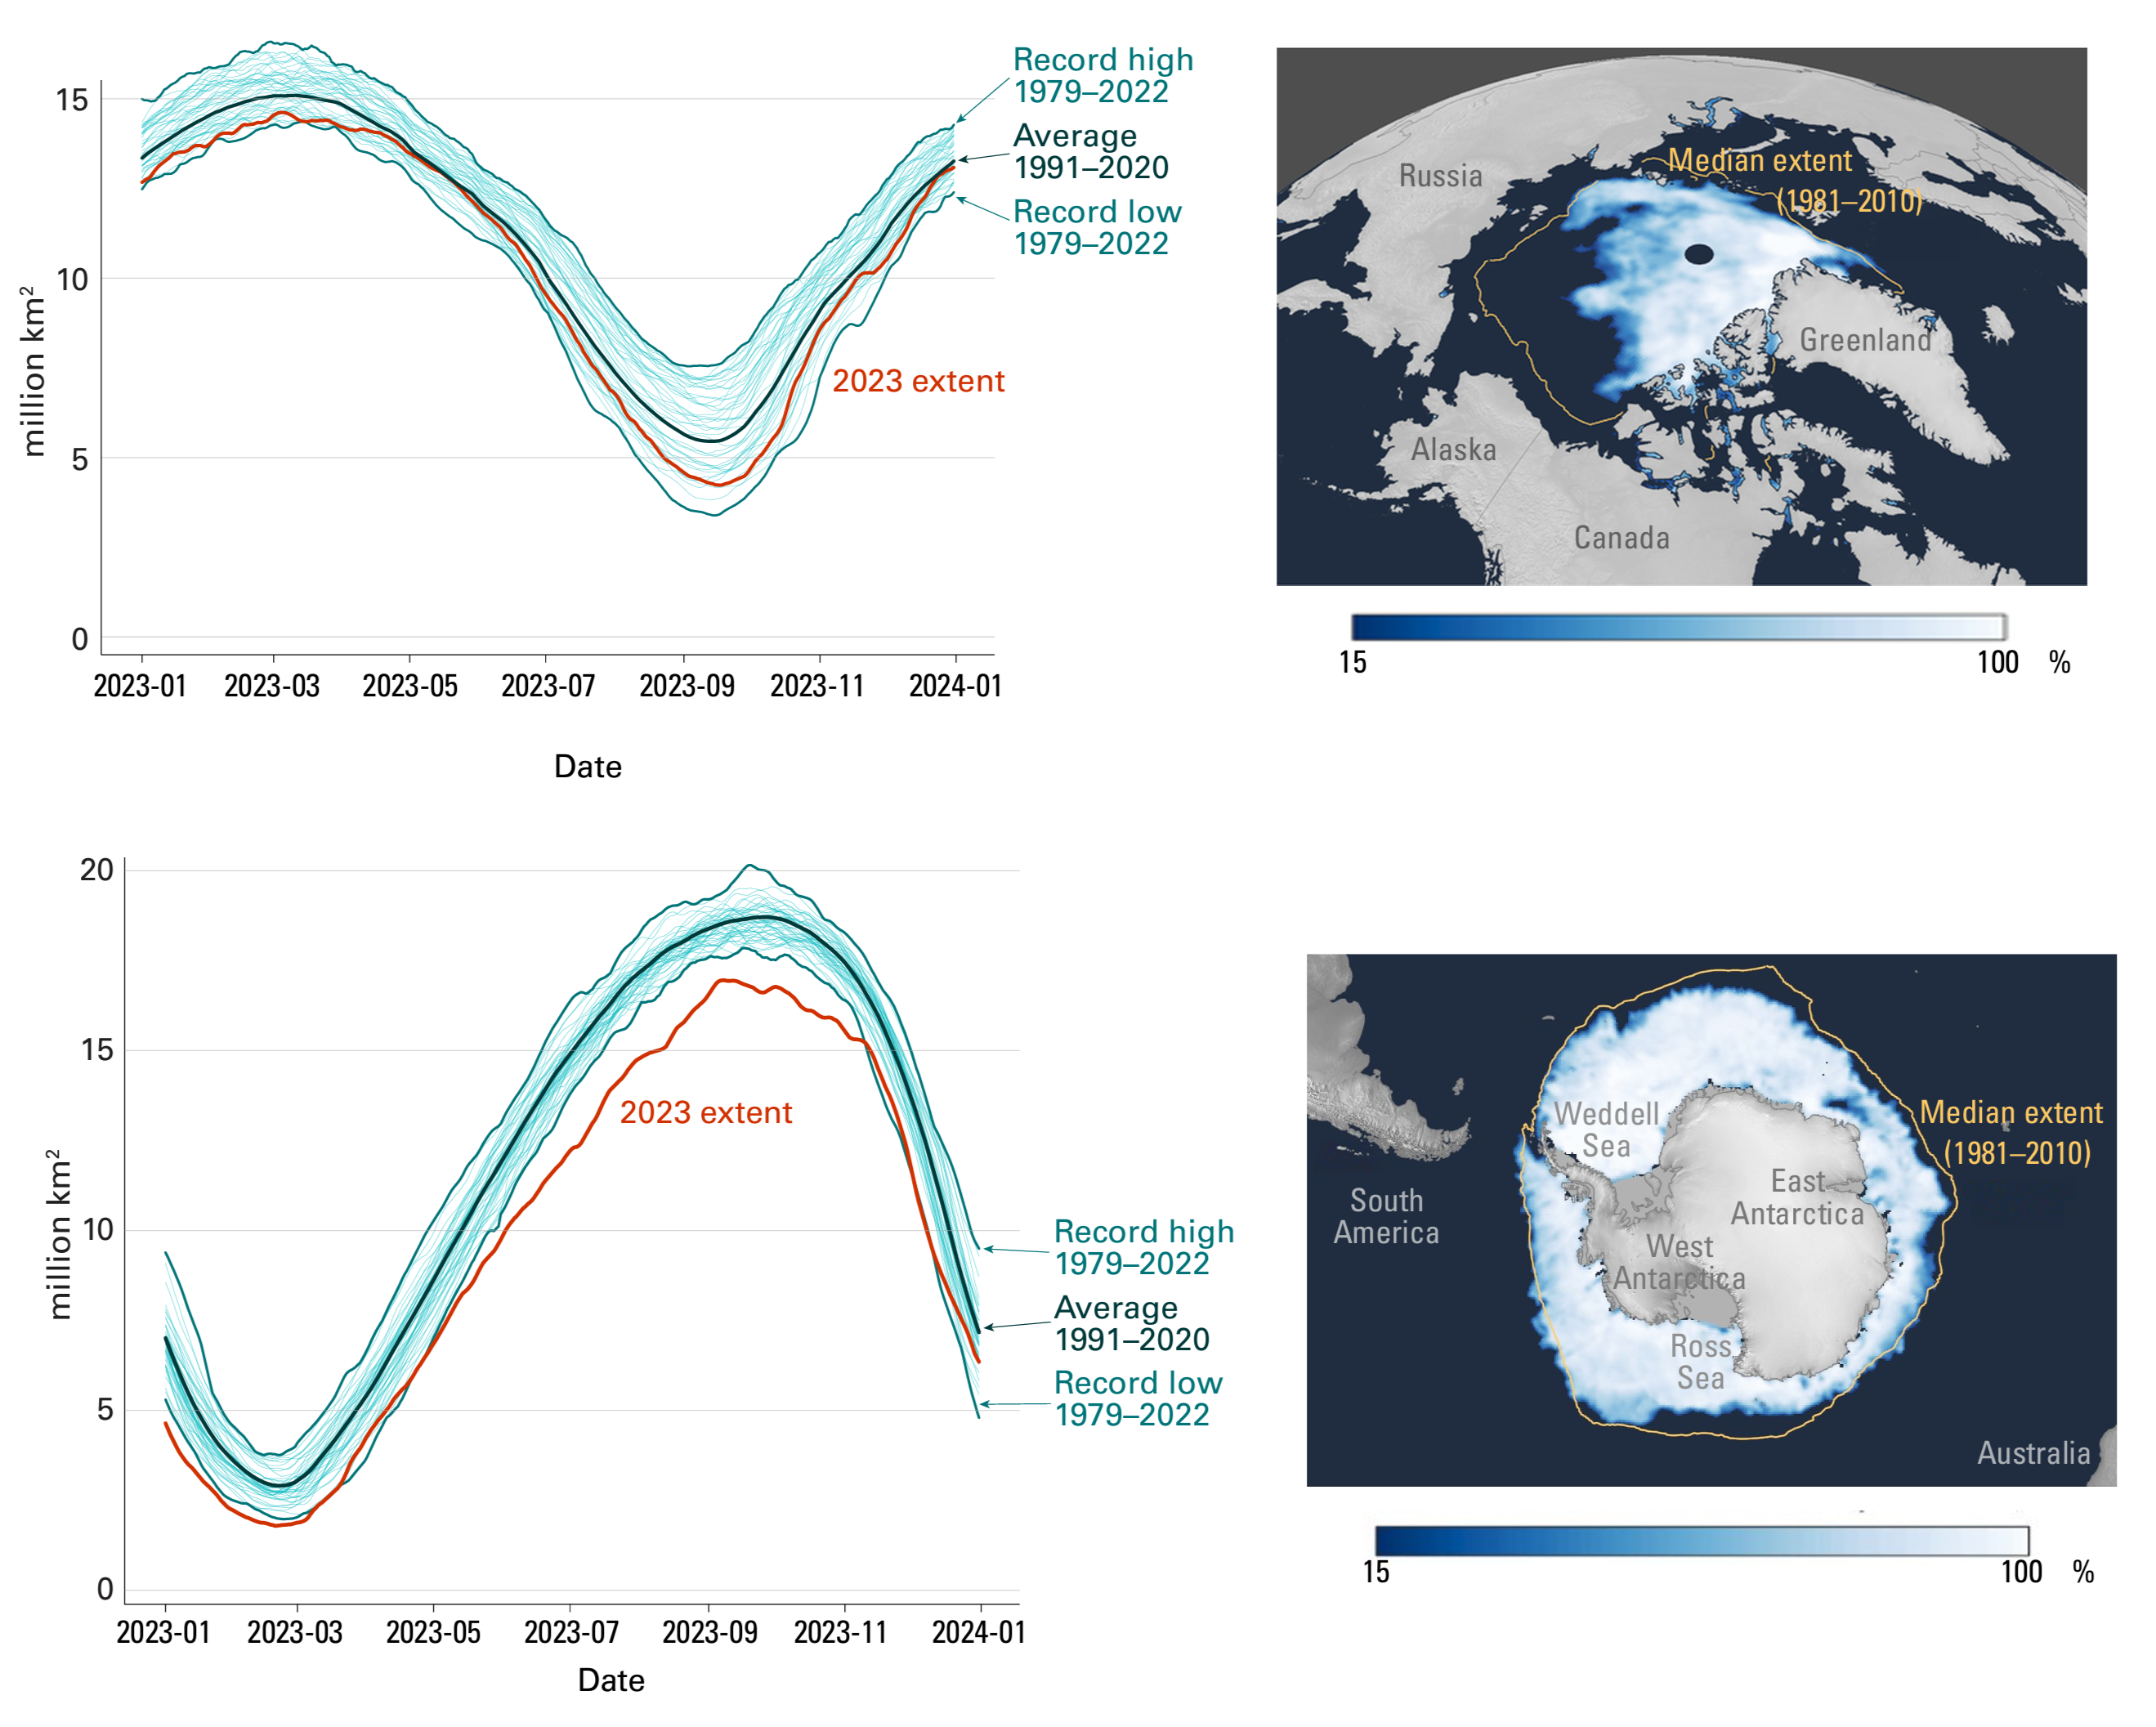
Antarctic sea ice extent was by far the lowest on record, with the maximum extent at the end of winter at 1 million km2 below the previous record year – equivalent to the size of France and Germany combined.

“The climate crisis is THE defining challenge that humanity faces and is closely intertwined with the inequality crisis – as witnessed by growing food insecurity and population displacement, and biodiversity loss” said Celeste Saulo.

The number of people who are acutely food insecure worldwide has more than doubled, from 149 million people before the COVID-19 pandemic to 333 million people in 2023 (in 78 monitored countries by the World Food Programme). Weather and climate extremes may not be the root cause, but they are aggravating factors, according to the report.

Weather hazards continued to trigger displacement in 2023, showing how climate shocks undermine resilience and create new protection risks among the most vulnerable populations. […]

Greenhouse gases

Observed concentrations of the three main greenhouse gases – carbon dioxide, methane, and nitrous oxide – reached record levels in 2022. Real-time data from specific locations show a continued increase in 2023.

CO2 levels are 50% higher than the pre-industrial era, trapping heat in the atmosphere. The long lifetime of CO2 means that temperatures will continue to rise for many years to come.
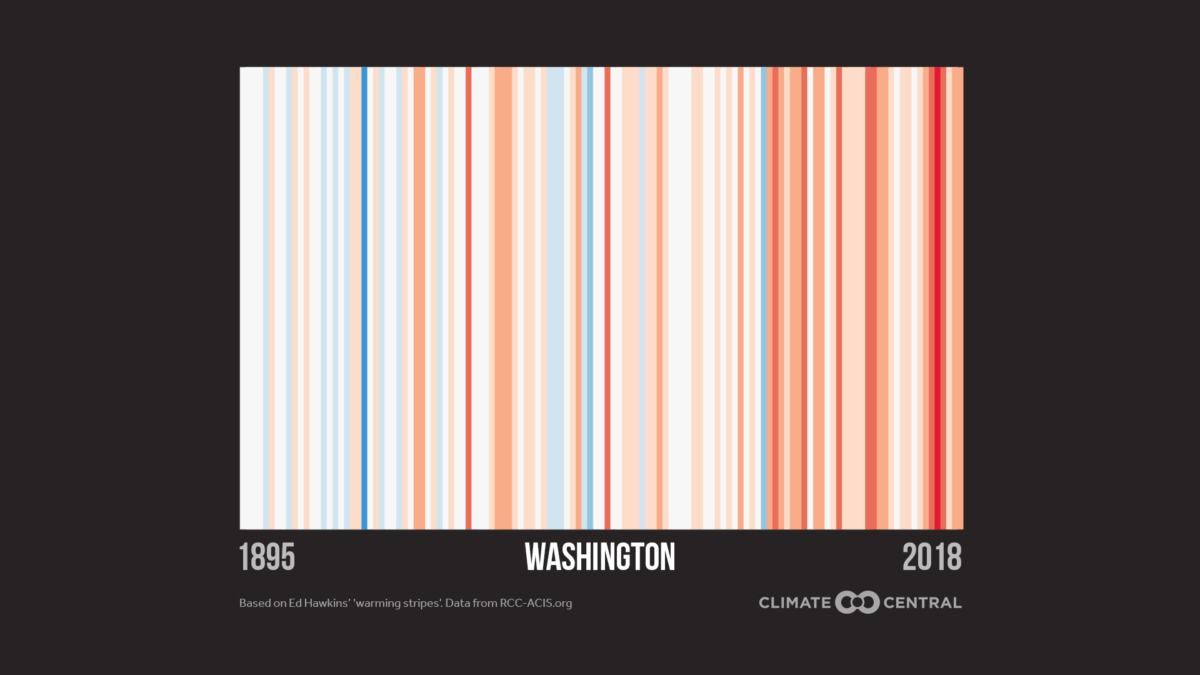
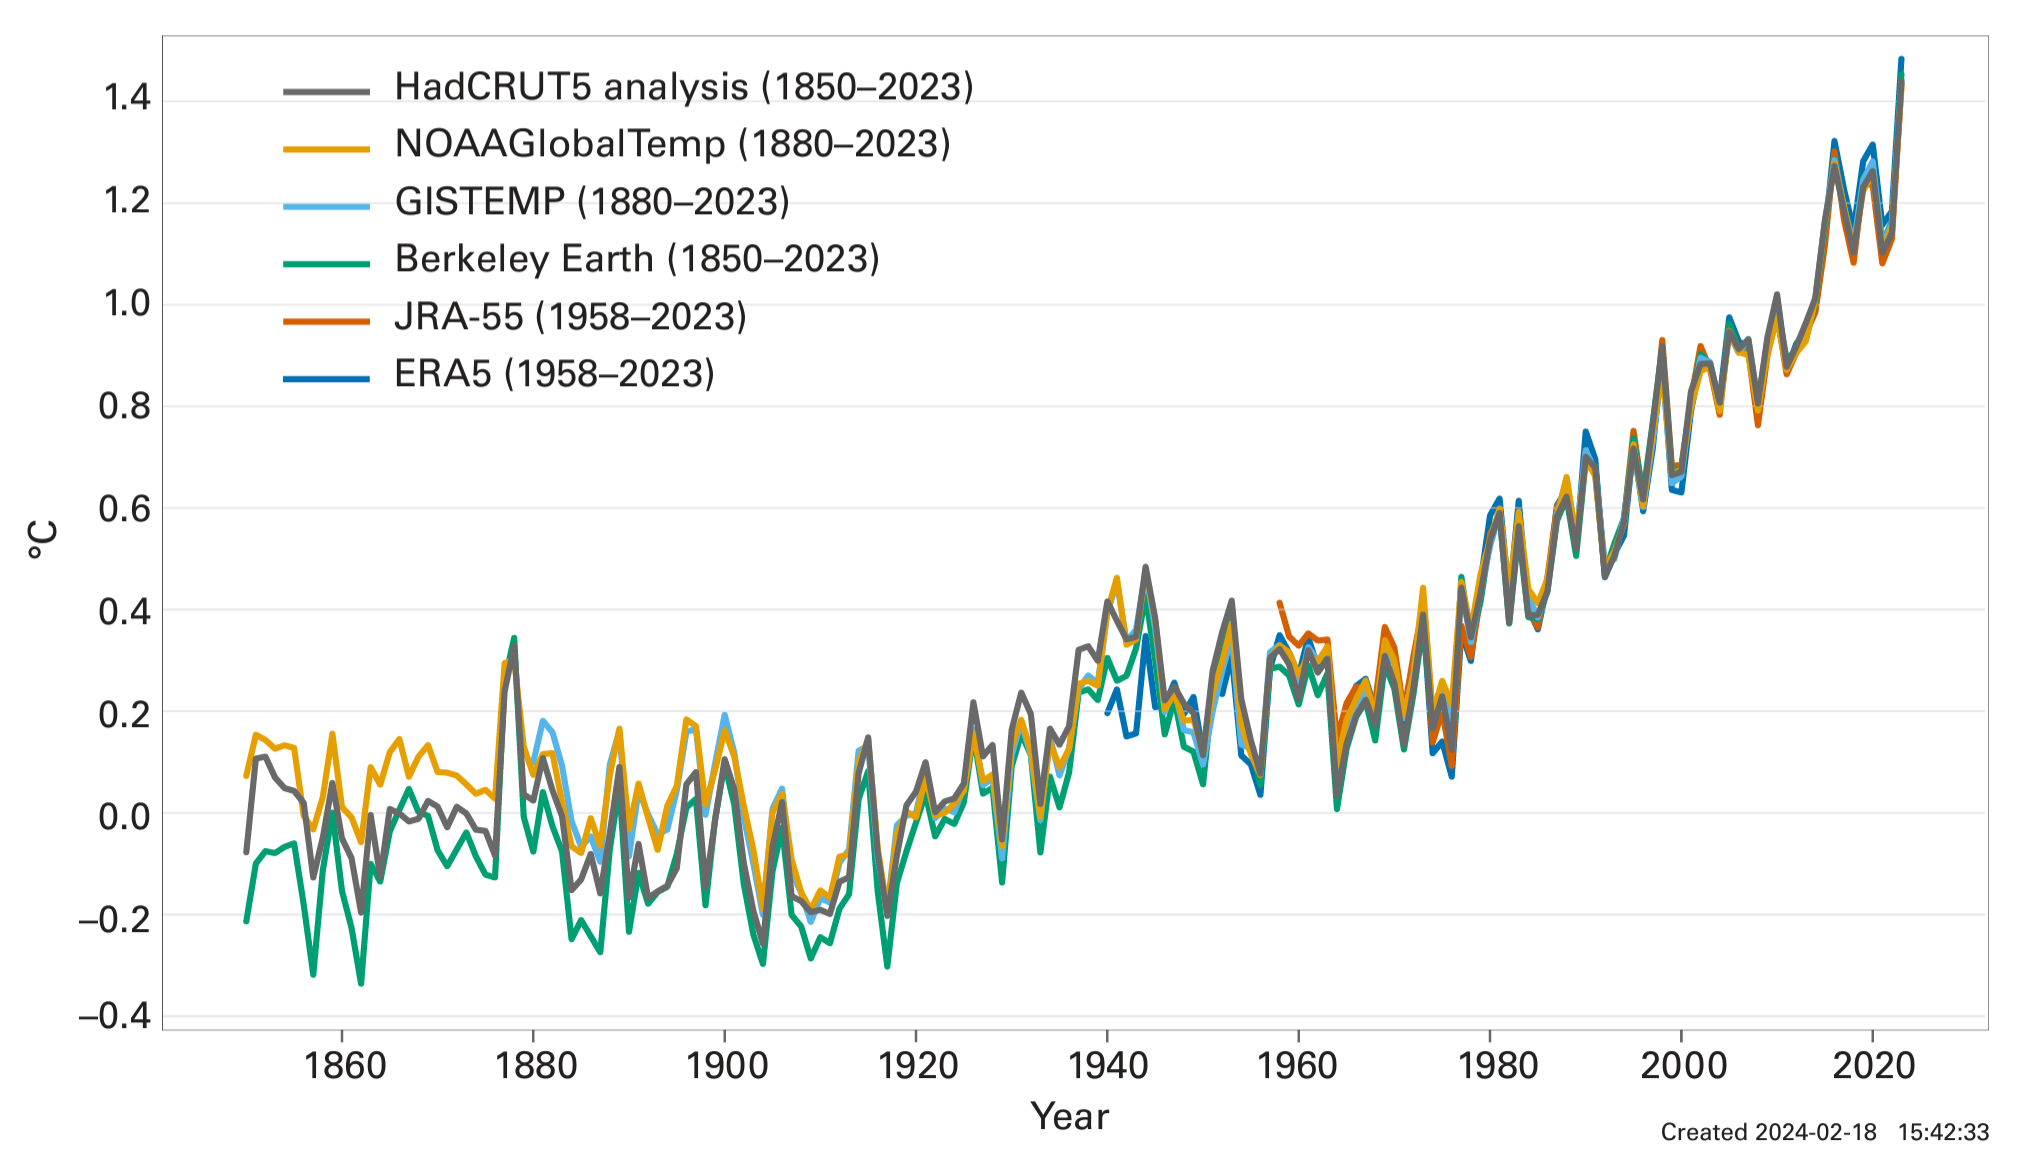
Temperature

The global mean near-surface temperature in 2023 was 1.45 ± 0.12 °C above the pre-industrial 1850–1900 average. 2023 was the warmest year in the 174-year observational record. This shattered the record of the previous warmest years, 2016 at 1.29 ± 0.12 °C above the 1850–1900 average and 2020 at 1.27±0.13 °C.

The ten-year average 2014–2023 global temperature is 1.20±0.12°C above the 1850–1900 average. 
Globally, every month from June to December was record warm for the respective month. September 2023 was particularly noteworthy, surpassing the previous global record for September by a wide margin (0.46 to 0.54 °C).

The long-term increase in global temperature is due to increased concentrations of greenhouse gases in the atmosphere. The shift from La Niña to El Niño conditions in the middle of 2023 contributed to the rapid rise in temperature from 2022 to 2023.

Global average sea-surface temperatures (SSTs) were at a record high from April onwards, with the records  in July, August and September broken by a particularly wide margin. Exceptional warmth was recorded in the eastern North Atlantic, the Gulf of Mexico and the Caribbean, the North Pacific and large areas of the Southern Ocean, with widespread marine heatwaves.

Some areas of unusual warming such as the Northeast Atlantic do not correspond to typical patterns of warming associated with El Niño, which was visibly present in the Tropical Pacific.
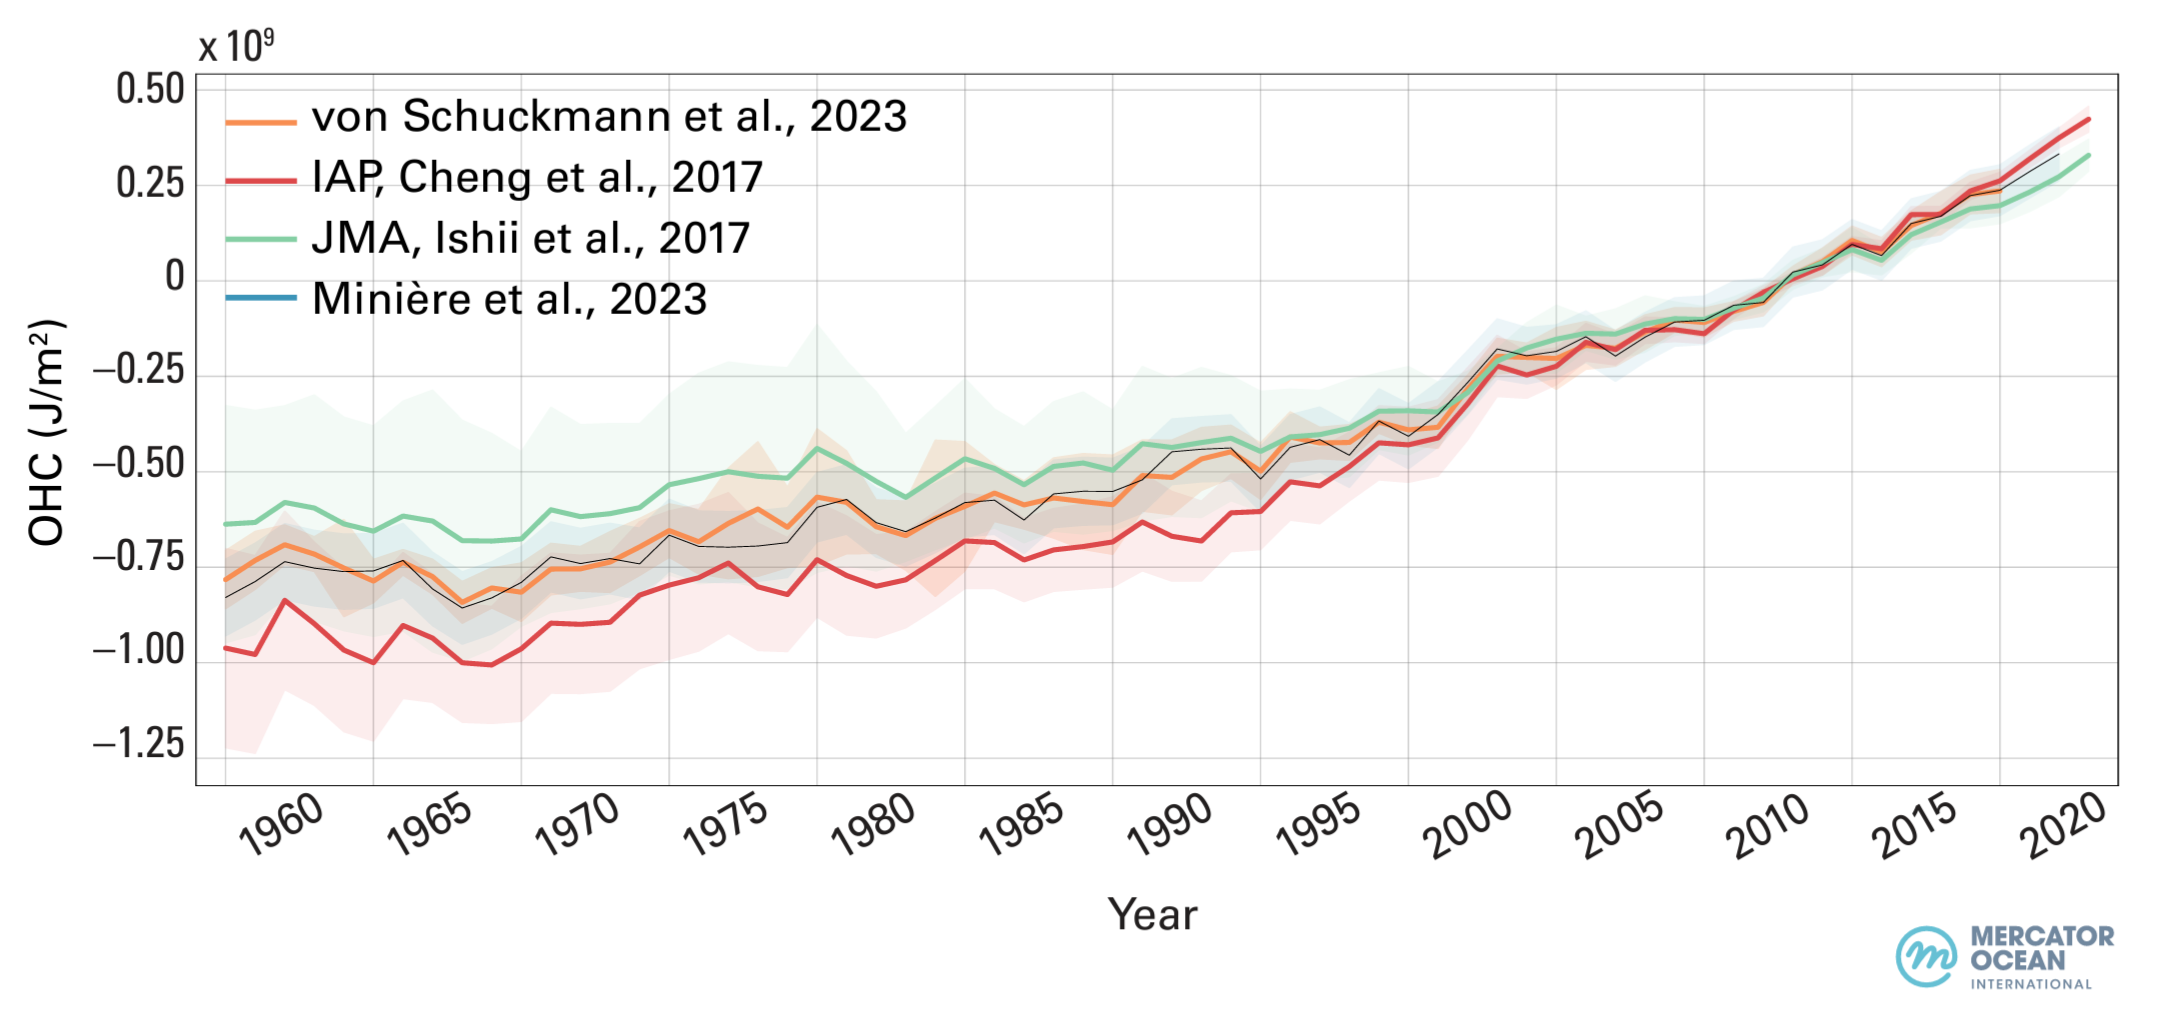
Global ocean heat content anomalies relative to the 2005–2021 average for the 0–2,000 m depth layer 1960–2023 (orange). Ensemble mean time series and ensemble standard deviation (2-standard deviations, shaded) updated from Schuckmann et al., 2023 (red); Cheng et al., 2017 (green); Minière et al., 2023 (light blue); and Ishii et al., 2017 (dark blue). According to a consolidated analysis based on several individual datasets, the upper 2,000 m of the ocean continued to warm in 2023. It is expected that warming will continue – a change that is irreversible on centennial to millennial timescales. Ocean heat content in 2023 was the highest on record, exceeding the 2022 value by 13 ± 9 ZJ consistent with estimates published in early 2024. All datasets agree that ocean warming rates show a particularly strong increase in the past two decades. The rate of ocean warming for the 0–2 000 m layer was 0.7 ± 0.1 W m-2 from 1971 to 2023 on average, but 1.0 ± 0.1 W m-2 from 2005 to 2023. Data: Mercator Ocean international. Graphic: WMO
Global ocean heat content anomalies relative to the 2005–2021 average for the 0–2,000 m depth layer 1960–2023 (orange). Ensemble mean time series and ensemble standard deviation (2-standard deviations, shaded) updated from Schuckmann, et al., 2023 (red); Cheng et al., 2017 (green); Minière, et al., 2023 (light blue); and Ishii, et al., 2017 (dark blue). According to a consolidated analysis based on several individual datasets, the upper 2,000 m of the ocean continued to warm in 2023. It is expected that warming will continue – a change that is irreversible on centennial to millennial timescales. Ocean heat content in 2023 was the highest on record, exceeding the 2022 value by 13 ± 9 ZJ consistent with estimates published in early 2024. All datasets agree that ocean warming rates show a particularly strong increase in the past two decades. The rate of ocean warming for the 0–2,000 m layer was 0.7 ± 0.1 W m-2 from 1971 to 2023 on average, but 1.0 ± 0.1 W m-2 from 2005 to 2023. Data: Mercator Ocean international. Graphic: WMO

Ocean heat

Ocean heat content reached its highest level in 2023, according to a consolidated analysis of data. Warming rates show a particularly strong increase in the past two decades.

It is expected that warming will continue – a change which is irreversible on scales of hundreds to thousands of years.

More frequent and intense marine heatwaves have profound negative repercussions for marine ecosystems and coral reefs.

The global ocean experienced an average daily marine heatwave coverage of 32%, well above the previous record of 23% in 2016. At the end of 2023, most of the global ocean between 20° S and 20° N had been in heatwave conditions since early November.

(a) Global map showing the highest marine heatwave category (for definitions, see Data set and methods) experienced at each pixel over 2023 (reference period 1982-2011). Light grey indicates that no marine heatwave occurred in a pixel over the entire year; (b) Stacked bar plot showing the percentage of the surface of the ocean experiencing a marine heatwave on any given day of the year; (c) Stacked bar plot showing the cumulative number of marine heatwave days averaged over the surface of the ocean, calculated by dividing the cumulative sum of marine heatwave days per pixel weighted by the surface area of those pixels; and (d) Stacked bar plot showing the total percentage of the surface of the ocean that experienced a marine heatwave from 1982 to present. Data are from the National Oceanic and Atmospheric Administration (NOAA) Optimum Interpolation Sea-Surface Temperature (OISST). Data: Robert Schlegel. Graphic: WMO

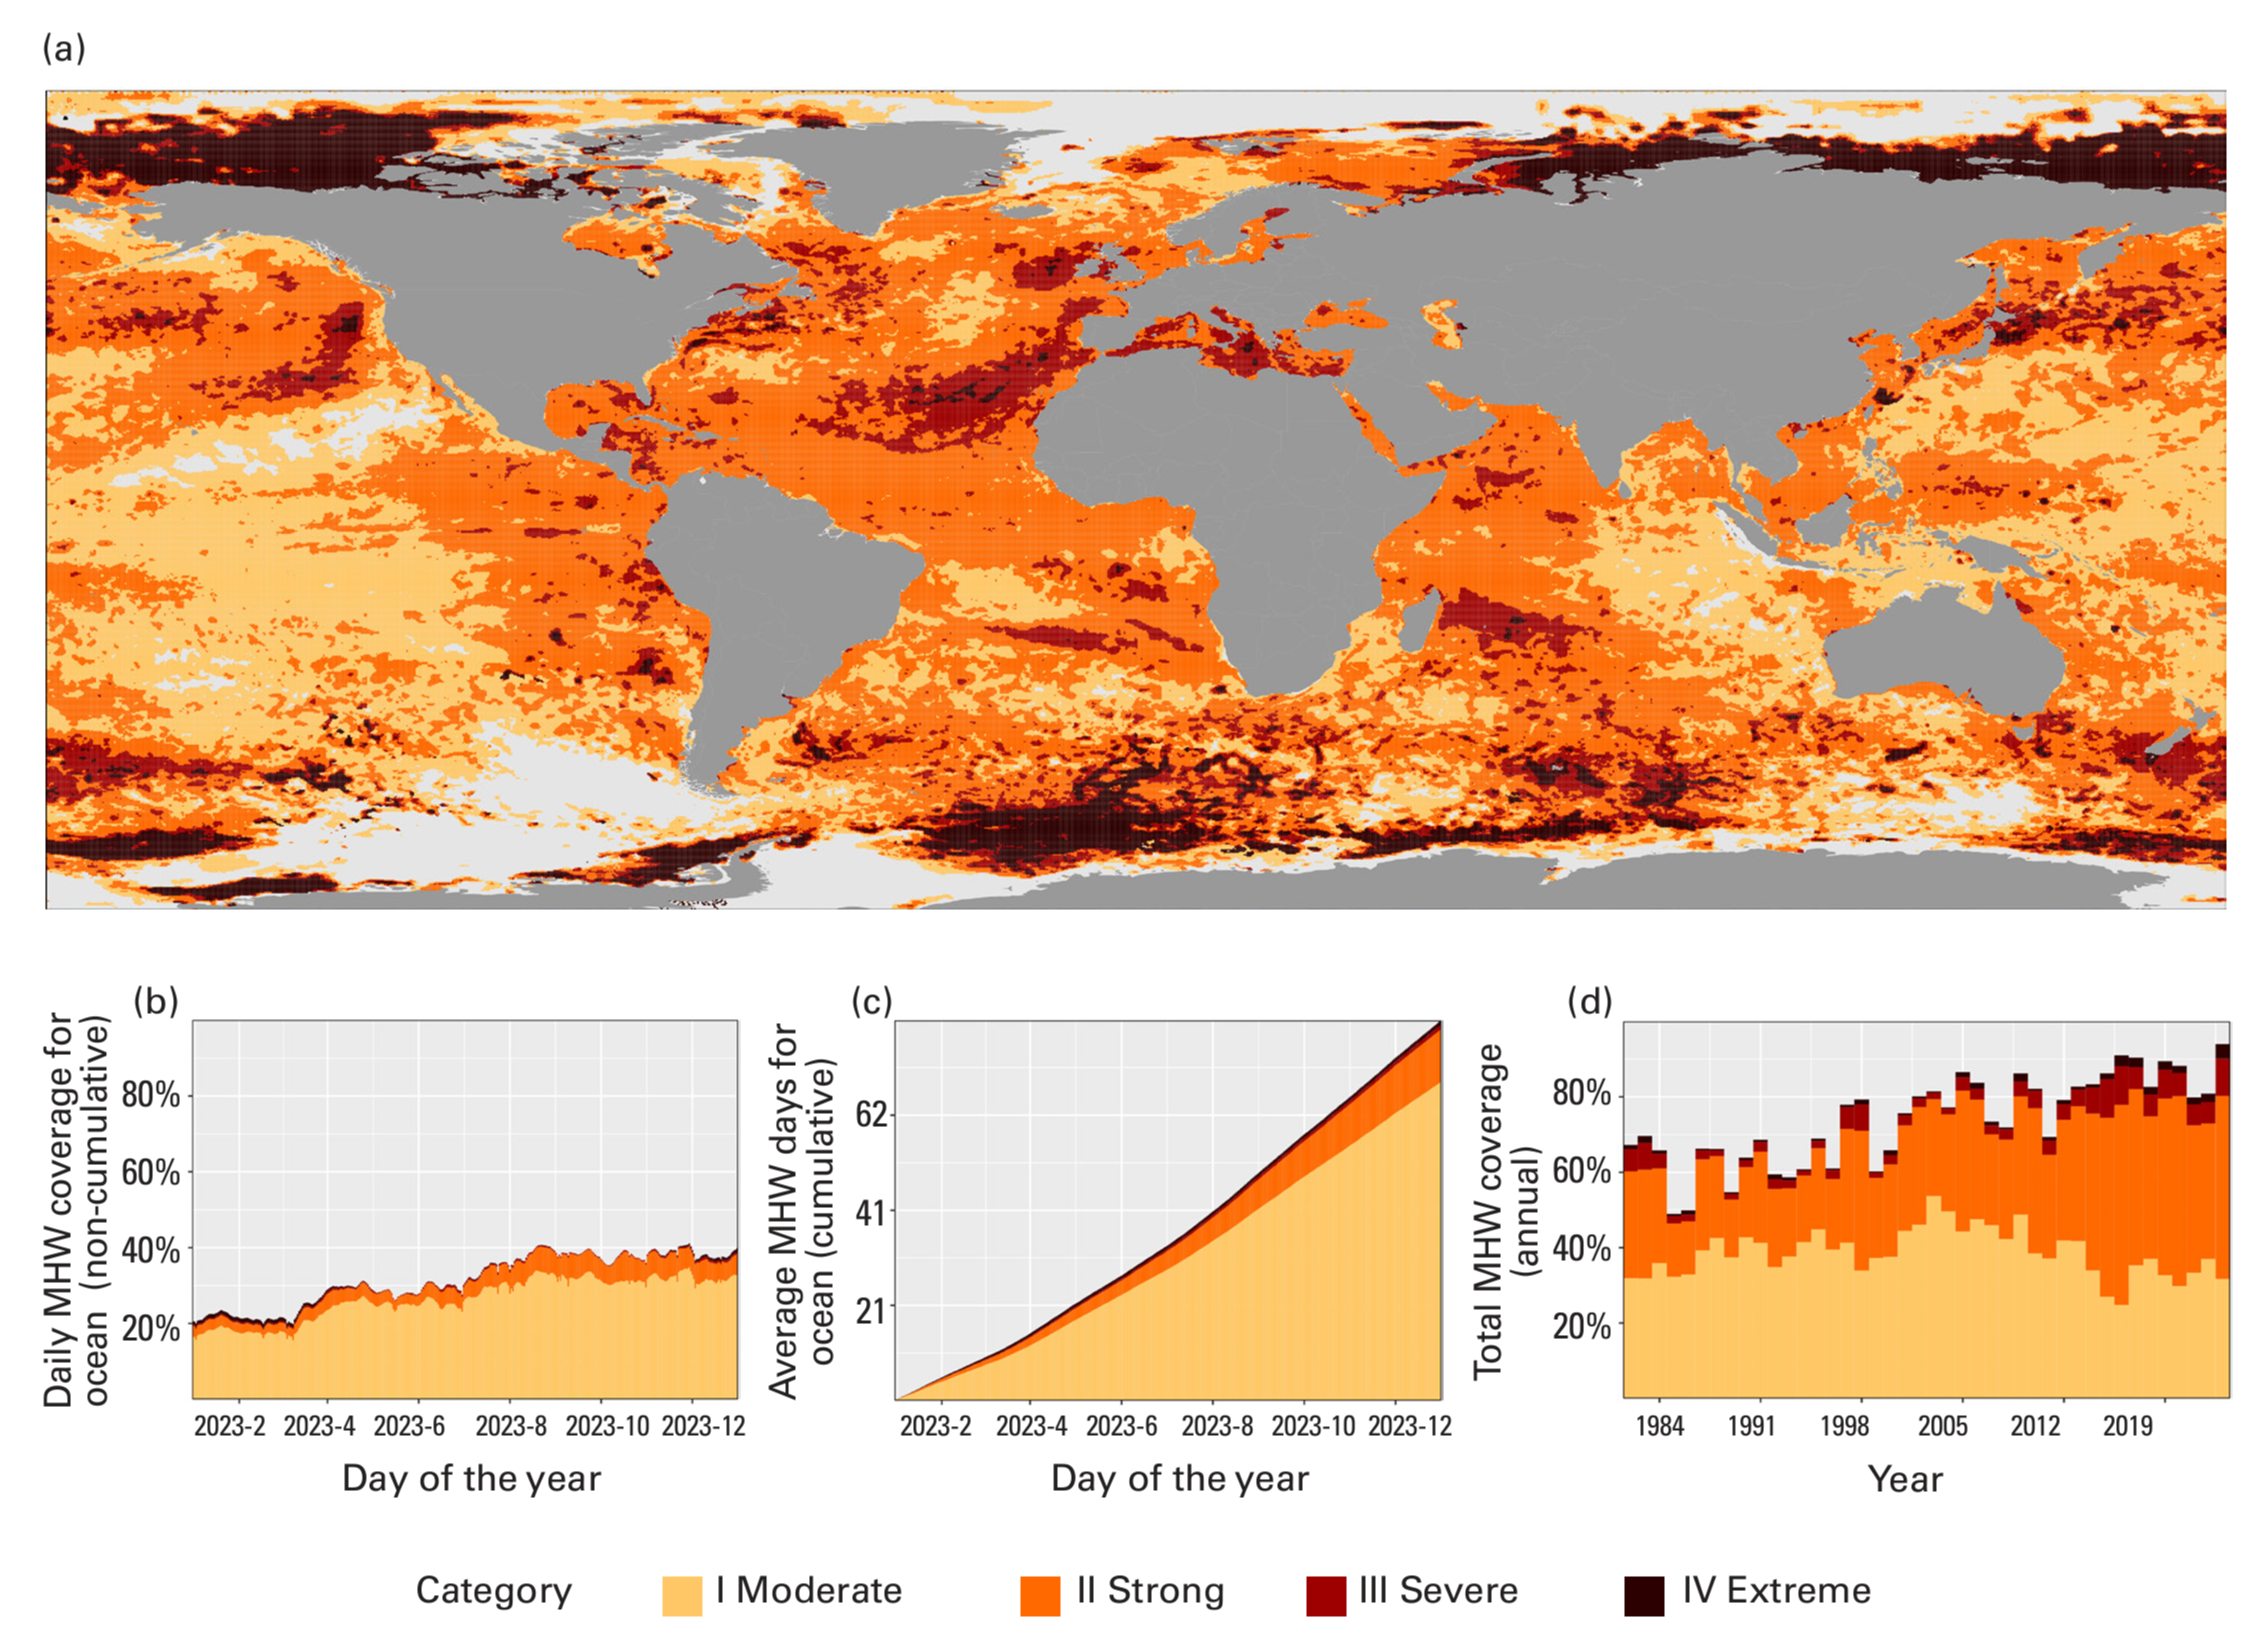
Of particular note were the widespread marine heatwaves in the North Atlantic which began in the Northern Hemisphere spring, peaked in extent in September and persisted through to the end of the year. The end of 2023 saw a broad band of severe and extreme marine heatwave across the North Atlantic, with temperatures 3 °C above average.

The Mediterranean Sea experienced near complete coverage of strong and severe marine heatwaves for the twelfth consecutive year.

Ocean acidification has increased as a result of absorbing carbon dioxide.

Global mean sea level (GMSL) evolution between January 1993 and December 2023 based on satellite altimetry. The black line is the best estimate, and the grey shaded area indicates uncertainty. Red and blue annotations indicate the average rate of sea-level rise during three decades of the record as indicated. In 2023, global mean sea level reached a record high in the satellite record (from 1993 to present), reflecting continued ocean warming as well as the melting of glaciers and ice sheets. The rate of global mean sea-level rise in the past 10 years (2014-2023) is more than twice the rate of sea-level rise in the first decade of the satellite record (1993-2002). Data: AVISO altimetry. Graphic: WMO

Sea level rise

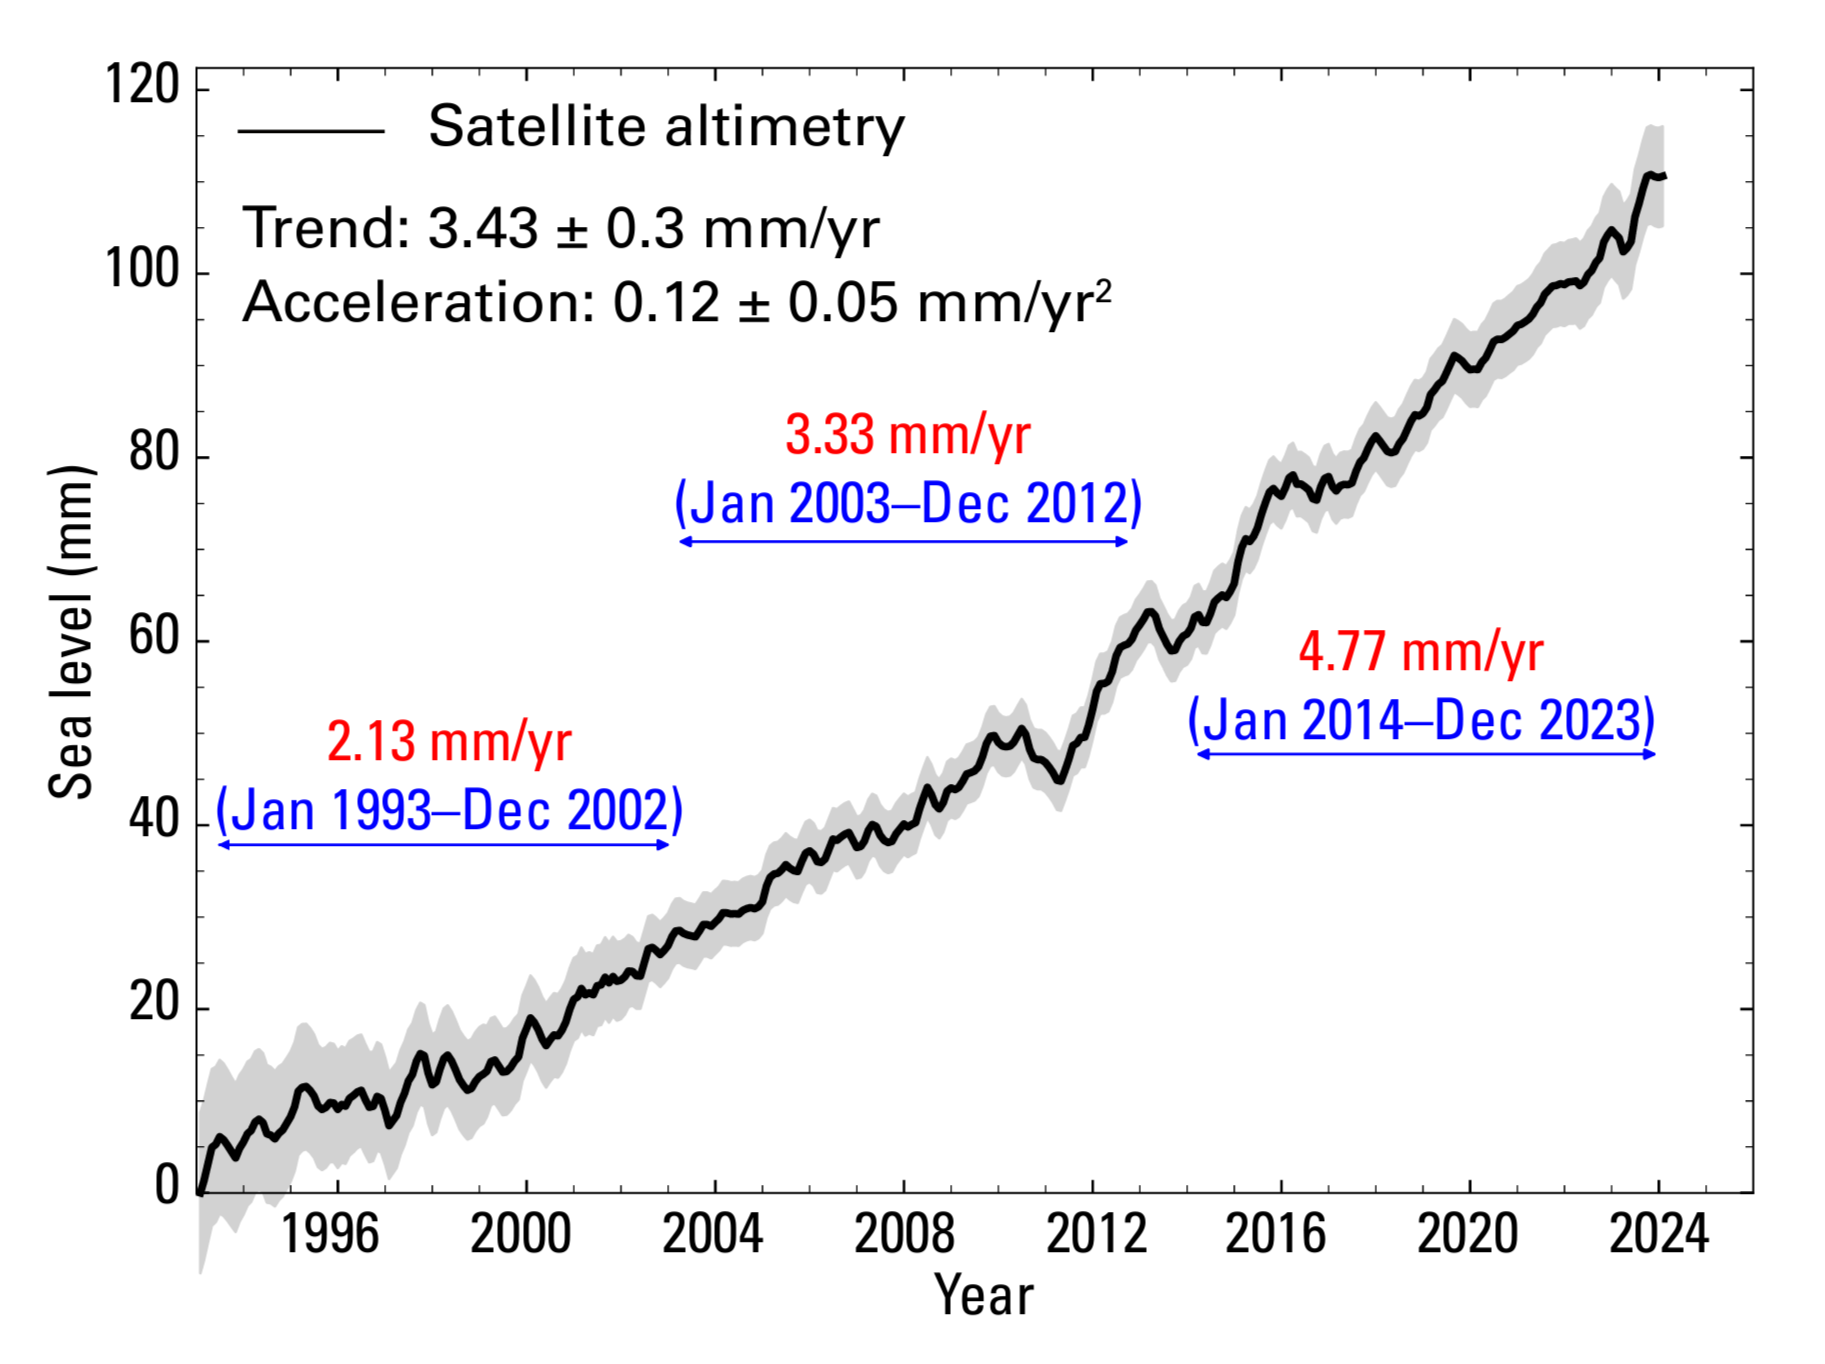
In 2023, global mean sea level reached a record high in the satellite record (since 1993), reflecting continued ocean warming (thermal expansion) as well as the melting of glaciers and ice sheets.

The rate of global mean sea level rise in the past ten years (2014–2023) is more than twice the rate of sea level rise in the first decade of the satellite record (1993–2002).

Antarctic sea-ice extent reached an absolute record low for the satellite era (since 1979) in February 2023 and remained at record low for the time of year from June till early November. The annual maximum in September was 16.96 million km2, roughly 1.5 million km2 below the 1991–2020 average and 1 million km2 below the previous record low maximum.

Arctic sea-ice extent remained well below normal, with the annual maximum and minimum sea ice extents being the fifth and sixth lowest on record respectively.

Daily Arctic (top) and Antarctic (bottom) sea-ice extent from January through December, showing 2023 (red line) against the climate normal (1991-2020, dark blue), and the record highest and lowest extents for each day (mid-blue). Individual years are shown in light blue. (right, top) Arctic sea-ice concentration on 19 September 2023, at the annual minimum Arctic sea-ice extent. (right, bottom) Antarctic sea-ice concentration on 10 September 2023, at the 2023 annual maximum extent. The yellow line indicates the median ice edge for the 1981-2010 period. Graphic: WMO

Ice sheets: There are two principal ice sheets, the Greenland Ice Sheet and the Antarctic ice Sheet. Combining the two ice sheets, the seven highest melt years on record are all since 2010, and average rates of mass loss increased from 105 Gigatonnes per year  from 1992–1996 to 372 Gigatonnes per year from 2016–2020. This is equivalent to about 1 mm per year of global sea level rise attributed to the ice sheets in the latter period.

The Greenland Ice Sheet continued to lose mass in the hydrological year 2022–2023 It was the warmest summer on record at Greenland’s Summit station, 1.0 °C warmer than the previous record. Satellite melt-extent data indicate that the ice sheet had the third highest cumulative melt-day area on record (1978–2023), after the extreme melt season of 2012 and 2010.

(left) Total annual loss of Swiss glaciers related to current ice volume. The vertical bars indicate the percentage change in ice volume relative to the previous year. Red and purple bars are the eight largest relative mass losses on record. The purple bars are the relative mass losses for 2022 and 2023. The blue shaded area in the background represents overall ice volume as also shown in the right-hand graph. (right) Overall ice volume for Swiss glaciers 1950-2023. Data: Matthias Huss, based on Glacier Monitoring Switzerland, 2022: Swiss Glacier Mass Balance (Release 2023), https:// doi.org/10.18750/massbalance.2022.r2022. Graphic: WMO
(left) Total annual loss of Swiss glaciers related to current ice volume. The vertical bars indicate the percentage change in ice volume relative to the previous year. Red and purple bars are the eight largest relative mass losses on record. The purple bars are the relative mass losses for 2022 and 2023. The blue shaded area in the background represents overall ice volume as also shown in the right-hand graph. (right) Overall ice volume for Swiss glaciers 1950-2023. Data: Matthias Huss, based on Glacier Monitoring Switzerland, 2022: Swiss Glacier Mass Balance (Release 2023). Graphic: WMO

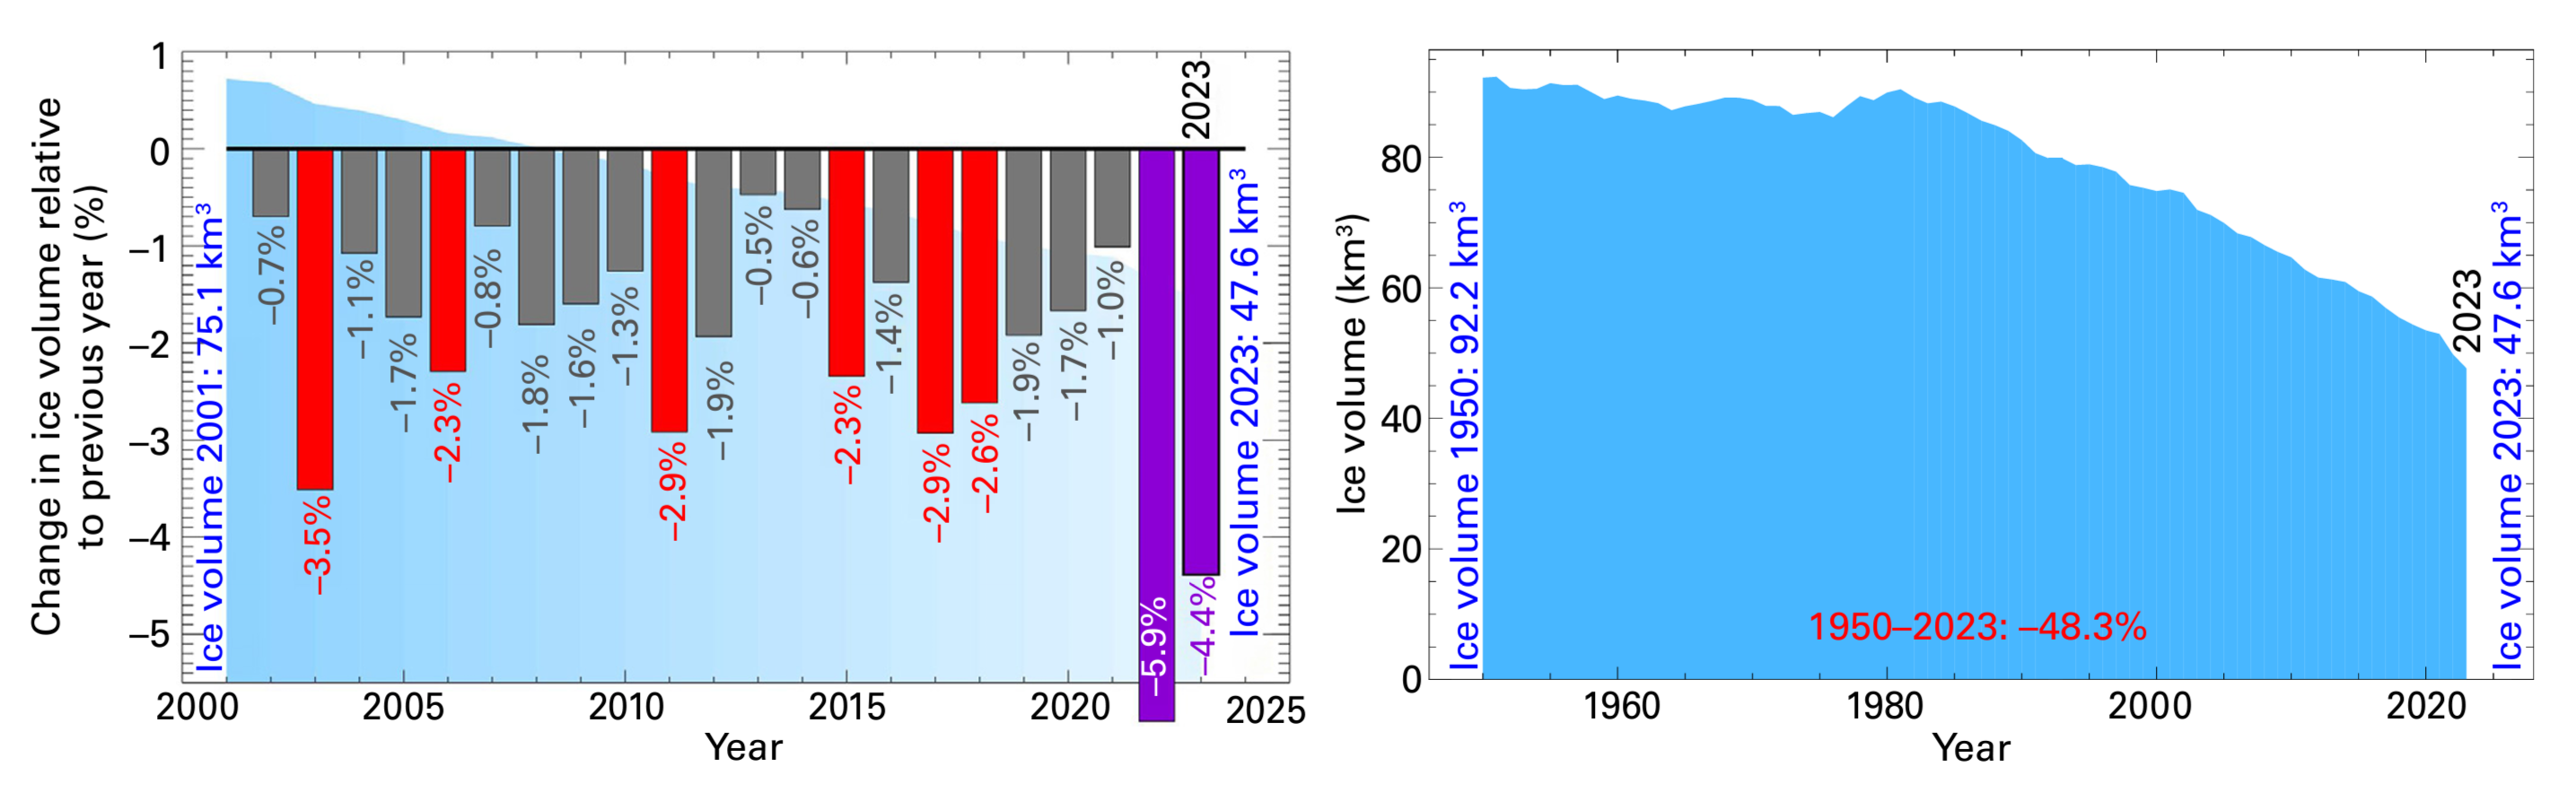
Glaciers: Preliminary data for the hydrological year 2022-2023 indicate that the global set of reference glaciers suffered the largest loss of ice on record (1950-2023), driven by extremely negative mass balance in both western North America and Europe.

Glaciers in the European Alps experienced an extreme melt season. In Switzerland, glaciers have lost around 10% of their remaining volume in the past two years. Western North America suffered record glacier mass loss in 2023 – at a rate which was five times higher than rates measured for the period 2000-2019. Glaciers in western North America have lost an estimated 9% of their 2020 volume over the period 2020-2023.

Extreme weather and climate events

Extreme weather and climate events had major socio-economic impacts on all inhabited continents. These included major floods, tropical cyclones, extreme heat and drought, and associated wildfires.

Flooding linked to extreme rainfall from Mediterranean Cyclone Daniel affected Greece, Bulgaria, Türkiye, and Libya with particularly heavy loss of life in Libya in September.

Tropical Cyclone Freddy in February and March was one of the world’s longest-lived tropical cyclones with major impacts on Madagascar, Mozambique, and Malawi.

Tropical Cyclone Mocha, in May, was one of the most intense cyclones ever observed in the Bay of Bengal and triggered 1.7 million displacements across the sub-region from Sri Lanka to Myanmar and through India and Bangladesh, and worsened acute food insecurity.

Hurricane Otis intensified to a maximum Category 5 system in a matter of hours – one of the most rapid intensification rates in the satellite era. It hit the Mexican coastal resort of Acapulco on 24 October, causing economic losses estimated at around US$15 billion, and killing at least 47 people.

Extreme heat affected many parts of the world. Some of the most significant were in southern Europe and North Africa, especially in the second half of July. Temperatures in Italy reached 48.2 °C, and record-high temperatures were reported in Tunis (Tunisia) 49.0 °C, Agadir (Morocco) 50.4 °C and Algiers (Algeria) 49.2 °C.

Annual area burned in Canada 1986-2023 (millions of hectares). The 2023 wildfire season in Canada was well beyond any previously recorded. Significant fire activity began in late April, expanded during a very warm, dry May, and continued throughout the summer and into early autumn. The total area burned nationally for the year was 14.9 million ha, more than seven times the long-term average (1986-2022) and far above the previous record seasonal total of 6.7 million ha in 1989. Altogether, 297 evacuation orders were issued for over 235 000 people. The fires also resulted in significant and widespread smoke pollution, particularly in the heavily populated areas of eastern Canada and the north-eastern United States of America in the first half of June. Four deaths were directly attributed to fires, although the broader health impacts of the smoke are yet to be fully assessed. Data: Jain et al., 2024. Graphic: WMO
Annual area burned in Canada 1986-2023 (millions of hectares). The 2023 wildfire season in Canada was well beyond any previously recorded. Significant fire activity began in late April, expanded during a very warm, dry May, and continued throughout the summer and into early autumn. The total area burned nationally for the year was 14.9 million ha, more than seven times the long-term average (1986-2022) and far above the previous record seasonal total of 6.7 million ha in 1989. Altogether, 297 evacuation orders were issued for over 235 000 people. The fires also resulted in significant and widespread smoke pollution, particularly in the heavily populated areas of eastern Canada and the north-eastern United States of America in the first half of June. Four deaths were directly attributed to fires, although the broader health impacts of the smoke are yet to be fully assessed. Data: Jain, et al., 2024. Graphic: WMO

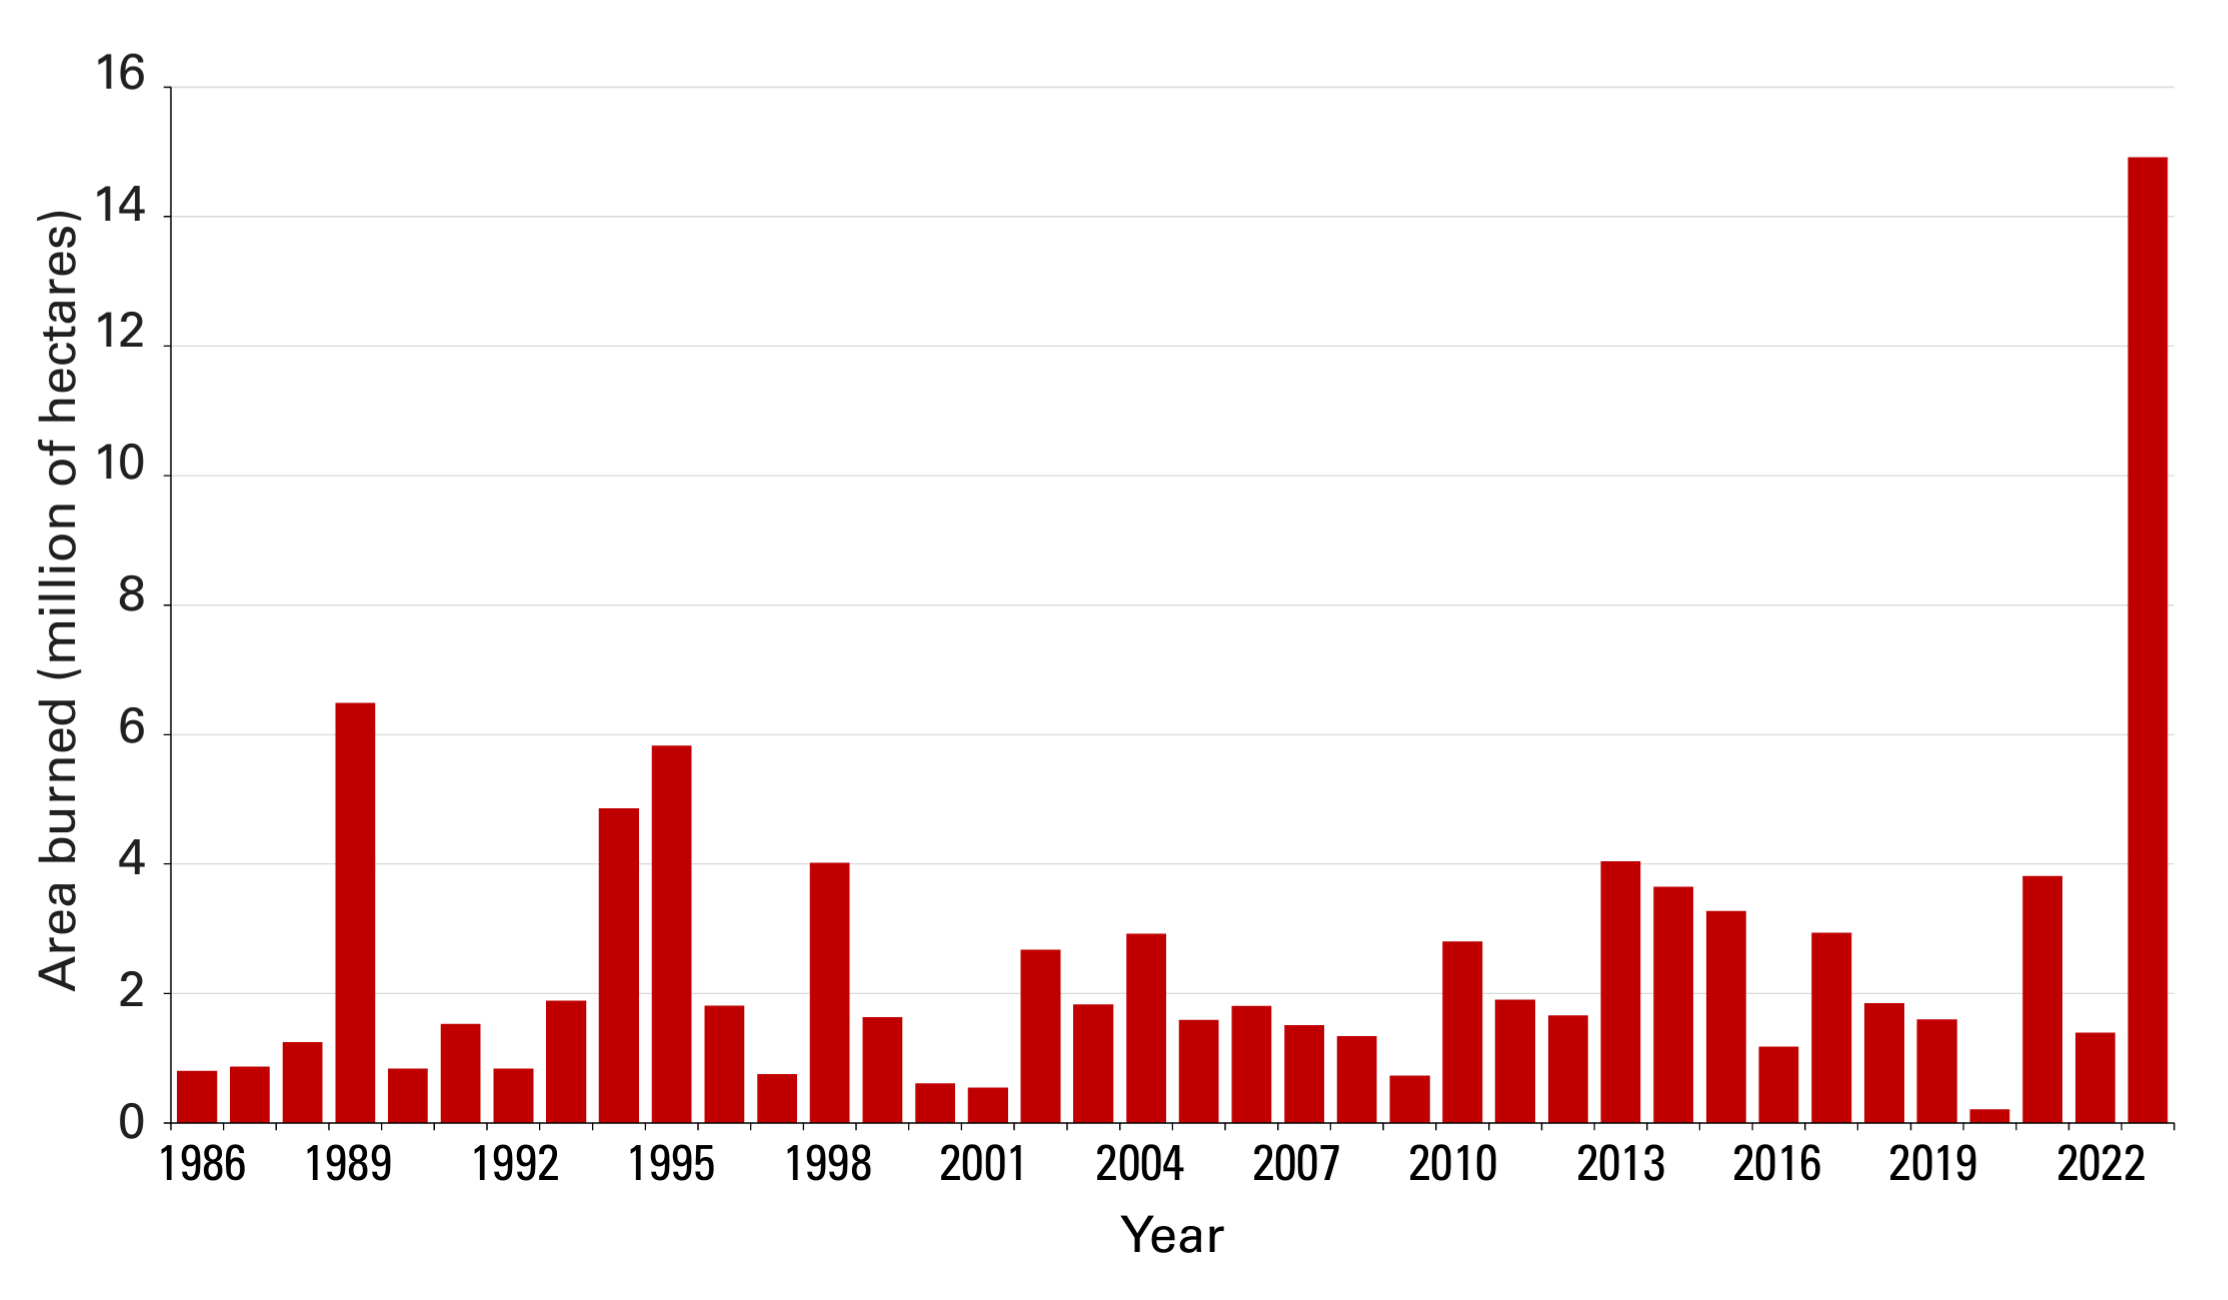
Canada’s wildfire season was the worst on record. The total area burned nationally for the year was 14.9 million hectares, more than seven times the long-term average. The fires also led to severe smoke pollution, particularly in the heavily populated areas of eastern Canada and the north-eastern United States. The deadliest single wildfire of the year was in Hawaii, with at least 100 deaths reported – the deadliest wildfire in the USA for more than 100 years – and estimated economic losses of US$5.6 billion.

The Greater Horn of Africa region, which had been experiencing long-term drought, suffered substantial flooding in 2023, particularly later in the year. The flooding displaced 1.8 million people across Ethiopia, Burundi, South Sudan, Tanzania, Uganda, Somalia, and Kenya in addition to the 3 million people displaced internally or across borders by the five consecutive seasons of drought in Ethiopia, Kenya, Djibouti, and Somalia.

Long-term drought persisted in north-western Africa and parts of the Iberian Peninsula, as well as parts of central and southwest Asia. It intensified in many parts of Central America and South America. In northern Argentina and Uruguay, rainfall from January to August was 20 to 50% below average, leading to crop losses and low water storage levels. [more]

Climate change indicators reached record levels in 2023: WMO