Scientists update status of polar bear populations with 2019 data
By Dag Vongraven
20 September 2019
(PBSG) – At the last meeting of the IUCN/SSC Polar Bear Specialist Group (PBSG) in Anchorage in 2016, the group agreed that there was a need for new and documented criteria for the assessment of status and trends of polar bear populations. Work to develop a new set of criteria started in 2017, and was finalized in summer 2019. A complete new and updated status table and an accompanying detailed report on status and trend assessments made for all 19 subpopulations has now been published. This is the main product of the group, and is vital input to the circumpolar action plan run by the Parties to the 1973 Agreement on the conservation of polar bears. [cf. Graph of the Day: Status of Polar Bear Populations, March 2010 and Status of polar bear populations for 2014. –Des]
Read the full report: Status Report on the World’s Polar Bear Subpopulations [pdf].
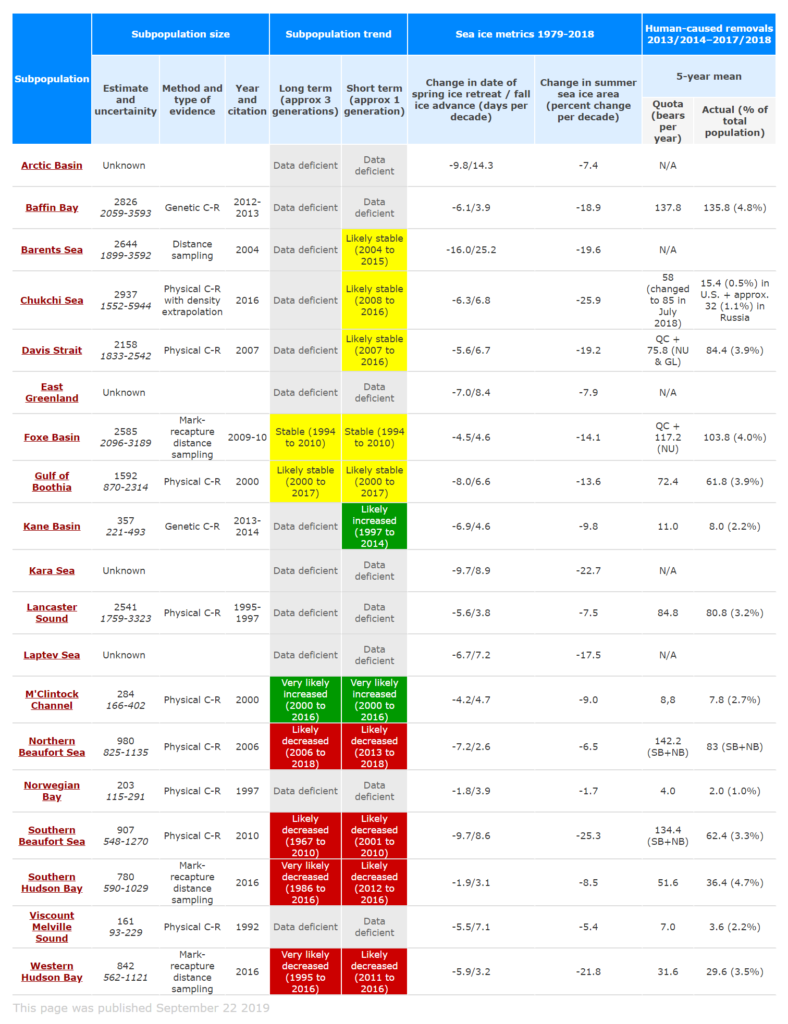
New PBSG status table finalized
Status Report on the World’s Polar Bear Subpopulations
July 2019 (PBSG) – […] The total number of polar bears worldwide is estimated to be 26,000 (95% CI=22,000–31,000; Regehr et al. 2016). The following subpopulation summaries and status are based on information presented and discussions at the 18th Working Meeting of the IUCN/SSC Polar Bear Specialist Group held in Anchorage, Alaska, 7–11 June 2016 (Durner et al. 2018) and review of new information that became available more recently. The information on each subpopulation is based on the status reports given by each nation. We present estimated subpopulation sizes and associated uncertainty in those estimates, subpopulation trends, changes in sea ice habitat, recent human-caused mortality, and summaries of subpopulation-specific concerns and vulnerabilities. […]
Northern Beaufort Sea (NB)
The highly quantified population assessments of population size of polar bears in SB, using the original PBSG boundaries (which include a significant amount of area now included in the interim boundary of NB), show a dramatic decline in the estimates of population size from 1,526 (95% CI = 1,211 – 1,841) polar bears in 2006 (Regehr et al. 2010) to 907 (95% CI = 548 – 1,270) in 2010 (Bromaghin et al. 2015); 2) polar bear body condition, stature, and reproduction have all declined between 1982 and 2006, trends which have been linked to multi-year trends of declining sea ice conditions (Rode et al. 2010); 3) the proportion of fasting polar bears more than doubled between 1985-1986 and 2005-2006, supporting the hypothesis that energy balance of polar bears has changed in the eastern Beaufort Sea and may at least partially explain observed declines in survival (Cherry et al. 2009); 4) hunter success in harvesting the allowed quota in the original area of SB in Canada declined from 81.5% (248/304) in the 1980s to 60% (231/385) in the 1990s (Brower et al., 2002) and, subsequently, has declined further in the overall interim NB area between 2013 and 2018 to 46.4% (62.4/134) see 2019 Status Table; and 5) in March 2012, an aerial survey of offshore areas in NB was carried out in which 7776 km of transects in polar bear habitat were surveyed a total of only two mother-yearling pairs were observed (McDonald 2012). All these results are consistent with a declining population of polar bears in NB. […]
Southern Beaufort Sea (SB)
[…] Declines in polar bear body condition, stature, and reproduction have been linked to multi-year trends of declining sea ice (Rode et al. 2010). Multiple assessments of temporal patterns of feeding ecology found that the number of bears that are in a physiological fasting state in April/May increased from the mid-1980s to the mid-2010s (Cherry et al. 2009, Rode et al. 2018). These data support the hypothesis that energy balance of polar bears has changed in the southern Beaufort Sea, which may explain declines in survival observed in the mid-2000s. The availability of sea ice habitat for polar bears (Durner et al. 2009) is reduced with declining sea ice extent (Stroeve et al. 2014), resulting from the continuing effects of climate warming. Atwood et al. (2016) and Pongracz and Derocher (2017) found that polar bears in the SB are spending significantly more time on land, which is correlated with the extent of ice retreat. Further, while on land, many polar bears feed on the subsistence-harvested bowhead whale remains aggregated at Cross Island near the Prudhoe Bay industrial infrastructure and Barter Island near the community of Kaktovik (Herreman and Peacock 2013, Rogers et al., 2015). Increased polar bear activity near human settlements may increase exposure to terrestrialbased pathogens (Atwood et al. 2017) and the risk of human-bear interactions.
Southern Hudson Bay (SH)
[…] The ice-free season within the SH boundaries increased by about 30 days from 1980 to 2012 (Obbard et al. 2016; Stern and Laidre 2016). Concurrently, body condition declined in all age and sex classes, though the decline was less for cubs than for other social classes (Obbard et al. 2016). The intensive aerial survey was repeated in September 2016 to assess recent trend in abundance. All areas in Ontario, Nunavut and Québec were sampled within a 3-week period to ensure complete coverage within the same year. Results suggest that abundance declined 17% from 943 bears (95% CI: 658–1350) in 2011/2012 to 780 (95% CI: 590–1029) in 2016. The proportion of yearlings declined from 12% of the population in 2011 to 5% in 2016, whereas the proportion of cubs remained similar (16% in 2011 vs. 19% in 2016) suggesting low survival of the 2015 cohort (Obbard et al. 2018). […]
Western Hudson Bay (WH)
[…] The most recent estimate of abundance comes from a mark-recapture distance sampling study in 2016 to update subpopulation status (Dyck et al. 2017). Pre-survey consultations with Nunavut Hunters’ and Trappers’ Organizations, Kivalliq communities, and with the Manitoba Department of Sustainable Development were conducted in order to include local and traditional knowledge in the study design. Dyck et al. (2017) estimated there to be 842 bears (95% CI: 562–1121) that, although not statistically significant from the previous aerial survey estimate, represented an 18% decline in abundance between 2011 and 2016. Over the same period of time and using similar methods, Obbard et al. (2018) documented a 17% decline in abundance for the neighbouring Southern Hudson Bay subpopulation. Similar to observations from the 2011 survey, cubs-of-the-year and yearling cubs comprised a small proportion of the sample size (Dyck et al. 2017) and suggested that low reproductive performance of the Western Hudson Bay subpopulation has continued. From the 1930s through the 1960s, Inuit report that encounters with polar bears in the interior of the Kivalliq mainland and along the Kivalliq coast of Hudson Bay were rare (Nirlungayuk and Lee 2009; Tyrrell 2009). Within the last few decades more bear-human encounters have occurred resulting in increased concerns for human safety and property damage (Tyrrell 2006, 2009; Henri et al. 2010). [more]
Status Report on the World’s Polar Bear Subpopulations [pdf]