Attendees at the Cambridge Disinformation Summit at King’s College, which took place on 27 July 2023 and 28 July 2023. Photo: Keith Heppell / Cambridge Independent

Cambridge Disinformation Summit musters interdisciplinary ethos and sets up future agenda – News outlets should get “nutrition labels”

By Mike Scialom 2 August 2023 (Cambridge Independent) – The inaugural Cambridge Disinformation Summit, which took place on Thursday and Friday last week, proved hugely rewarding, say speakers and delegates who attended. This first event, organised by Alan Jagolinzer, professor of financial accounting at Cambridge Judge Business School, offered a global interdisciplinary perspective on the […]

Graphic showing the years in which the gender gap will be closed in various world regions, as measured in the year 2023. In Latin America, the gap is estimated to close in 53 years. In East Asia and the Pacific, the gap is estimated to close in 189 years. Graphic: World Economic Forum

It could take 131 years for the world to close the gender gap – “Not only are millions of women and girls losing out on economic access and opportunity, but these reversals also have wide-ranging consequences for the global economy”

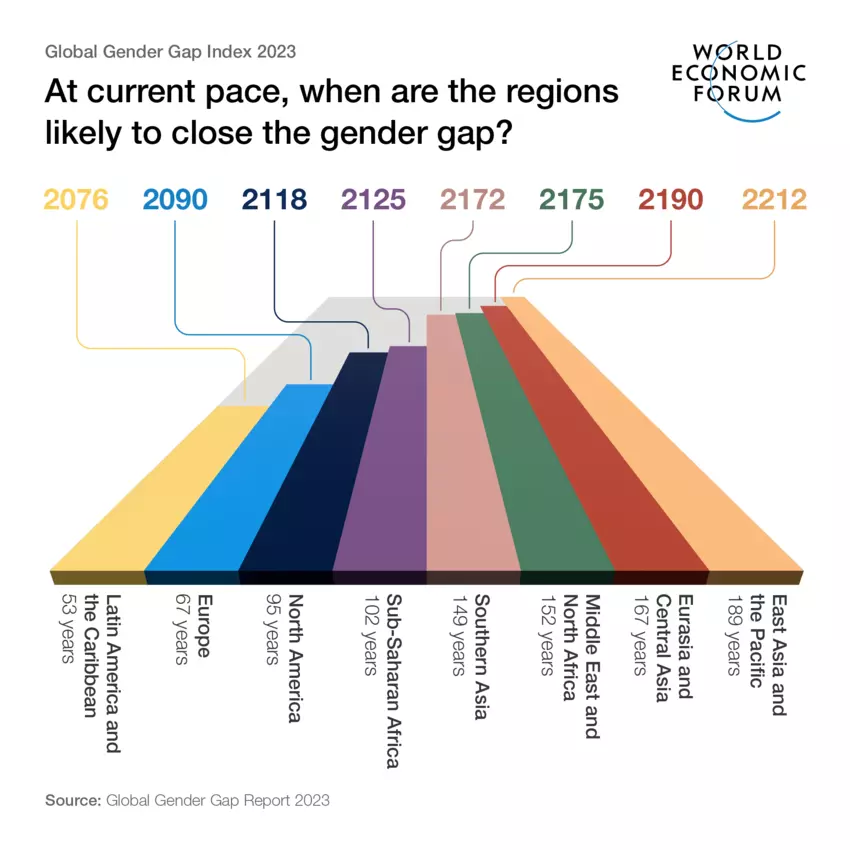
By Alicia Wallace 20 June 2023 Minneapolis (CNN) – Progress on achieving global gender equality is languishing. A new report from the World Economic Forum estimates that women won’t attain parity with men for another 131 years. In other words, not until 2154. The overall gender gap — a measurement of equality across the realms of the economy, politics, […]

Change Over Time in (a) US Life Expectancy and (b) US Life Expectancy Gap and Rank Relative to Populous Countries (Population>500000), 1950-2021. Phase 1=1950–1954; phase 2=1955–1973; phase 3=1974–1982; phase 4=1983–2009; phase 5=2010–2019; phase 6=2020–2021. Bars plot the difference in life expectancy between the United States and the populous country (population >500000) with the highest life expectancy in the given year. The country with the highest life expectancy was Norway in 1950–1962 and 1976–1977, Sweden in 1963 and 1965–1975, the Netherlands in 1964, Japan in 1978–2007, Macao in 2008–2010, and Japan in 2011–2021. The line graph plots US rank relative to other populous countries, with higher rank denoting lower US life expectancy. Source: Author’s calculations based on UN data. Graphic: Steven H. Woolf MD, MPH, 2023 / AJPH

U.S. has been falling behind on life expectancy for decades – Between 1933 and 2021, 56 countries achieved higher life expectancy than U.S. – “Americans are sicker and die earlier than people in dozens of countries”

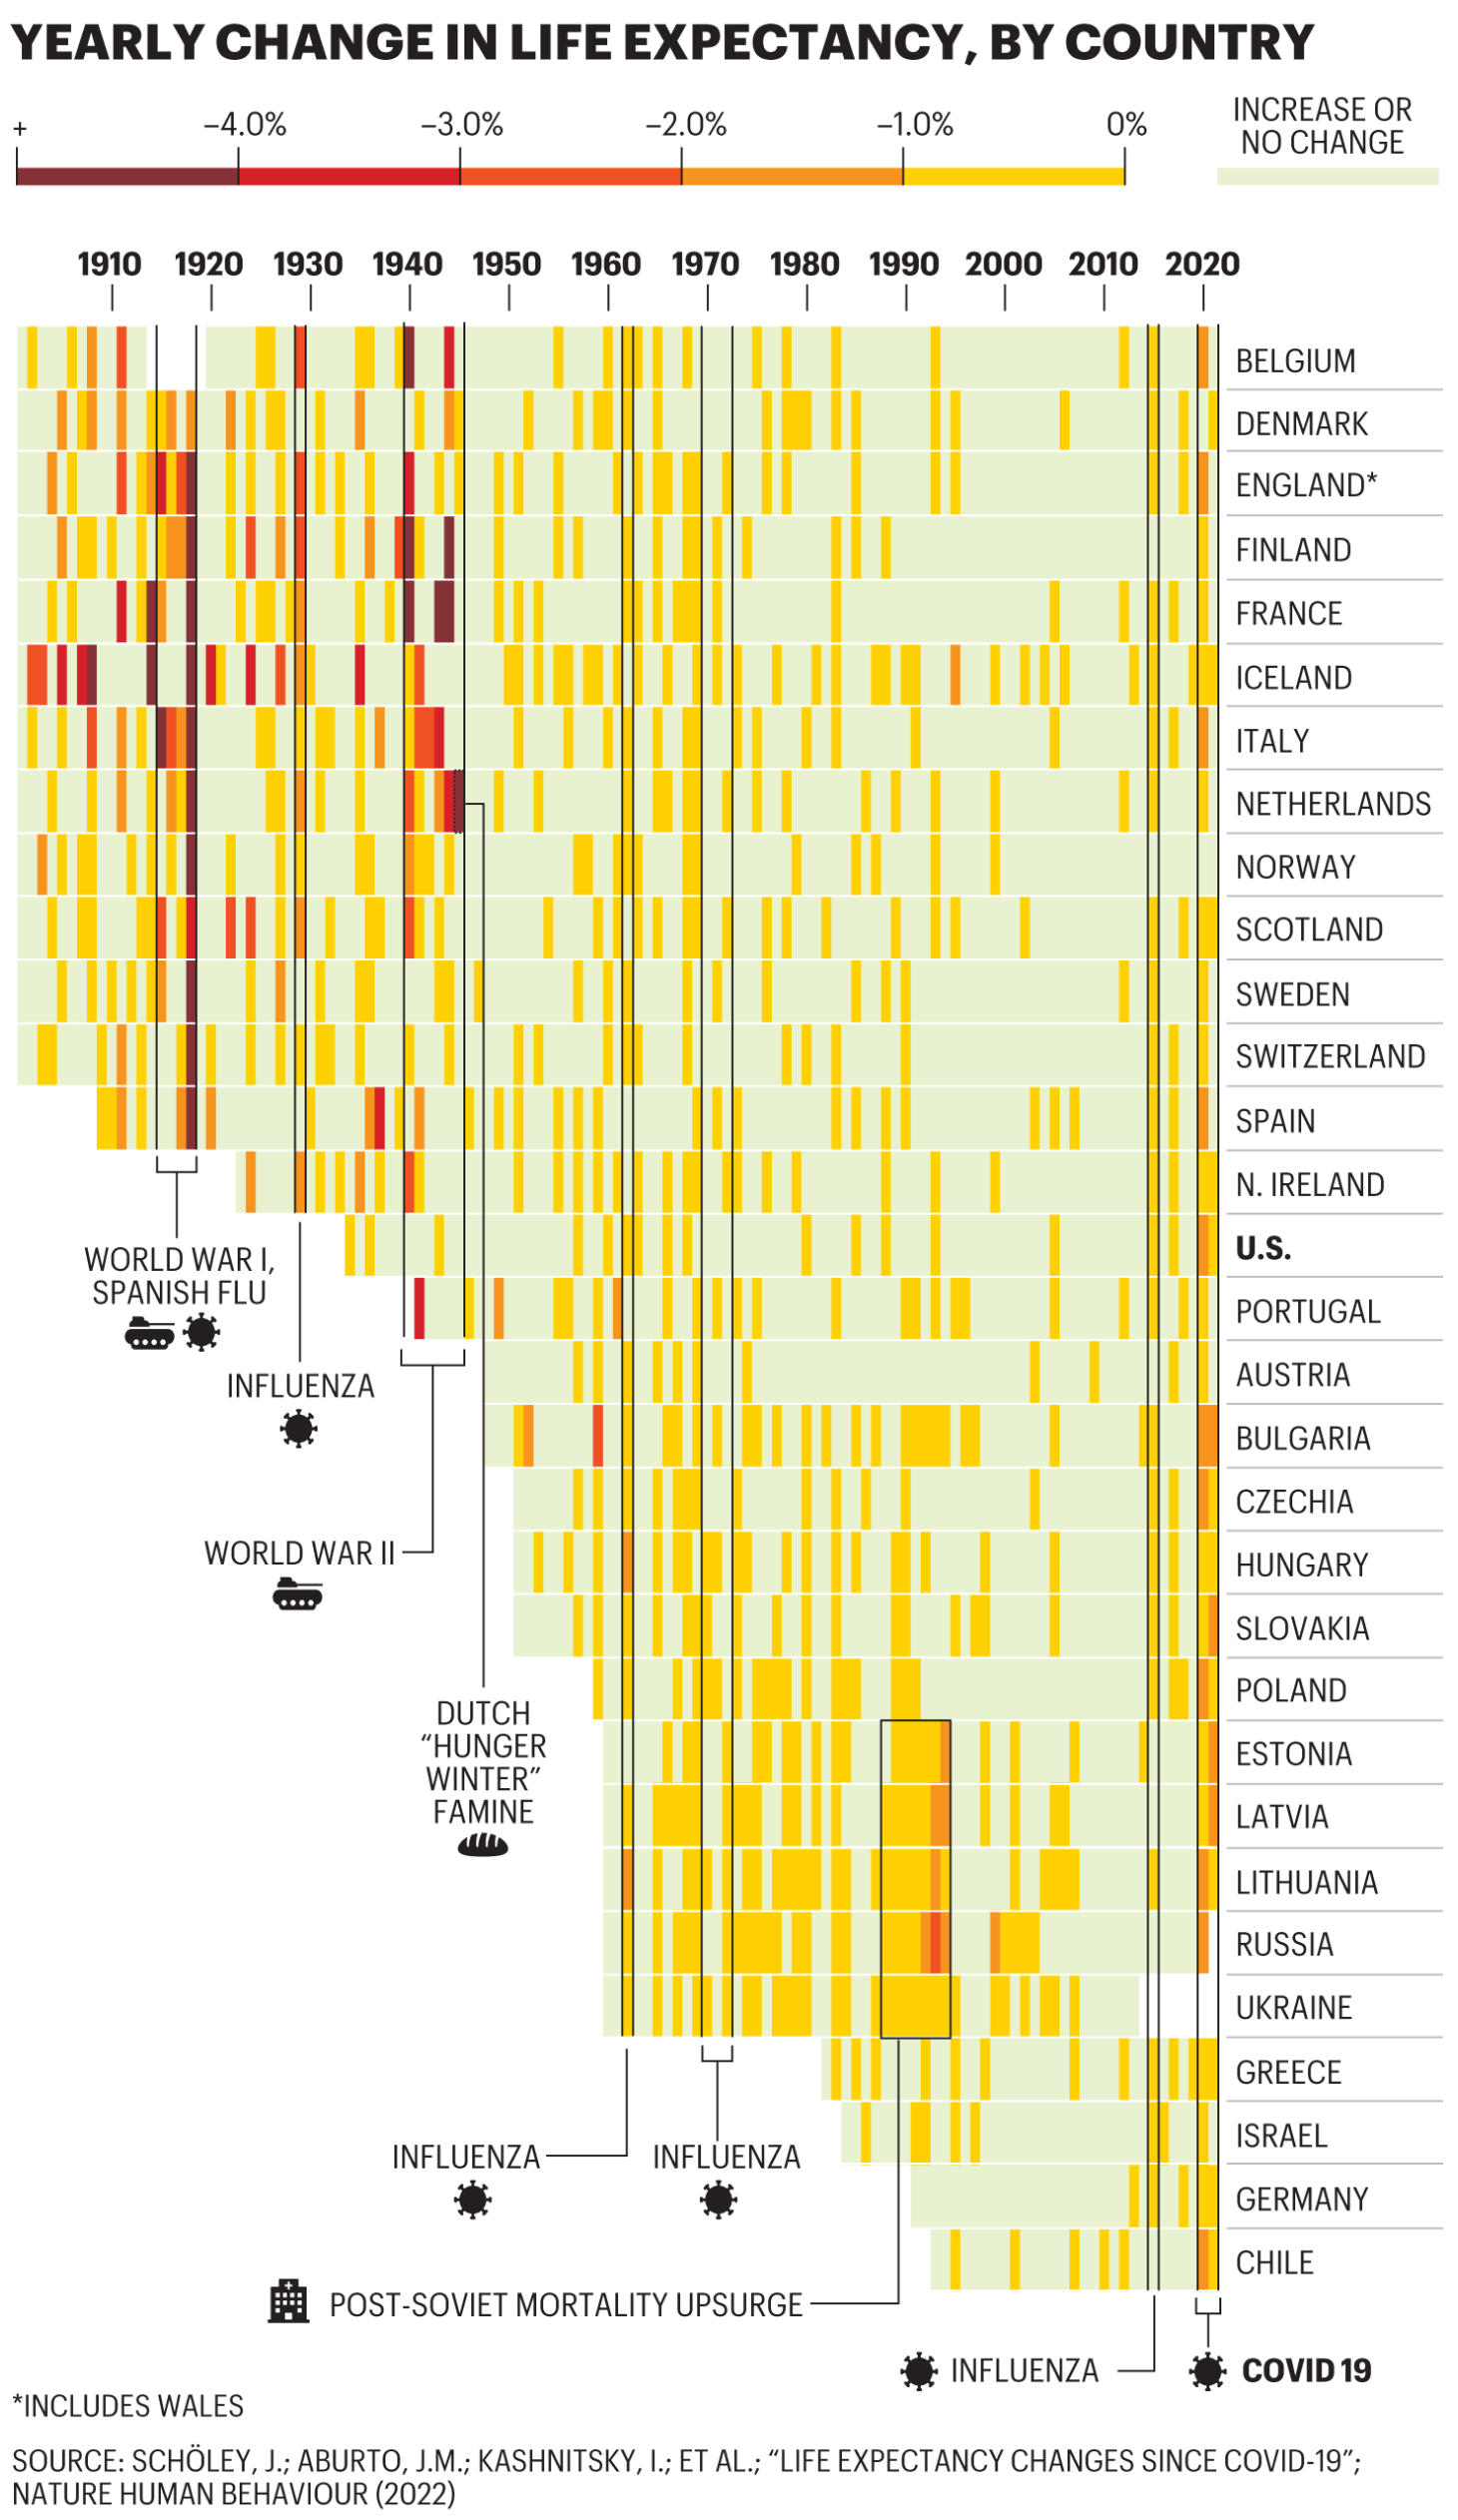
By Olivia Trani 1 June 2023 (VCU) – When it comes to public health, the United States is at a disadvantage compared with other developed countries. Americans experience more illness, have less access to health care and pay more for health services than citizens in other high-income countries. Americans also die earlier – and have been doing so […]

Yearly change in life expectancy in the U.S. and 30 other countries, 1901-2022. Data: Schöley, et al., 2022. Graphic: Fortune

The first global decline in life expectancy since World War II poses a major threat to the economy

By Matthew Heimer and Nicolas Rapp6 December 2022 (Fortune) – COVID’s devastation shows up starkly in life expectancy data: The pandemic’s peak marked the first time since World War II that LE (as demographers call it) declined across the globe. The graphic above is based on a data set that focuses mostly on Europe, but similar […]

(a) Annual mean temperature anomalies in the Arctic (66.5∘–90∘N) (dark colours) and globally (light colours) during 1950–2021 derived from the various observational datasets. Temperature anomalies have been calculated relative to the standard 30-year period of 1981–2010. Shown are also the linear temperature trends for 1979–2021. (b) Annual mean temperature trends for the period 1979–2021, derived from the average of the observational datasets. Areas without a statistically significant change are masked out. (c) Local amplification ratio calculated for the period 1979–2021, derived from the average of the observational datasets. The dashed line in (b) and (c) depicts the Arctic Circle (66.5∘N latitude). Graphic: Rantanen, et al., 2022 / Communications Earth and Environment

Arctic warming four times faster than rest of Earth – “Something is happening in the Arctic, and it will affect us all”

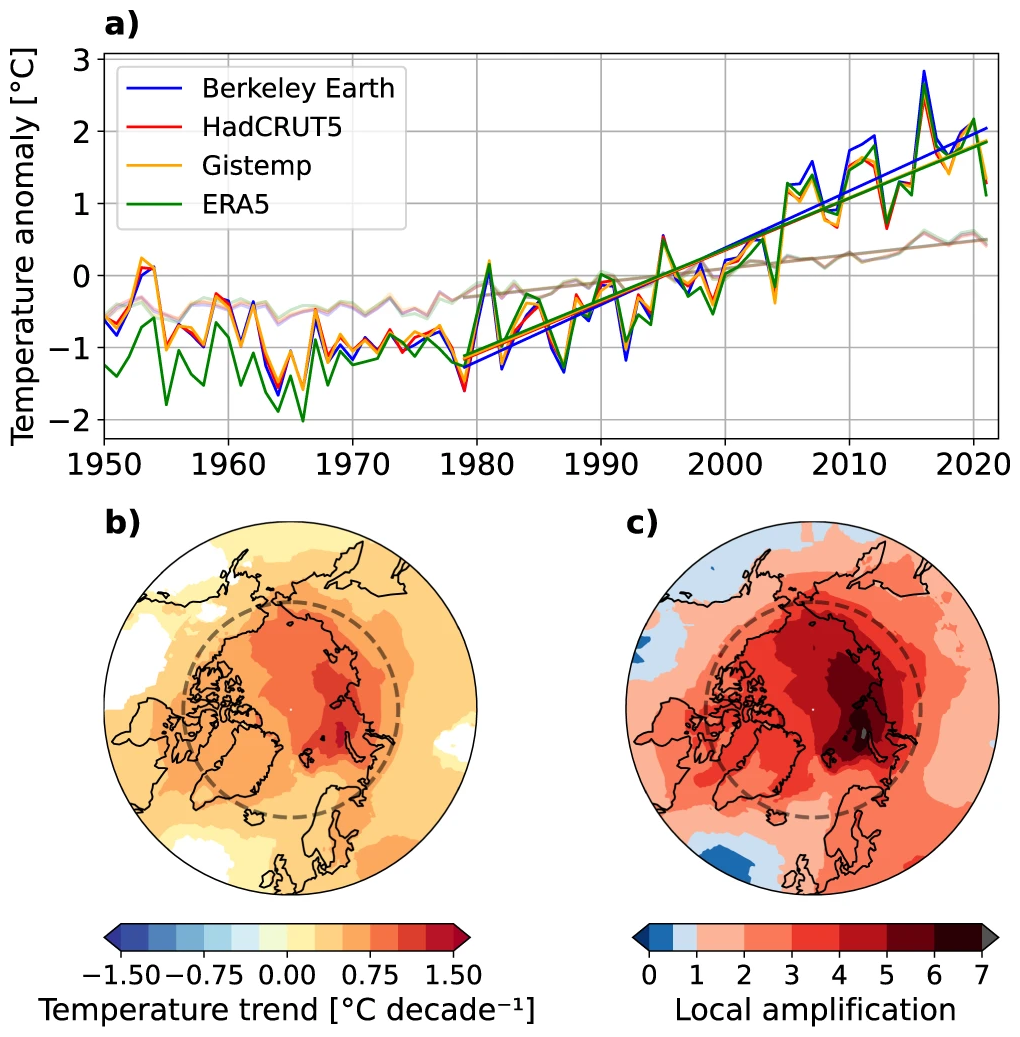
PARIS, 11 August 2022 (AFP) – The Arctic has warmed nearly four times faster than the rest of the planet over the last 40 years, according to research published Thursday that suggests climate models are underestimating the rate of polar heating. The United Nations’ climate science panel said in a special report in 2019 that […]

Social media & sharing icons powered by UltimatelySocial