U.S. has been falling behind on life expectancy for decades – Between 1933 and 2021, 56 countries achieved higher life expectancy than U.S. – “Americans are sicker and die earlier than people in dozens of countries”
By Olivia Trani
1 June 2023
(VCU) – When it comes to public health, the United States is at a disadvantage compared with other developed countries. Americans experience more illness, have less access to health care and pay more for health services than citizens in other high-income countries. Americans also die earlier – and have been doing so for much longer than originally thought.
Life expectancy in the United States is lower than in the rest of the industrialized world, and a new study shows that the nation began falling behind as long ago as the 1950s, decades earlier than previously believed. The findings, published Thursday in the American Journal of Public Health, also show that dozens of countries across six continents have outranked the United States in life expectancy over the past 70 years.
“The new study challenges two assumptions that have influenced previous research on the U.S. life expectancy disadvantage,” said Steven Woolf, M.D., director emeritus of the Center on Society and Health at Virginia Commonwealth University and author of the new study. “First, past studies have usually only compared the United States with a select group of 15-20 ‘peer countries,’ largely Anglo-Saxon or Western European countries with high incomes. Second, experts typically consider the 1980s or 1990s as the inflection point when growth in U.S. life expectancy began underperforming compared with other countries. However, this analysis shows that premature deaths among Americans are a much larger and older public health issue than previously believed.”
Clarifying when U.S. life expectancy began to lag and how it compares with the rest of the world is important groundwork for investigating potential causes and solutions.
A history of falling behind
For the new study, Woolf obtained life expectancy estimates from the United Nations, the Human Mortality Database and the U.S. Mortality Database to track trends from the past 80 years. In 1933, the beginning point for this data analysis, U.S. life expectancy ranked eighth-highest among 16 populous countries. Woolf then examined the pace of growth in life expectancy from 1950 through 2021 in more than 200 countries.
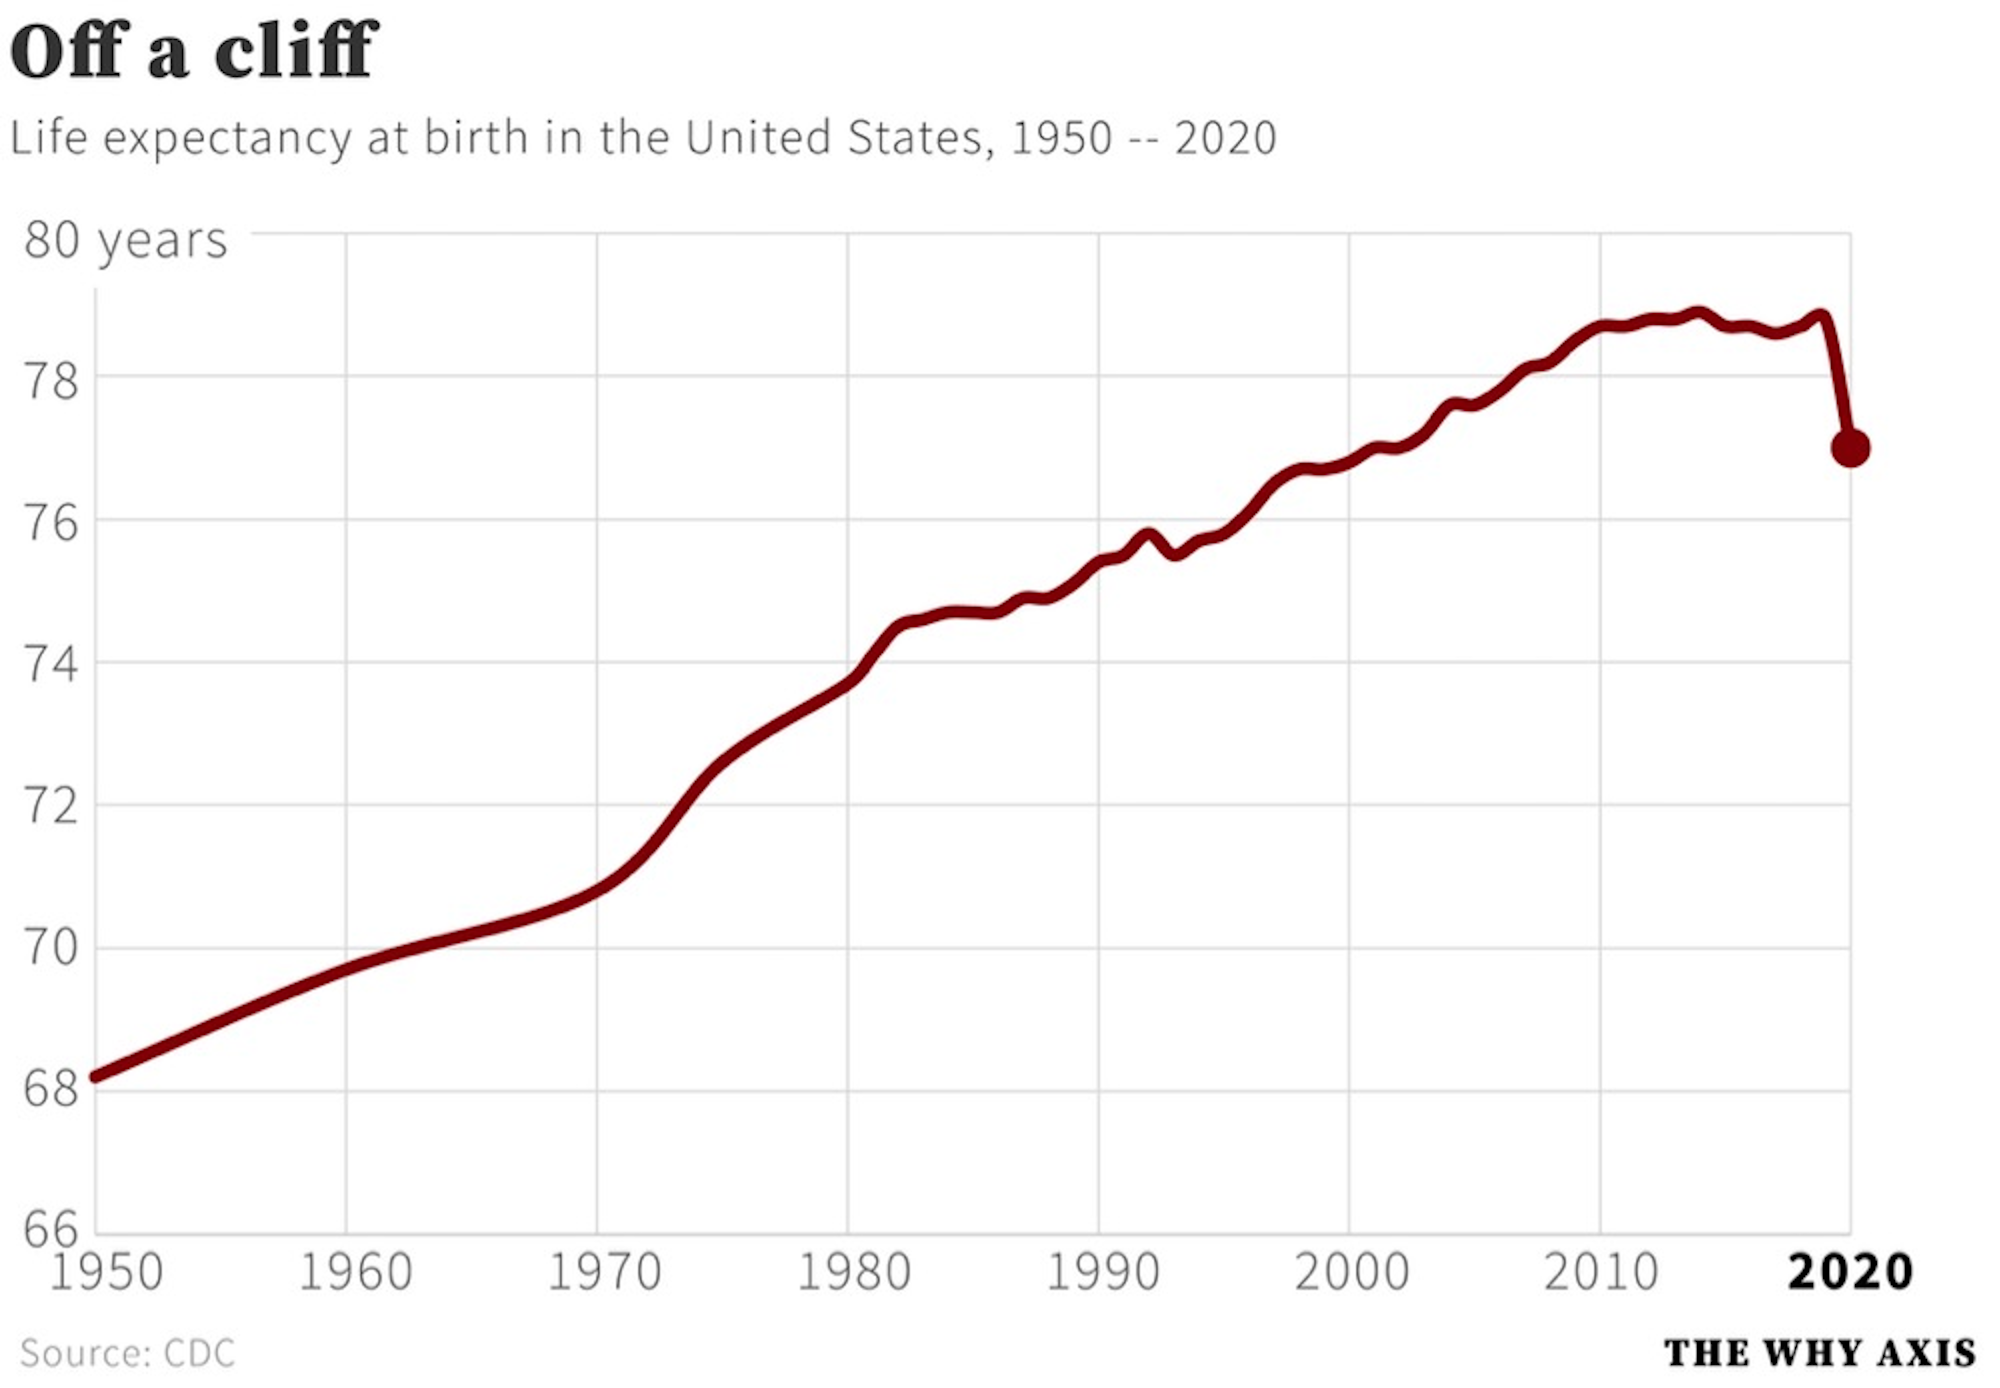
The study found that increases in U.S. life expectancy began to slow from 1950 to 1954 (0.21 years/annum) and slowed even further from 1955 to 1973 (0.10 years/annum). By 1968, the U.S. rank had fallen to 29th. After rebounding temporarily from 1974 to 1982 (0.34 years/annum), U.S. life expectancy slowed again from 1983 to 2009 (0.15 years/annum), essentially “flatlined” from 2010 to 2019 (0.06 years/annum) and plummeted in 2020 to 2021 (–0.97 years/annum) due to the COVID-19 pandemic.
During each of these periods of slowing, the U.S. lost ground to other countries. By 2020, its life expectancy ranked 46th among populous countries.
“We may be one of the richest countries in the world, and we certainly outspend every country on health care, but Americans are sicker and die earlier than people in dozens of countries. We’ll keep falling behind unless we get serious about policy solutions,” said Woolf, a professor in the Department of Family Medicine and Population Health at the VCU School of Medicine.
Global perspective on an American problem
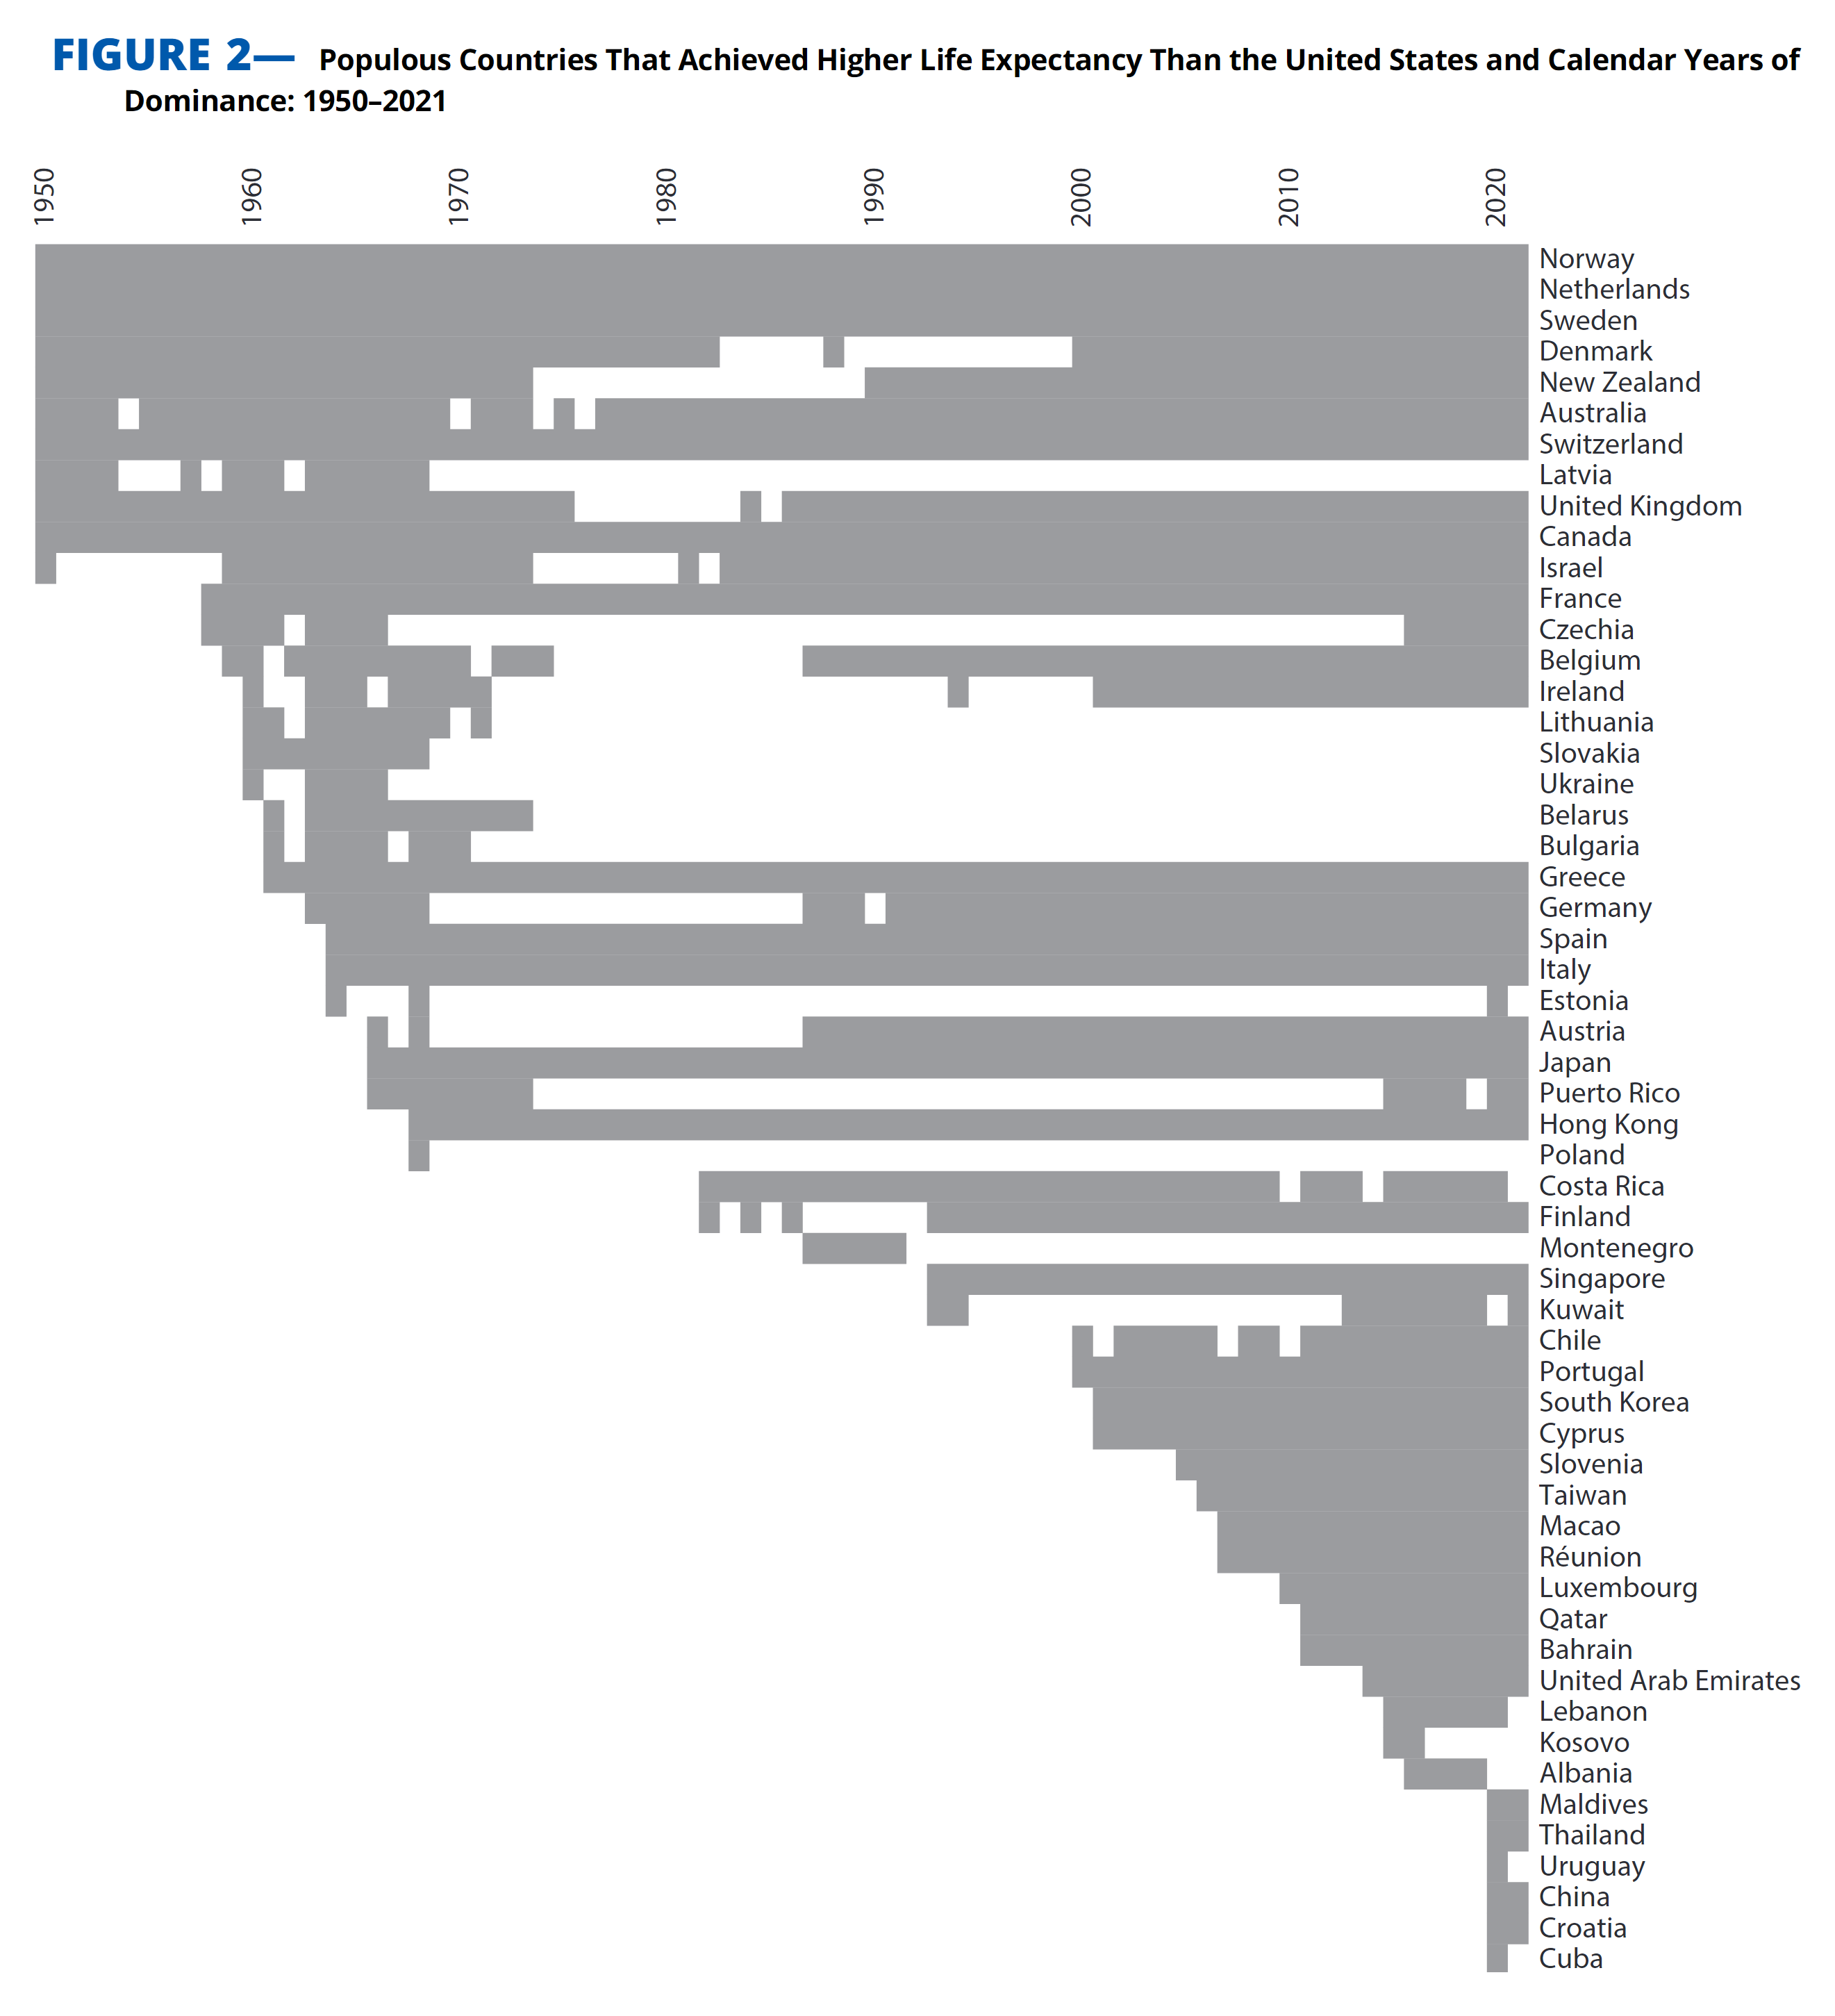
Woolf’s analysis revealed that between 1933 and 2021, 56 countries from around the world had at one point achieved a higher life expectancy than the United States, including 17 countries that outranked the United States for more than 50 years.
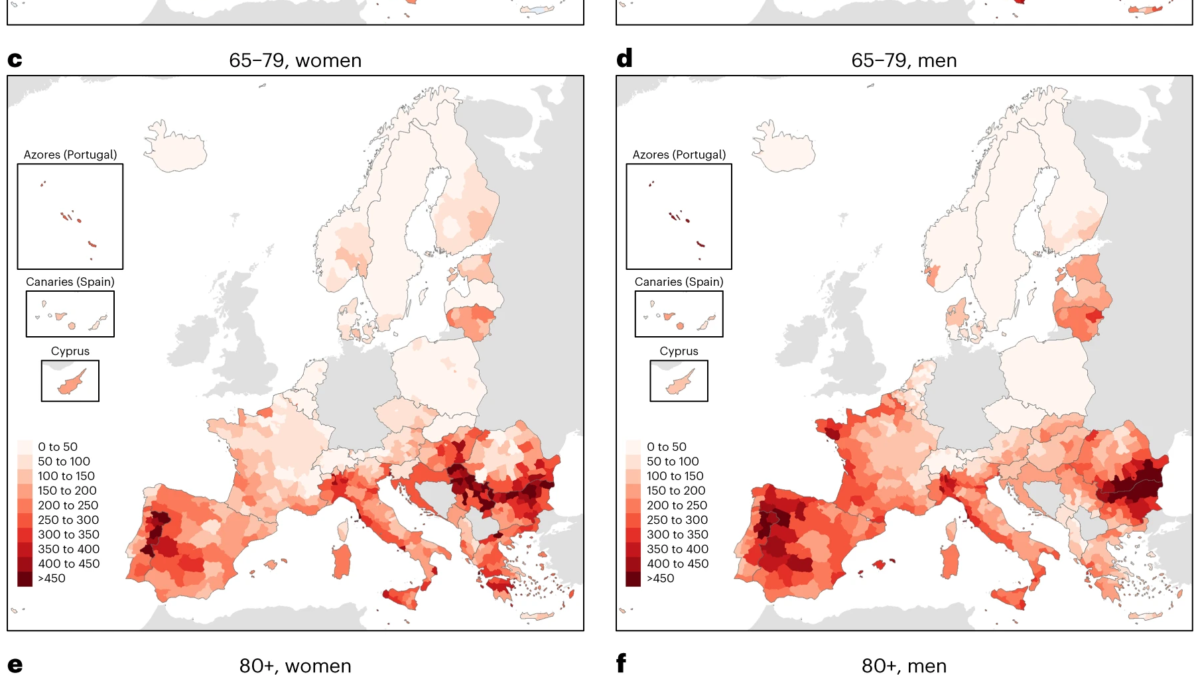
Before 1950, most countries that outperformed the United States were concentrated in Northern and Western Europe. However, in the 1950s and 1960s, several Southern and Eastern European countries also surpassed the United States. A number of Asian countries also began outpacing the United States as early as the 1960s, as well as several Middle Eastern countries beginning in the 1990s and continuing into the 2010s.
Countries with less affluence and less elaborate health care systems have previously been considered a poor benchmark for measuring the U.S. health disadvantage, based on the assumption that only wealthy countries could outperform the United States.
“If you only compare the United States with 15 high-income countries, you can guarantee that it will never rank worse than 15th,” Woolf said. “However, we found that countries with different cultures, forms of governance, societies and economies have all found a way to outperform the United States in terms of health outcomes and life expectancy. Even former Soviet countries in Eastern Europe managed to surpass the United States.”
State-level issues behind national trends
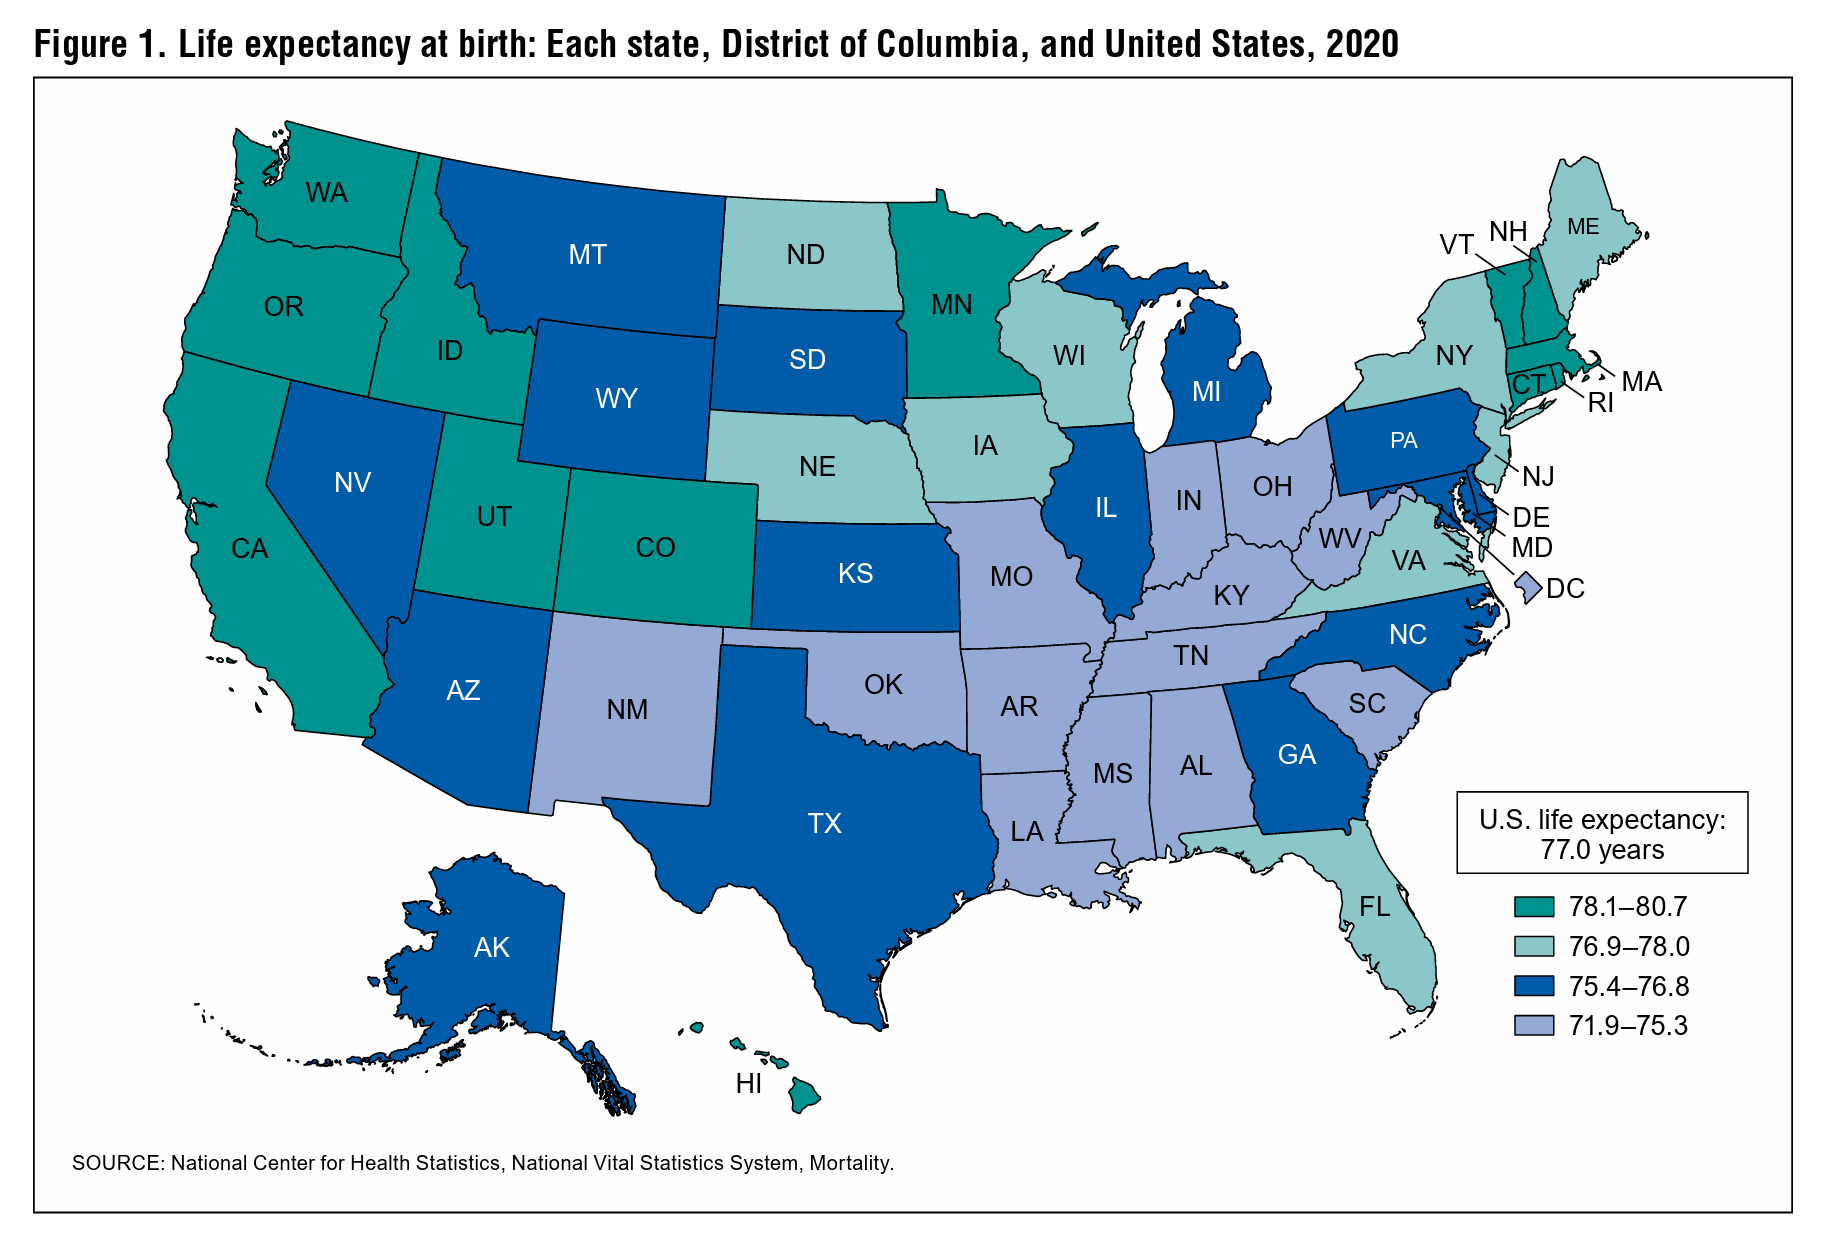
Woolf additionally examined how life expectancy trends varied among U.S. states, revealing significant disparities that widened over 60 years. Growth rates in life expectancy were generally highest in the Northeast and West and lowest in South Central and Midwestern states.
In 1959, Kansas and South Carolina had the nation’s highest and lowest life expectancy, respectively. If these states were their own countries, they would have ranked fifth and 34th among the world’s populous countries. By 2019, the state with the highest life expectancy, Hawaii, would have ranked 22nd compared with other countries, whereas the state with the lowest life expectancy, Mississippi, would have ranked 79th.
“State governments play a large role in promoting the health and well-being of their constituents, and over time we’ve seen widening disparities in health trends at the state level,” Woolf said. “This is encouraging, as it shows that states are capable of adopting policies that improve health, but it is also discouraging, because many other states that fared poorly in this study are now actively weakening or rolling back such policies.”
Underlying problems and potential solutions
While more research is needed to understand the complex reasons behind these trends, the pervasiveness of the U.S. health disadvantage over the past few decades suggests that the problem is larger and more enduring than a single health issue, according to Woolf.
“At the root of it, the health disadvantages experienced in the United States are likely the product of social values and policy decisions capable of producing widespread effects on health,” he said.
Woolf suggests that health declines may be due in part to policies that have relaxed regulations that protect public health and safety, redistributed wealth from the middle to the upper class, and curbed access to education, health care and human services.
Social and economic stresses, resulting in part from such policies, may help explain the geographic variation and slower growth in life expectancy in certain states. Earlier research co-authored by Woolf has shown that states that adopted more conservative policies were more likely to experience stagnant or decreasing life expectancy and higher mortality.
“The upside is that many countries have found a way to consistently ensure that their populations live longer, healthier lives. That’s hopeful, because it means that there are policy solutions that could help Americans live longer,” Woolf said. “This issue is not a lack of solutions, but rather a lack of political will.”
The U.S. life expectancy disadvantage is worse than previously believed
Falling Behind: The Growing Gap in Life Expectancy Between the United States and Other Countries, 1933–2021
ABSTRACT: Increases in US life expectancy slowed from 1950 to 1954 (0.21 years/annum) and 1955 to 1973 (0.10 years/annum), accelerated from 1974 to 1982 (0.34 years/annum), and progressively deteriorated from 1983 to 2009 (0.15 years/annum), 2010 to 2019 (0.06 years/annum), and 2020 to 2021 (–0.97 years/annum). Other countries experienced faster growth in each phase except 1974 to 1982. During 1933 to 2021, 56 countries on 6 continents surpassed US life expectancy. Growth in US life expectancy was slowest in Midwest and South Central states. The US life expectancy disadvantage began in the 1950s and has steadily worsened over the past 4 decades. Dozens of globally diverse countries have outperformed the United States. Causal factors appear to have been concentrated in the Midwest and South. Policies that differentiate the United States from other countries and circumstances associated with the Midwest and South may have contributed.