By Jovana Gec 11 July 2024 BELGRADE, Serbia (AP) – Weather alerts, forest fires, melting pavement in cities: A sizzling heat wave has sent temperatures in parts of central and southern Europe soaring toward 40 degrees Celsius (104 Fahrenheit) in some places. From Italy to Romania, authorities warned people to be cautious, drive carefully if […]
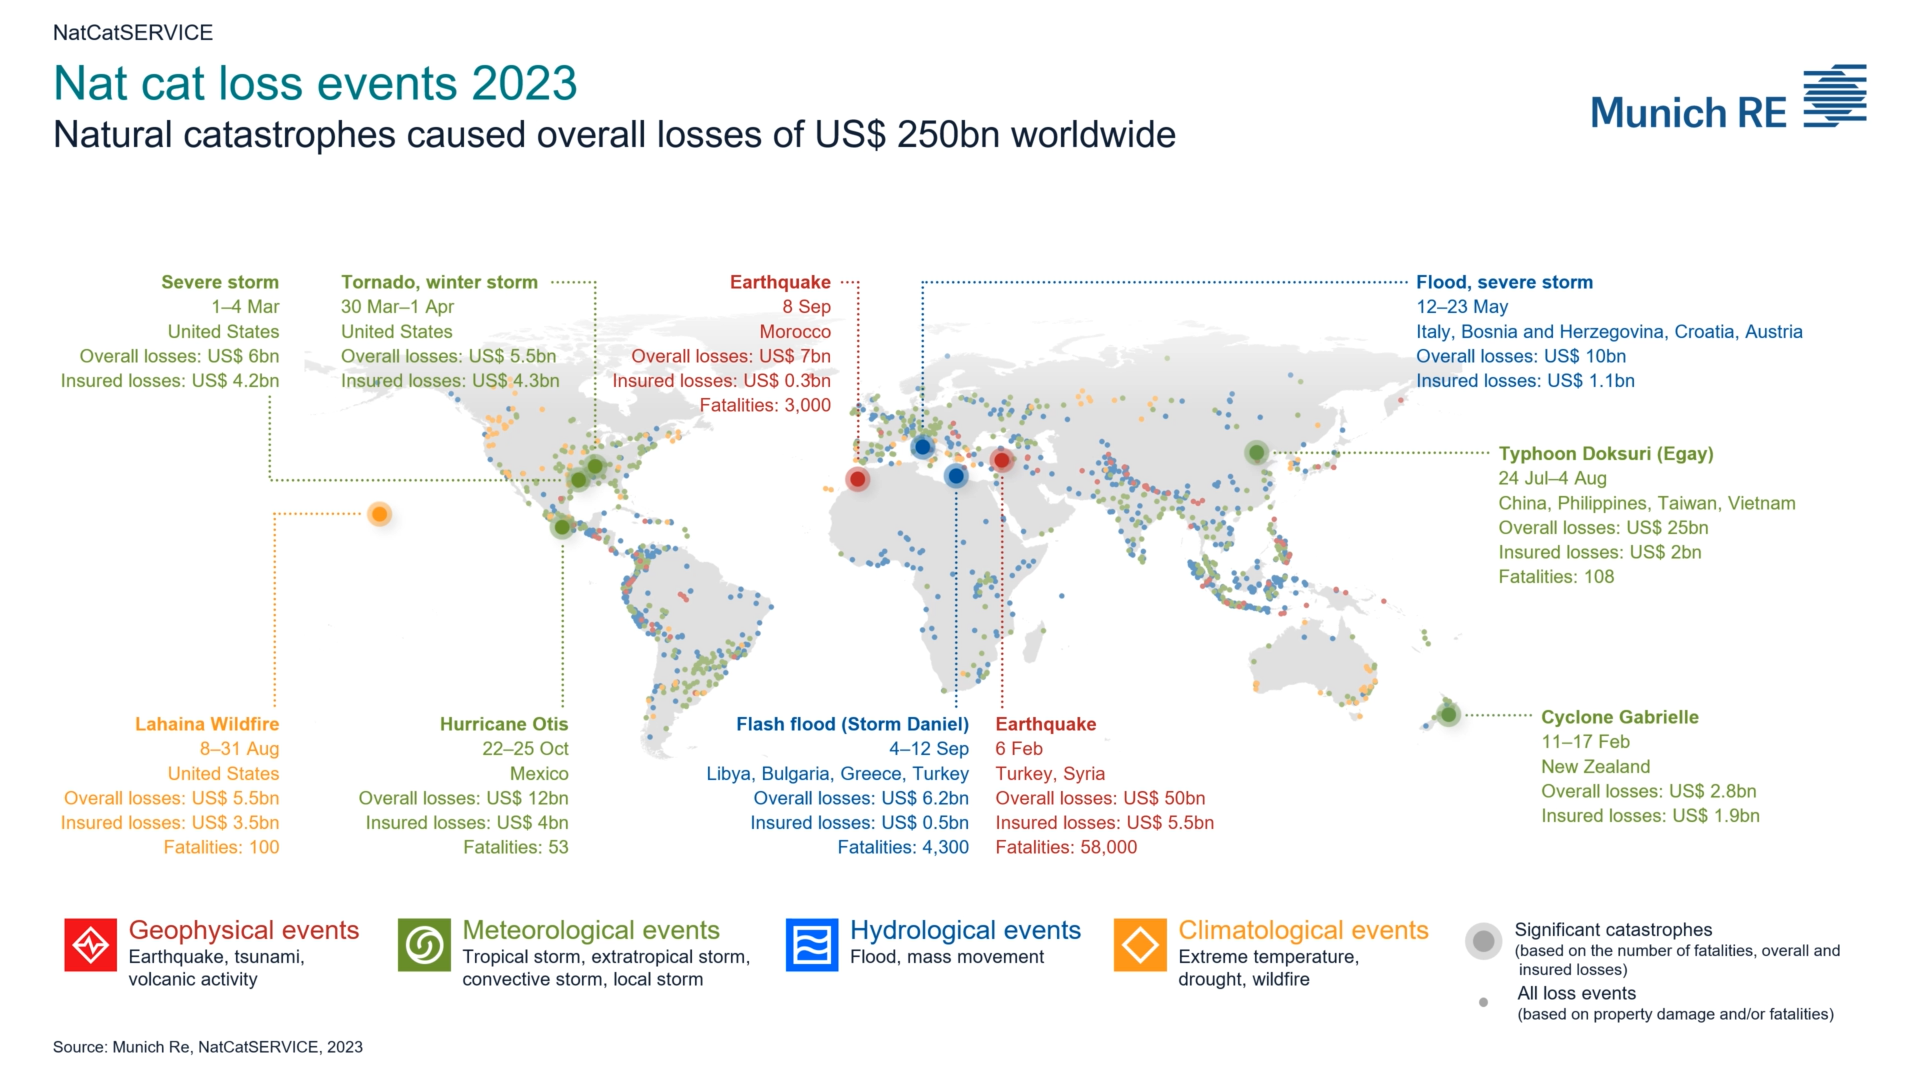
9 January 2024 (Munich Re) – Worldwide, natural disasters in 2023 resulted in losses of around US$ 250bn (previous year US$ 250bn), with insured losses of US$ 95bn (previous year US$ 125bn). Overall losses tally with the five-year average, while insured losses were slightly below the average figure of US$ 105bn. Unlike in previous years, […]
By Sarah Kuta 30 January 2024 (Smithsonian) – More than 2,000 years ago, climate change may have played a role in deadly pandemics that swept through the Roman Empire. Scientists have discovered a link between cold, dry periods and devastating bouts of fatal illness between 200 B.C.E. and 600 C.E. in Roman Italy, according to a […]
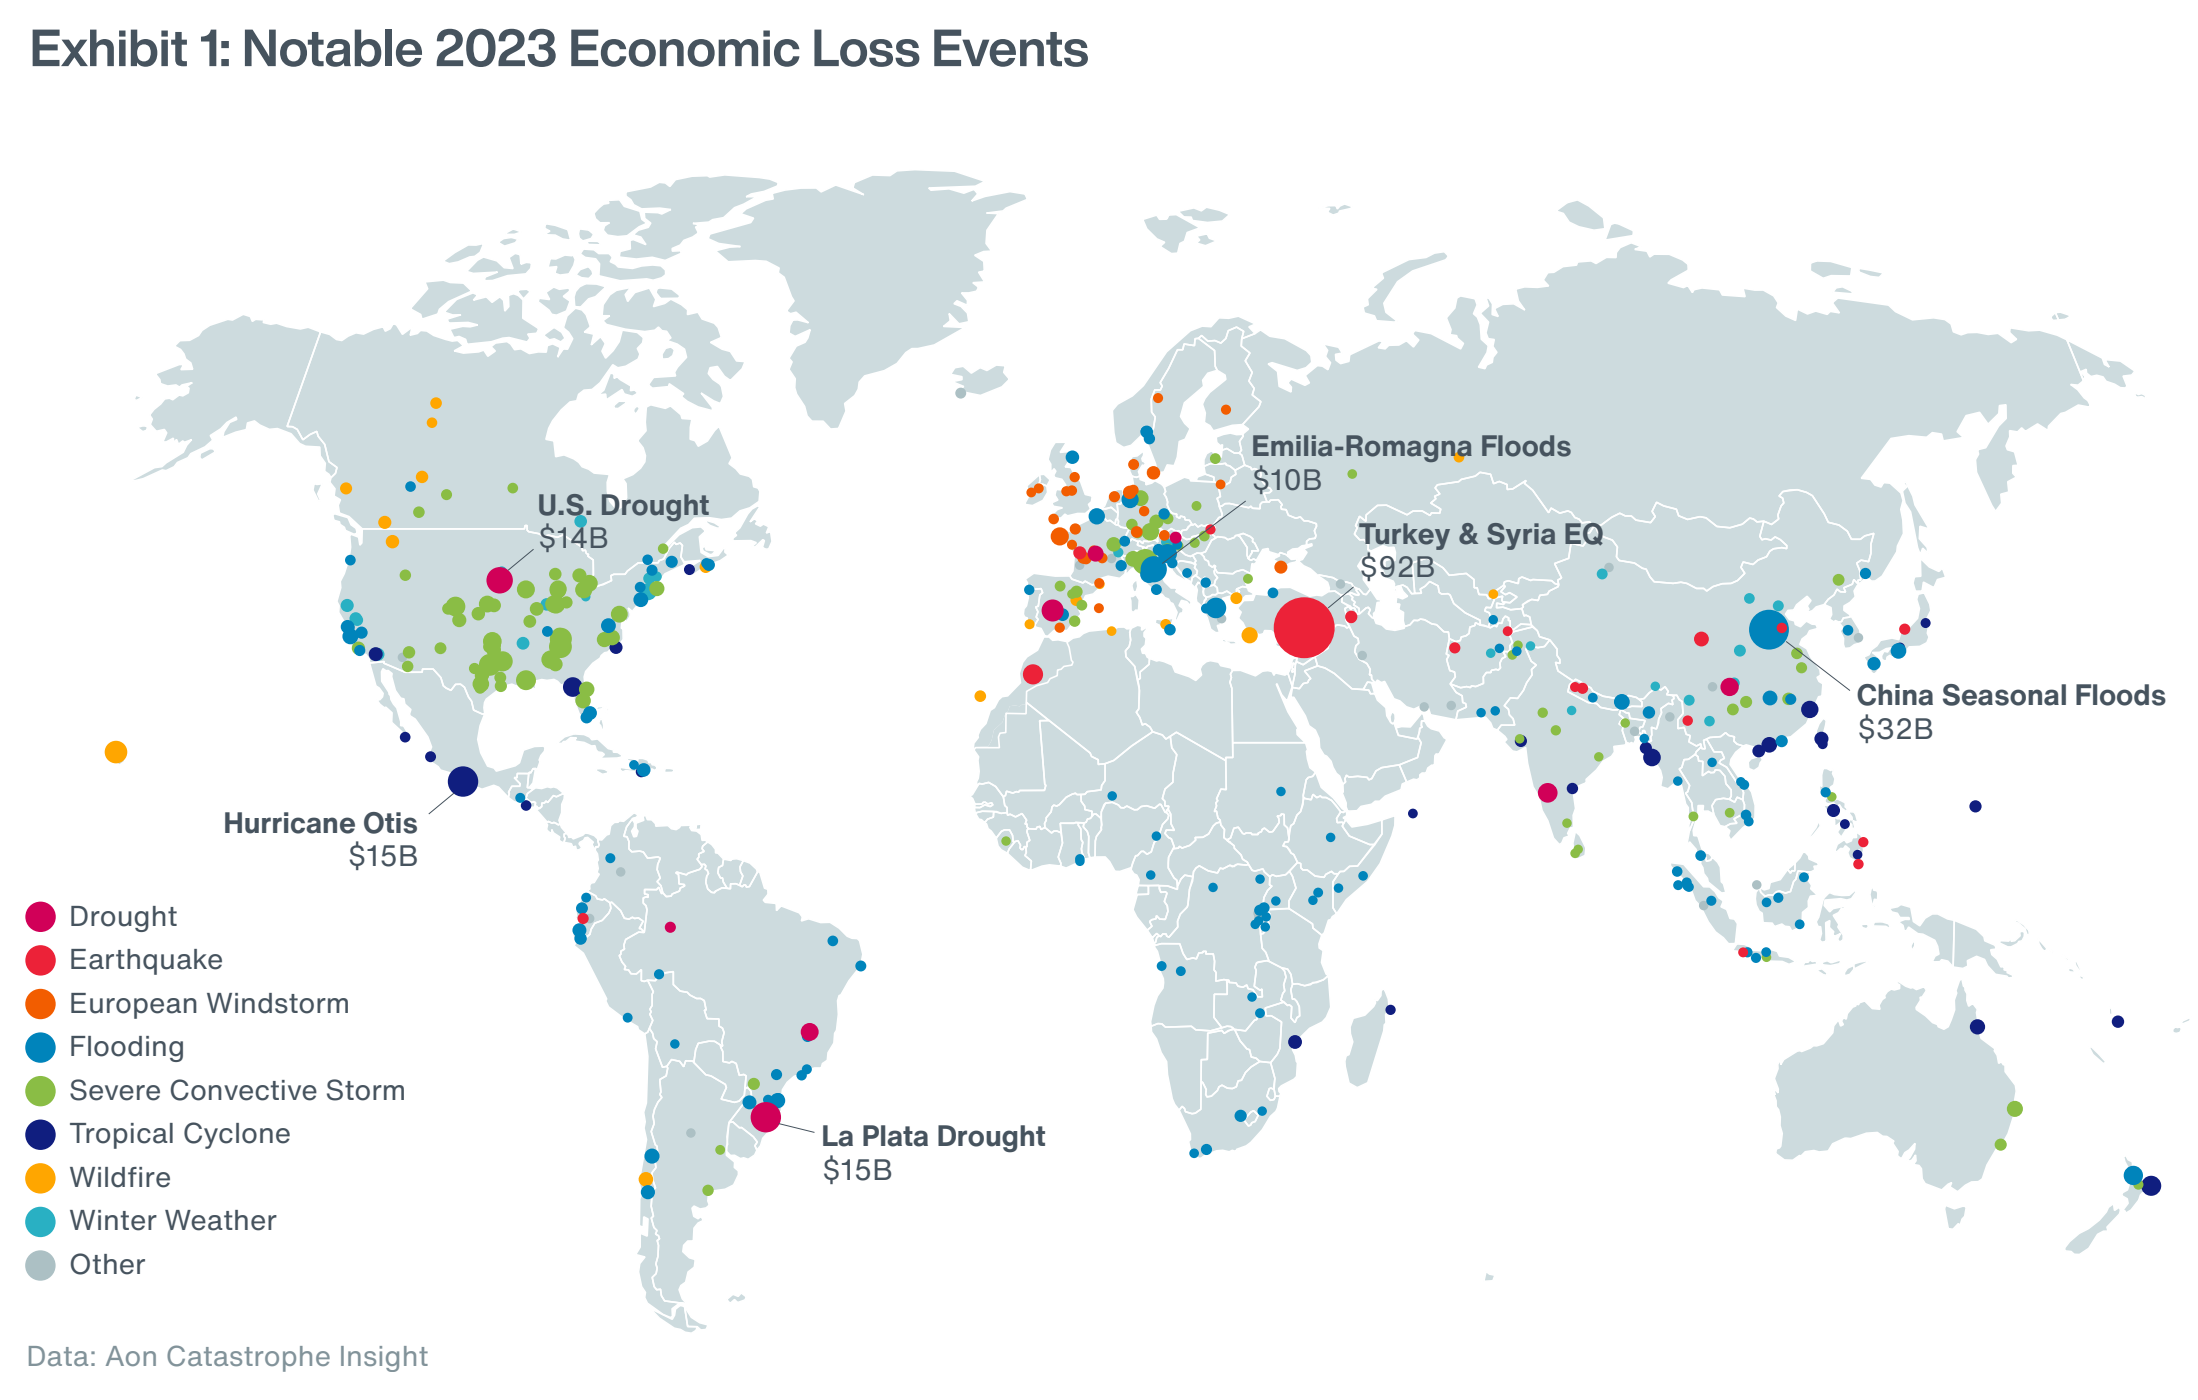
LONDON, 23 January 2024 (Aon) – Aon plc, a leading global professional services firm, today published its 2024 Climate and Catastrophe Insight report, which identifies global natural disaster and climate trends to help make better decisions to manage volatility and enhance global resilience. The report reveals that the 398 global natural disaster events caused a $380 billion (2022: $355 billion) […]
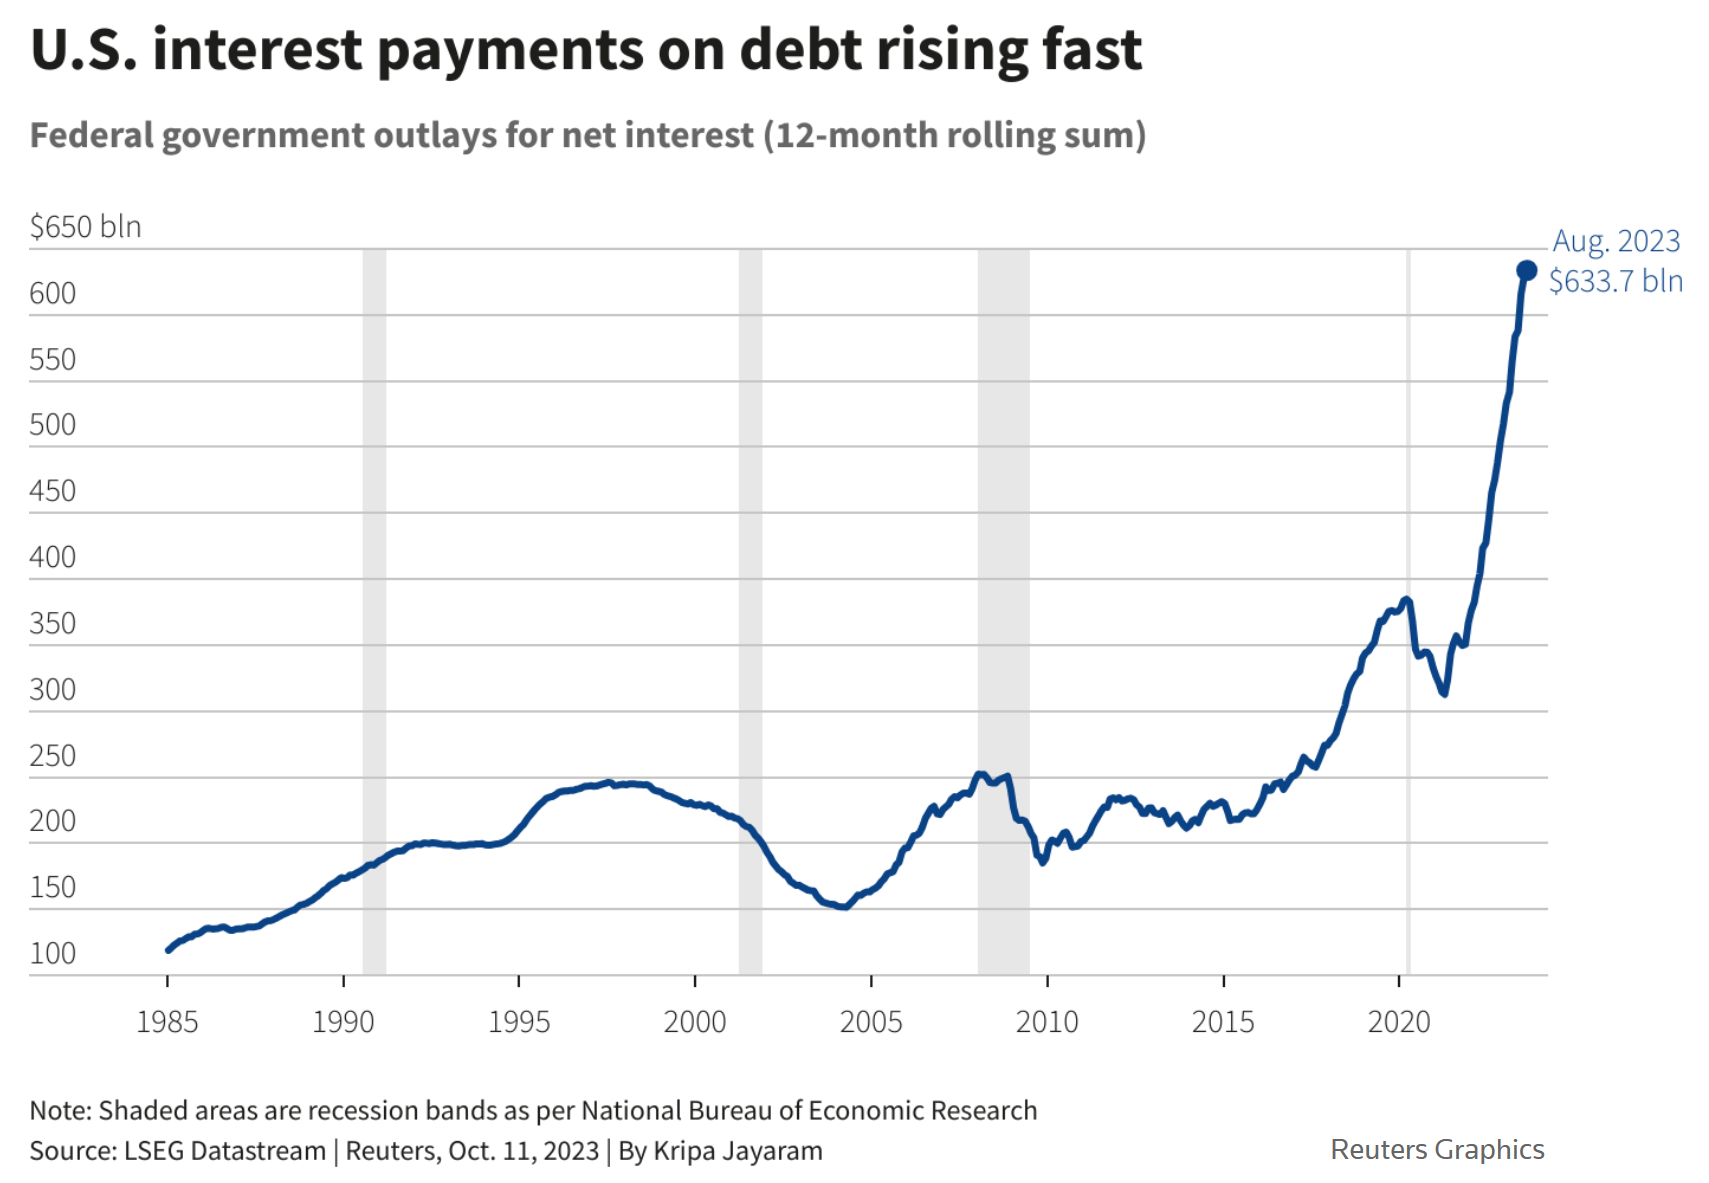
By Yoruk Bahceli, Dhara Ranasinghe, and Maria Martinez 16 October 2023 LONDON (Reuters) – Record debts, high interest rates, the costs of climate change, health, and pension spending as populations age and fractious politics are stoking fears of a financial market crisis in big, developed economies. A surge in government borrowing costs has put high debt in […]
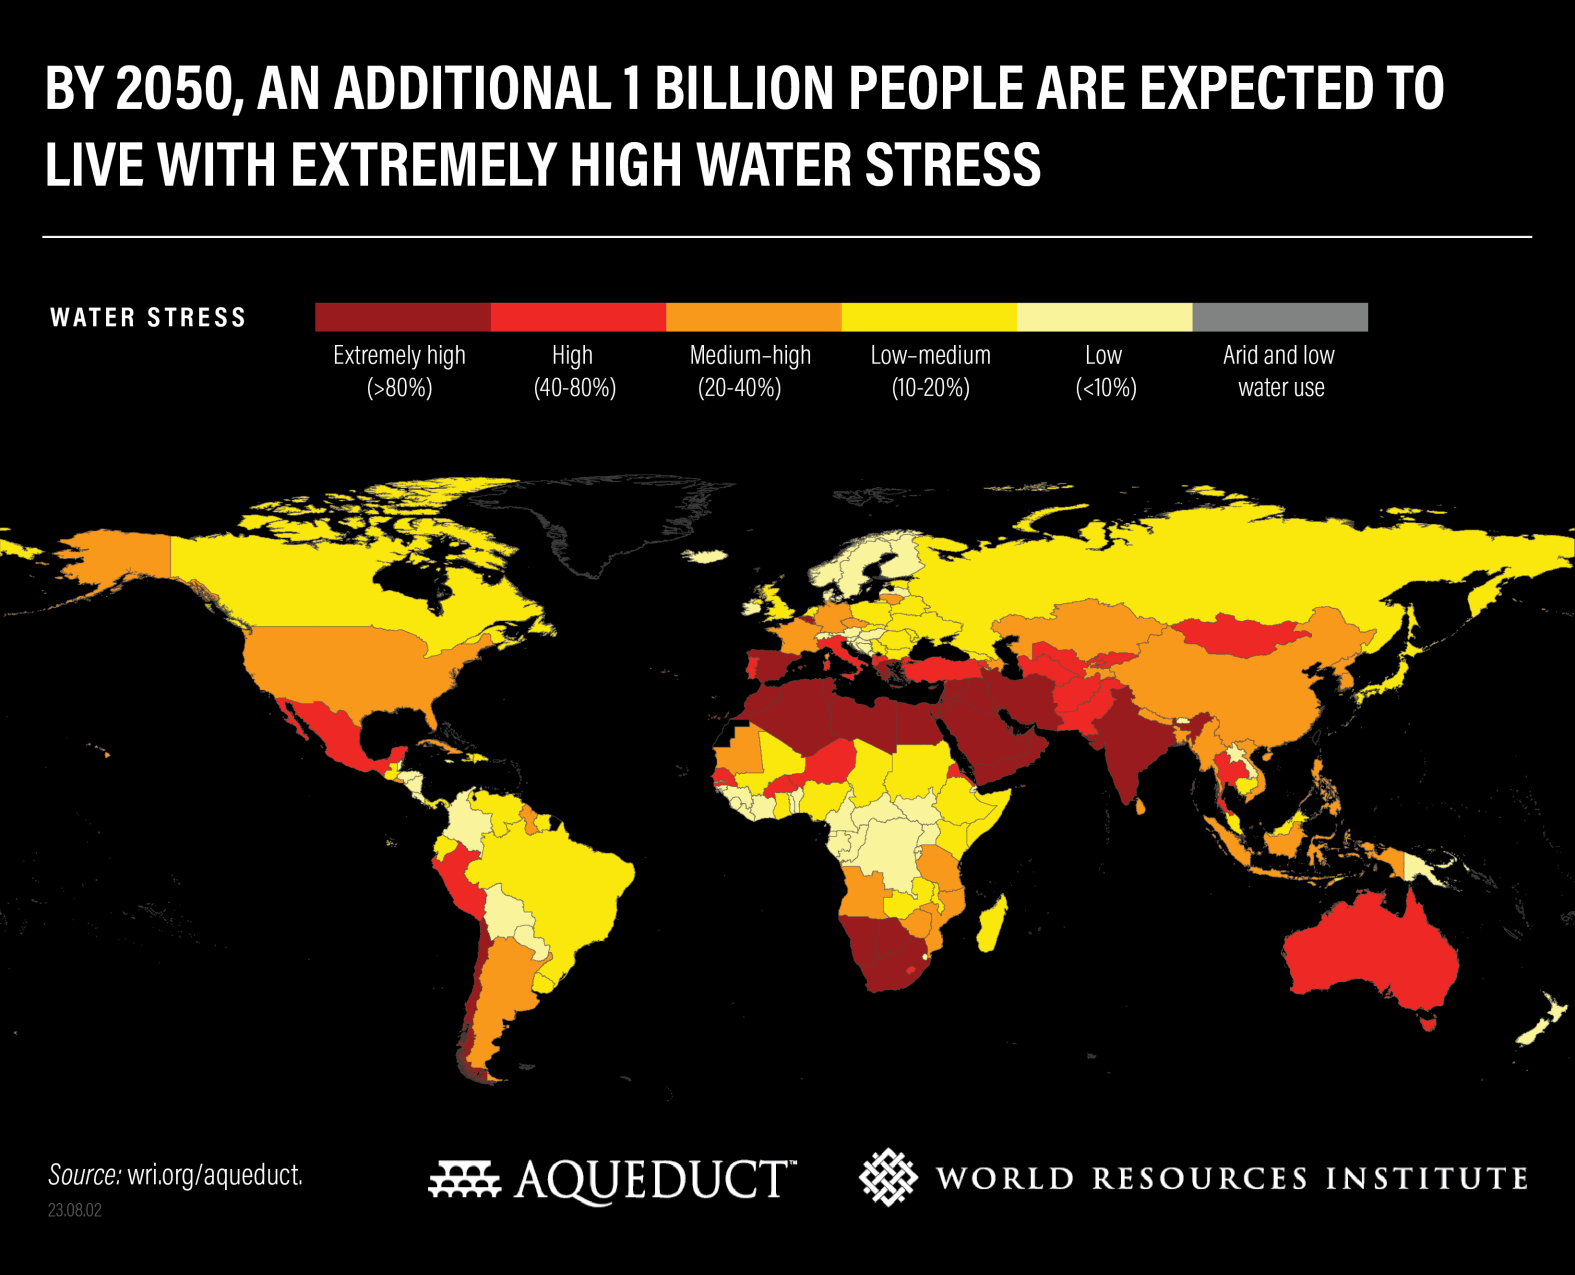
By Samantha Kuzma, Liz Saccoccia, and Marlena Chertock 16 August 2023 (WRI) – New data from WRI’s Aqueduct Water Risk Atlas show that 25 countries — housing one-quarter of the global population — face extremely high water stress each year, regularly using up almost their entire available water supply. And at least 50% of the world’s population […]
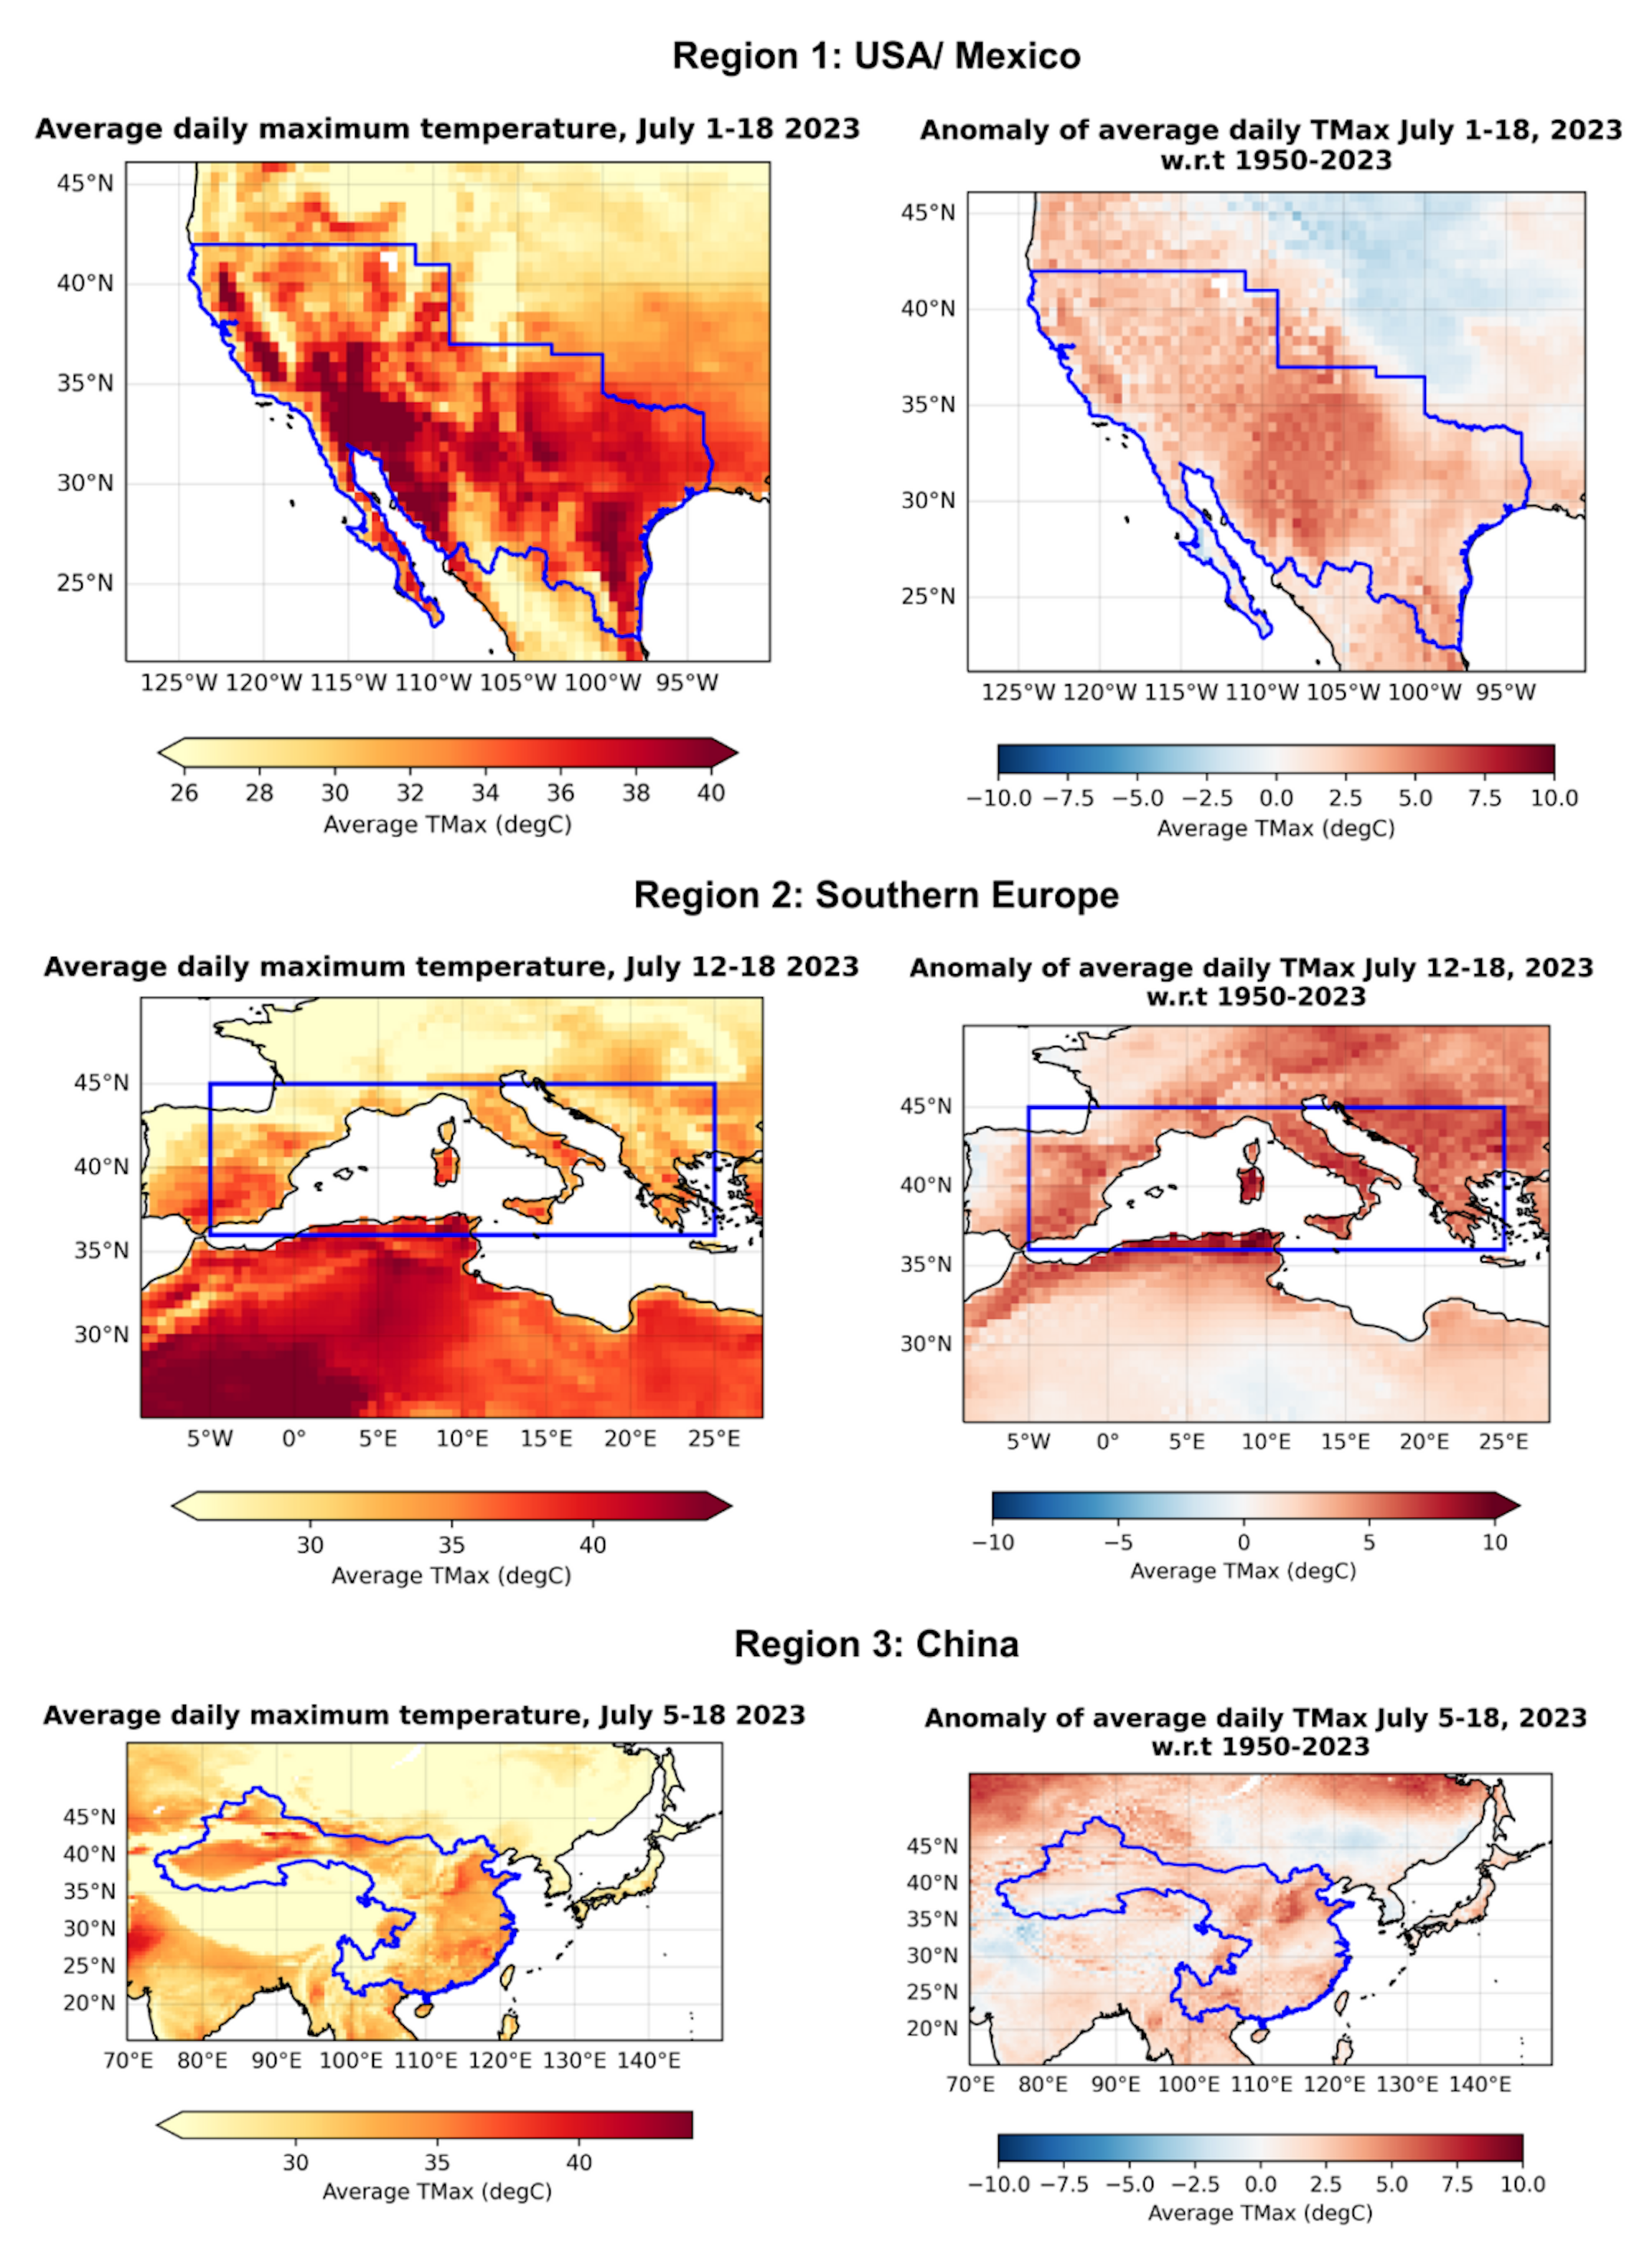
25 July 2023 (World Weather Attribution) – Following a record hot June, large areas of the US and Mexico, Southern Europe and China experienced extreme heat in July 2023, breaking many local high temperature records. July 2023 saw extreme heatwaves in several parts of the Northern Hemisphere, including the Southwest of the US and Mexico, […]
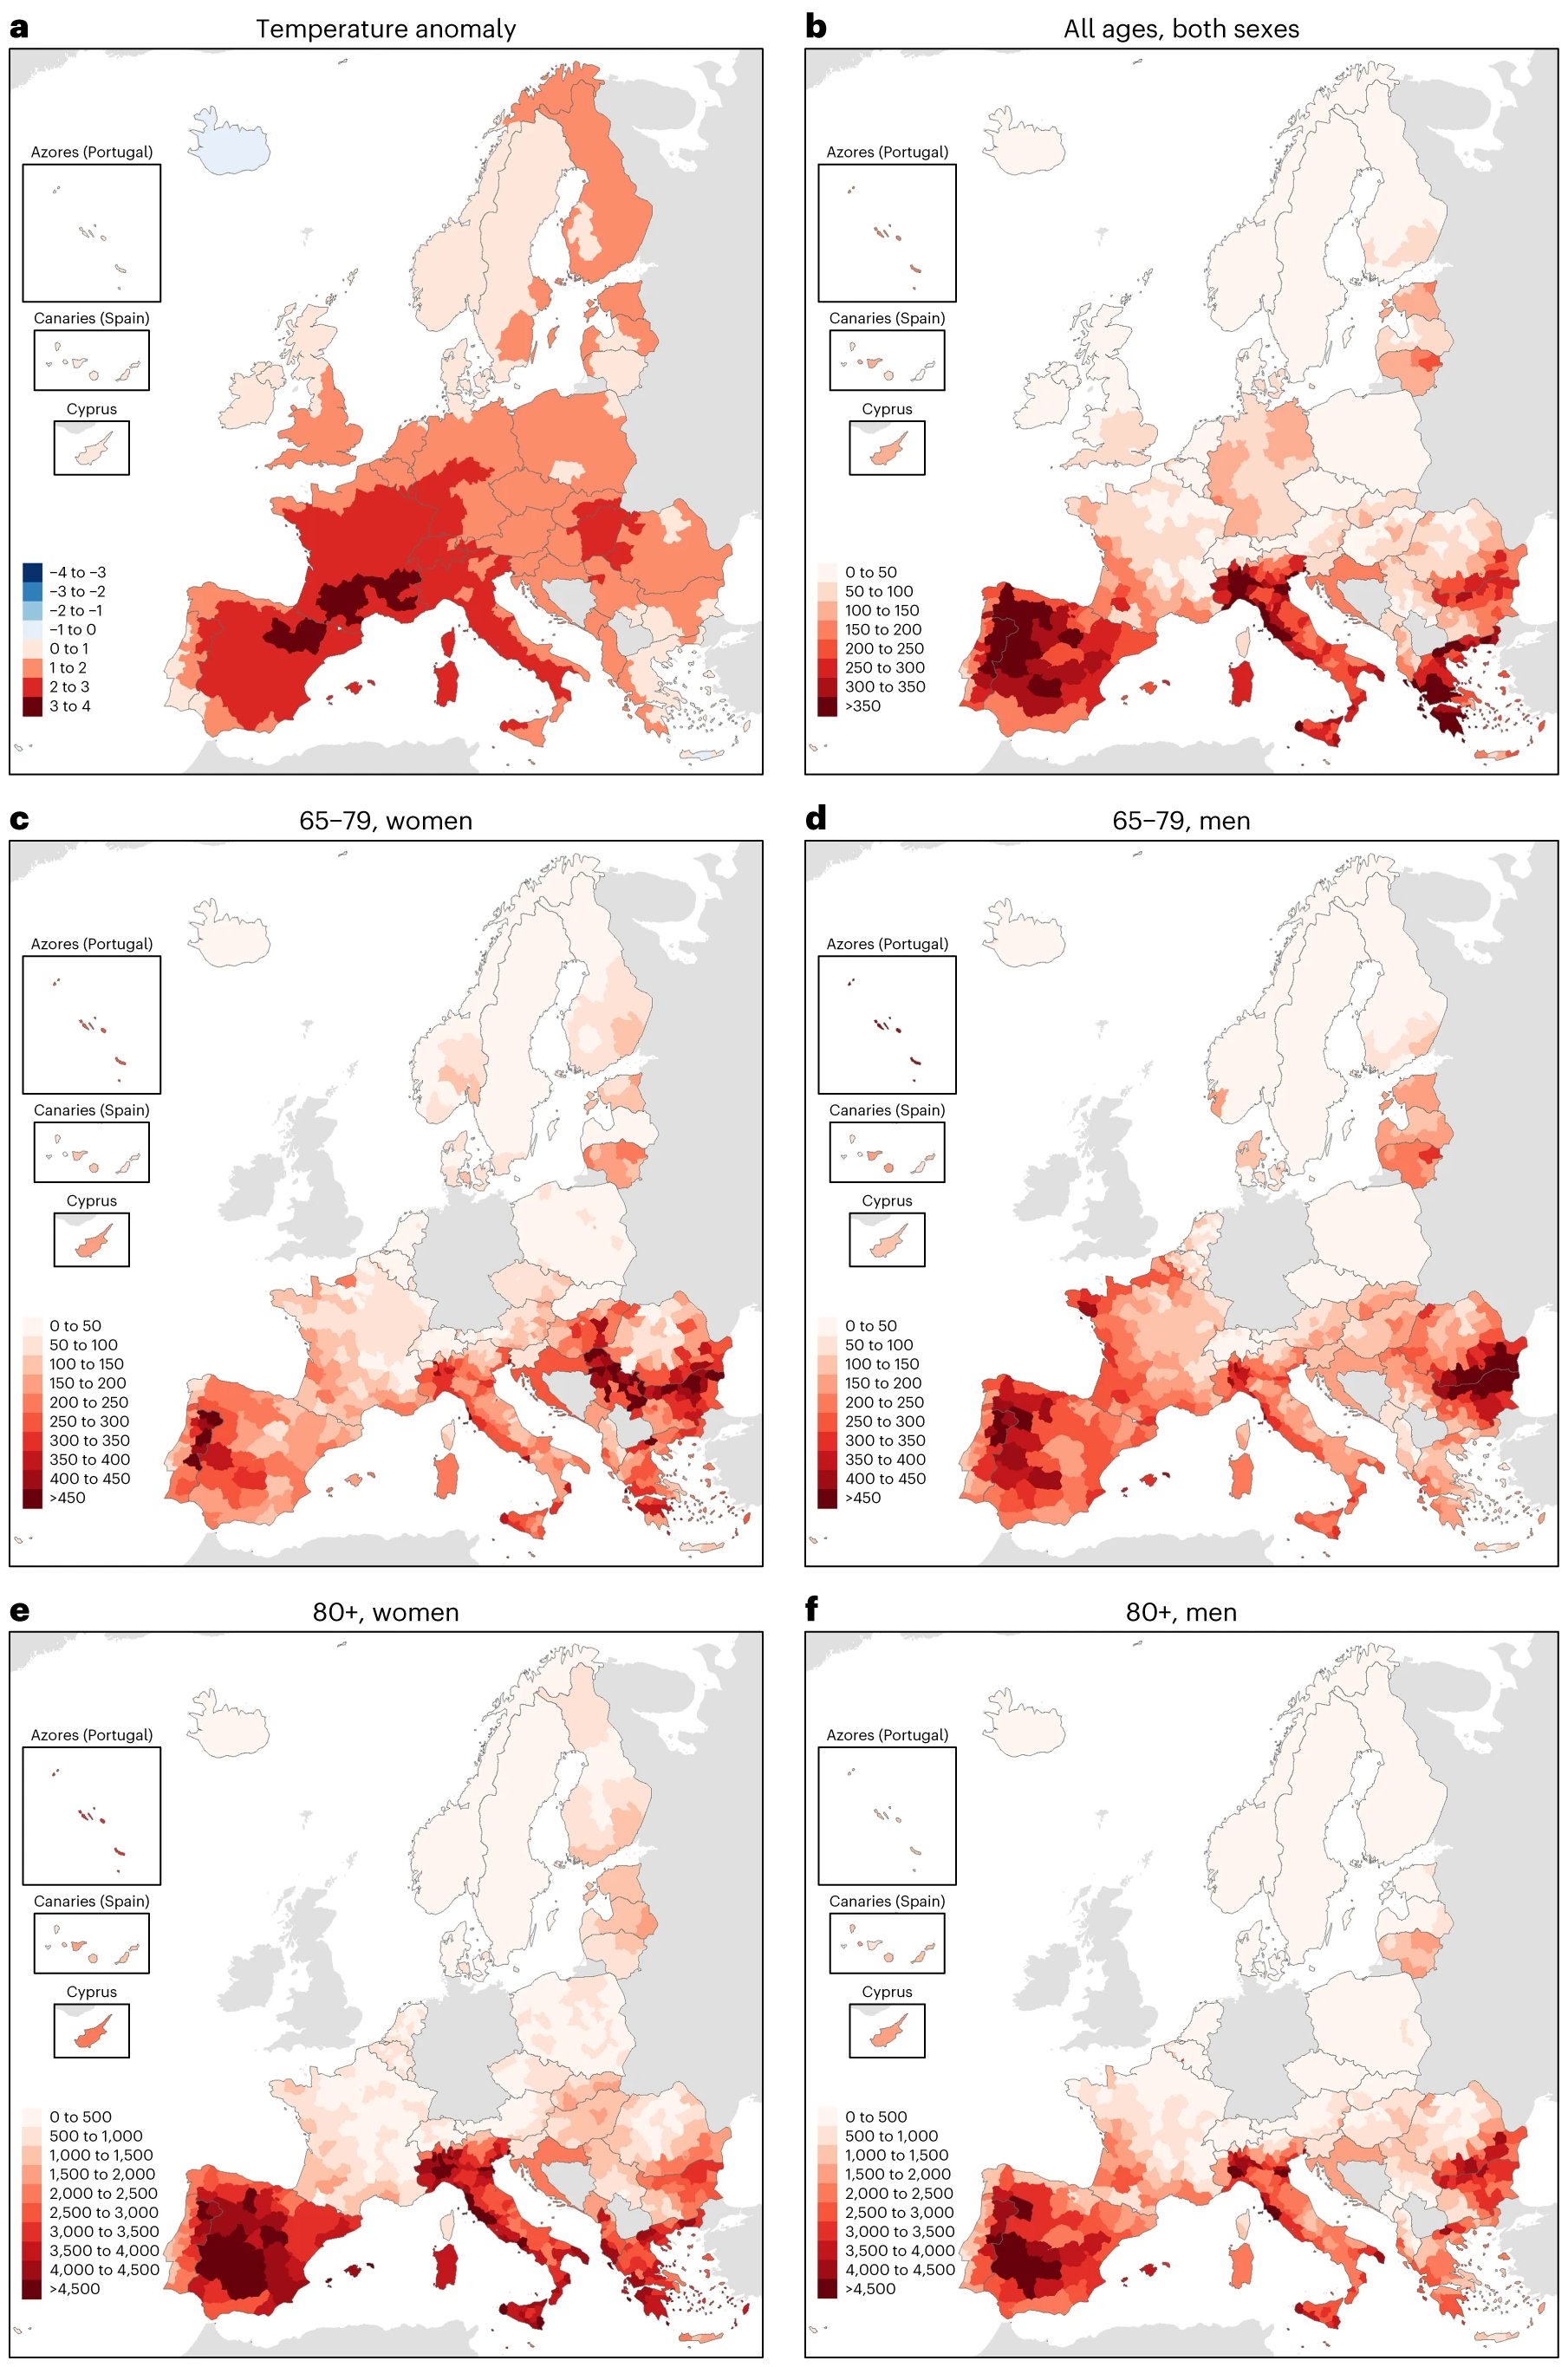
By Alice Park 10 July 2023 (TIME) – As the Earth continues to warm, the rising temperatures are contributing to a number of health conditions that are in turn driving up mortality. And for the first time, scientists have figured out a more detailed way to estimate how many deaths can be attributed to heat. […]
By Olivia Trani 1 June 2023 (VCU) – When it comes to public health, the United States is at a disadvantage compared with other developed countries. Americans experience more illness, have less access to health care and pay more for health services than citizens in other high-income countries. Americans also die earlier – and have been doing so […]
By Pandora Dewan 24 February 2023 (Newsweek) – By 2100, Florida could see sea levels rise by up to 6 feet, with over 900,000 properties at risk of being underwater. “By 2050, Florida sea levels, like much of the US, are headed for a 1-foot rise on average (above 2020 levels),” William Sweet, an Oceanographer for the […]