The first global decline in life expectancy since World War II poses a major threat to the economy
By Matthew Heimer and Nicolas Rapp
6 December 2022
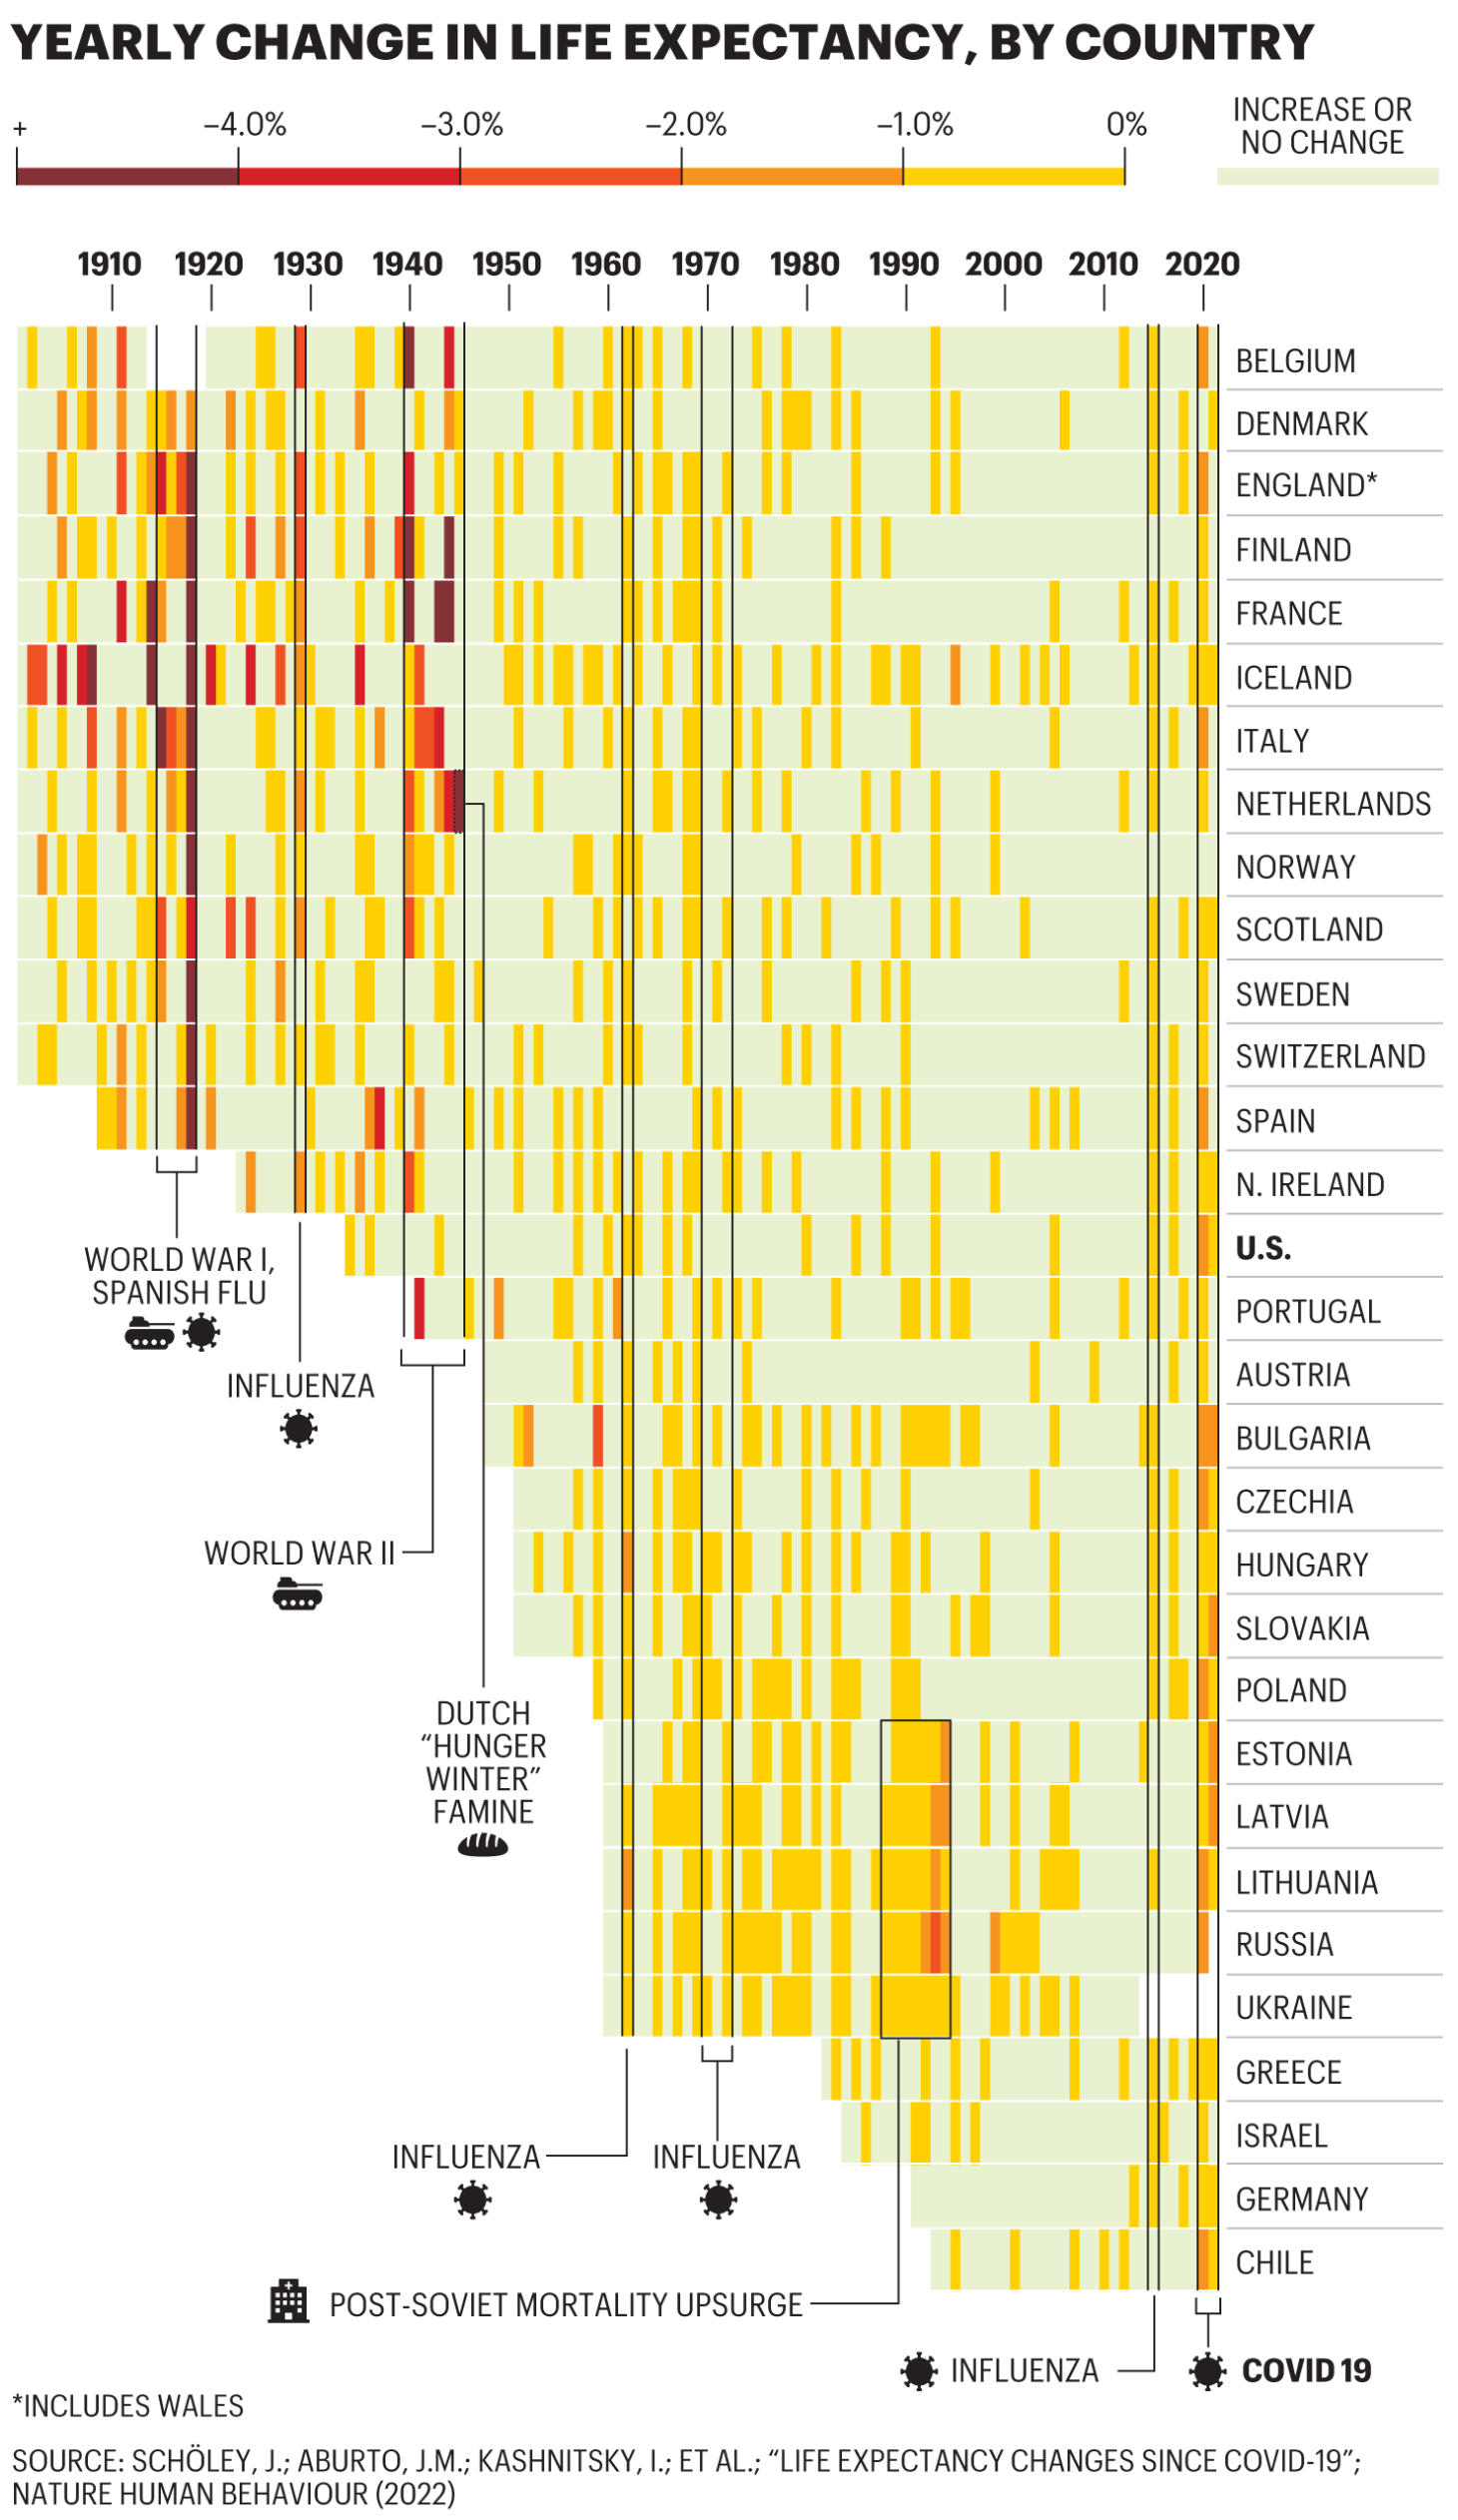
(Fortune) – COVID’s devastation shows up starkly in life expectancy data: The pandemic’s peak marked the first time since World War II that LE (as demographers call it) declined across the globe. The graphic above is based on a data set that focuses mostly on Europe, but similar trends emerged worldwide.
In the U.S., LE fell from 78.8 years in 2019 to 77.3 years in 2020—the biggest peacetime decline on record. LE has fallen particularly sharply among Americans ages 40 to 59, a trend that reflects the opioid and homicide crises as well as COVID. This human tragedy is compounded by an ominous economic dimension.
Shorter life spans may presage slower growth in industries such as health care and financial services that cater to older people. Falling LE can also result in a smaller labor force, which in turn could have dire consequences; tax revenue could dry up, for example, and inflation could worsen if workers are scarce. [more]
Life expectancy changes since COVID-19
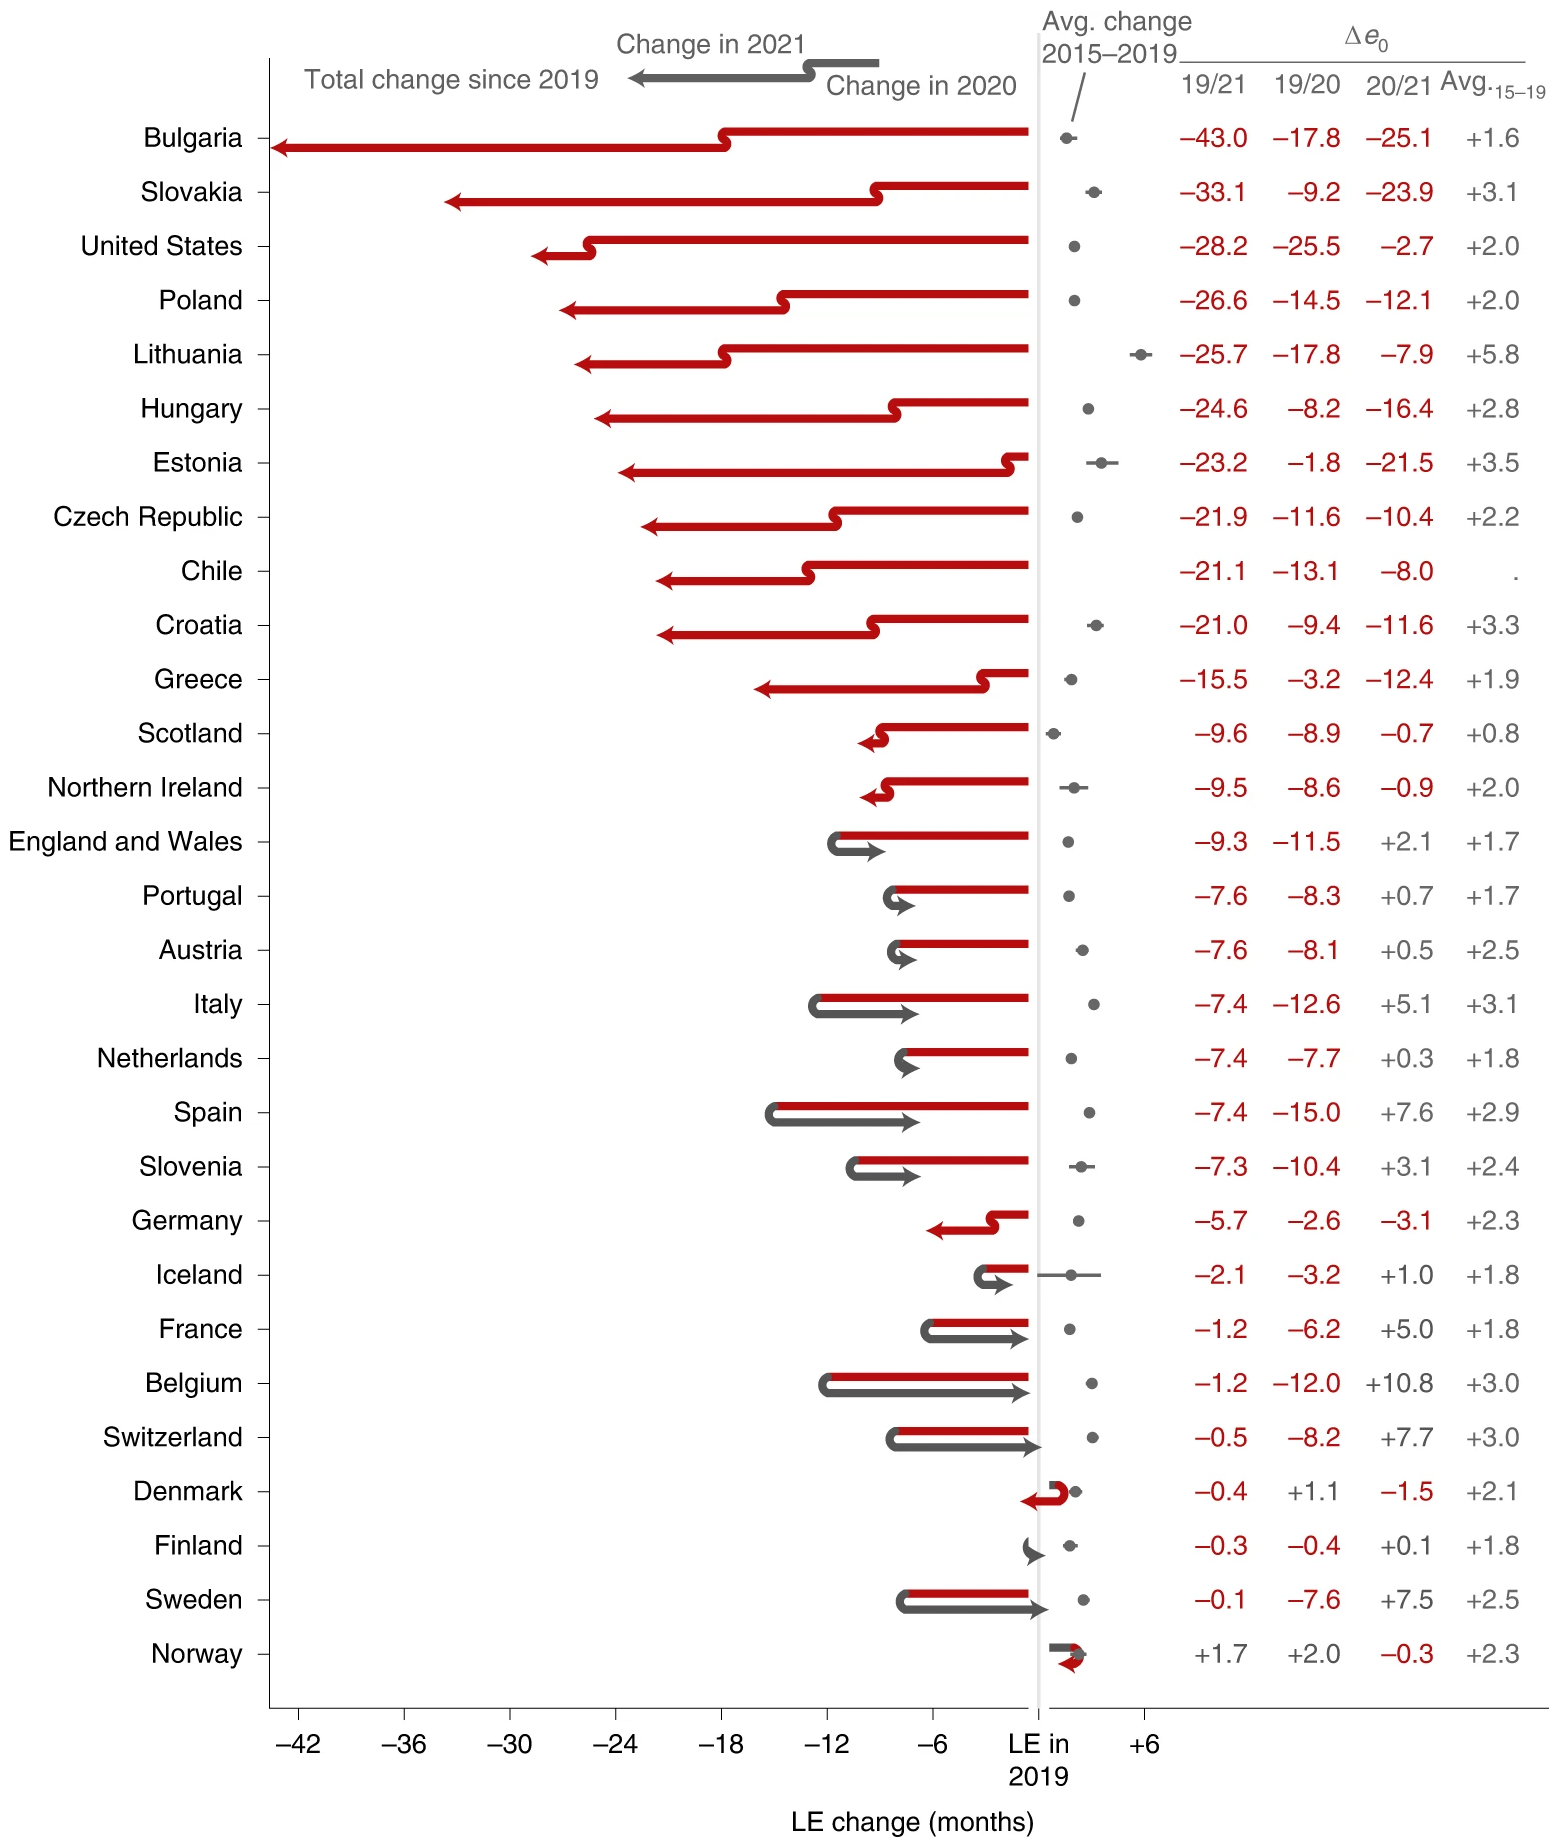
ABSTRACT: The COVID-19 pandemic triggered an unprecedented rise in mortality that translated into life expectancy losses around the world, with only a few exceptions. We estimate life expectancy changes in 29 countries since 2020 (including most of Europe, the United States and Chile), attribute them to mortality changes by age group and compare them with historic life expectancy shocks. Our results show divergence in mortality impacts of the pandemic in 2021. While countries in western Europe experienced bounce backs from life expectancy losses of 2020, eastern Europe and the United States witnessed sustained and substantial life expectancy deficits. Life expectancy deficits during fall/winter 2021 among people ages 60+ and <60 were negatively correlated with measures of vaccination uptake across countries (r60+ = −0.86; two-tailed P < 0.001; 95% confidence interval, −0.94 to −0.69; r<60 = −0.74; two-tailed P < 0.001; 95% confidence interval, −0.88 to −0.46). In contrast to 2020, the age profile of excess mortality in 2021 was younger, with those in under-80 age groups contributing more to life expectancy losses. However, even in 2021, registered COVID-19 deaths continued to account for most life expectancy losses.