Twenty-first century groundwater-level trends in globally distributed monitoring wells. Each point represents one monitoring well, coloured to represent the Theil–Sen trend of annual median groundwater levels during the twenty-first century. Blue and red points indicate shallowing and deepening, respectively, of groundwater levels over time, with darker colours indicating faster rates. a, Spatial distributions of groundwater-level trends in globally distributed monitoring wells. b–o, Regional maps illustrating the substantial spatial variability in groundwater-level trends. Supplementary Notes 16 and 17 show monitoring wells and their groundwater-level trends at subcontinental scales (Supplementary Note 16) and in 207 individual aquifer systems. Graphic: Jasechko, et al., 2024 / Nature

Groundwater resources are drying up across the globe – “Climate variability and change can impact water supplies underground as well as above-ground”

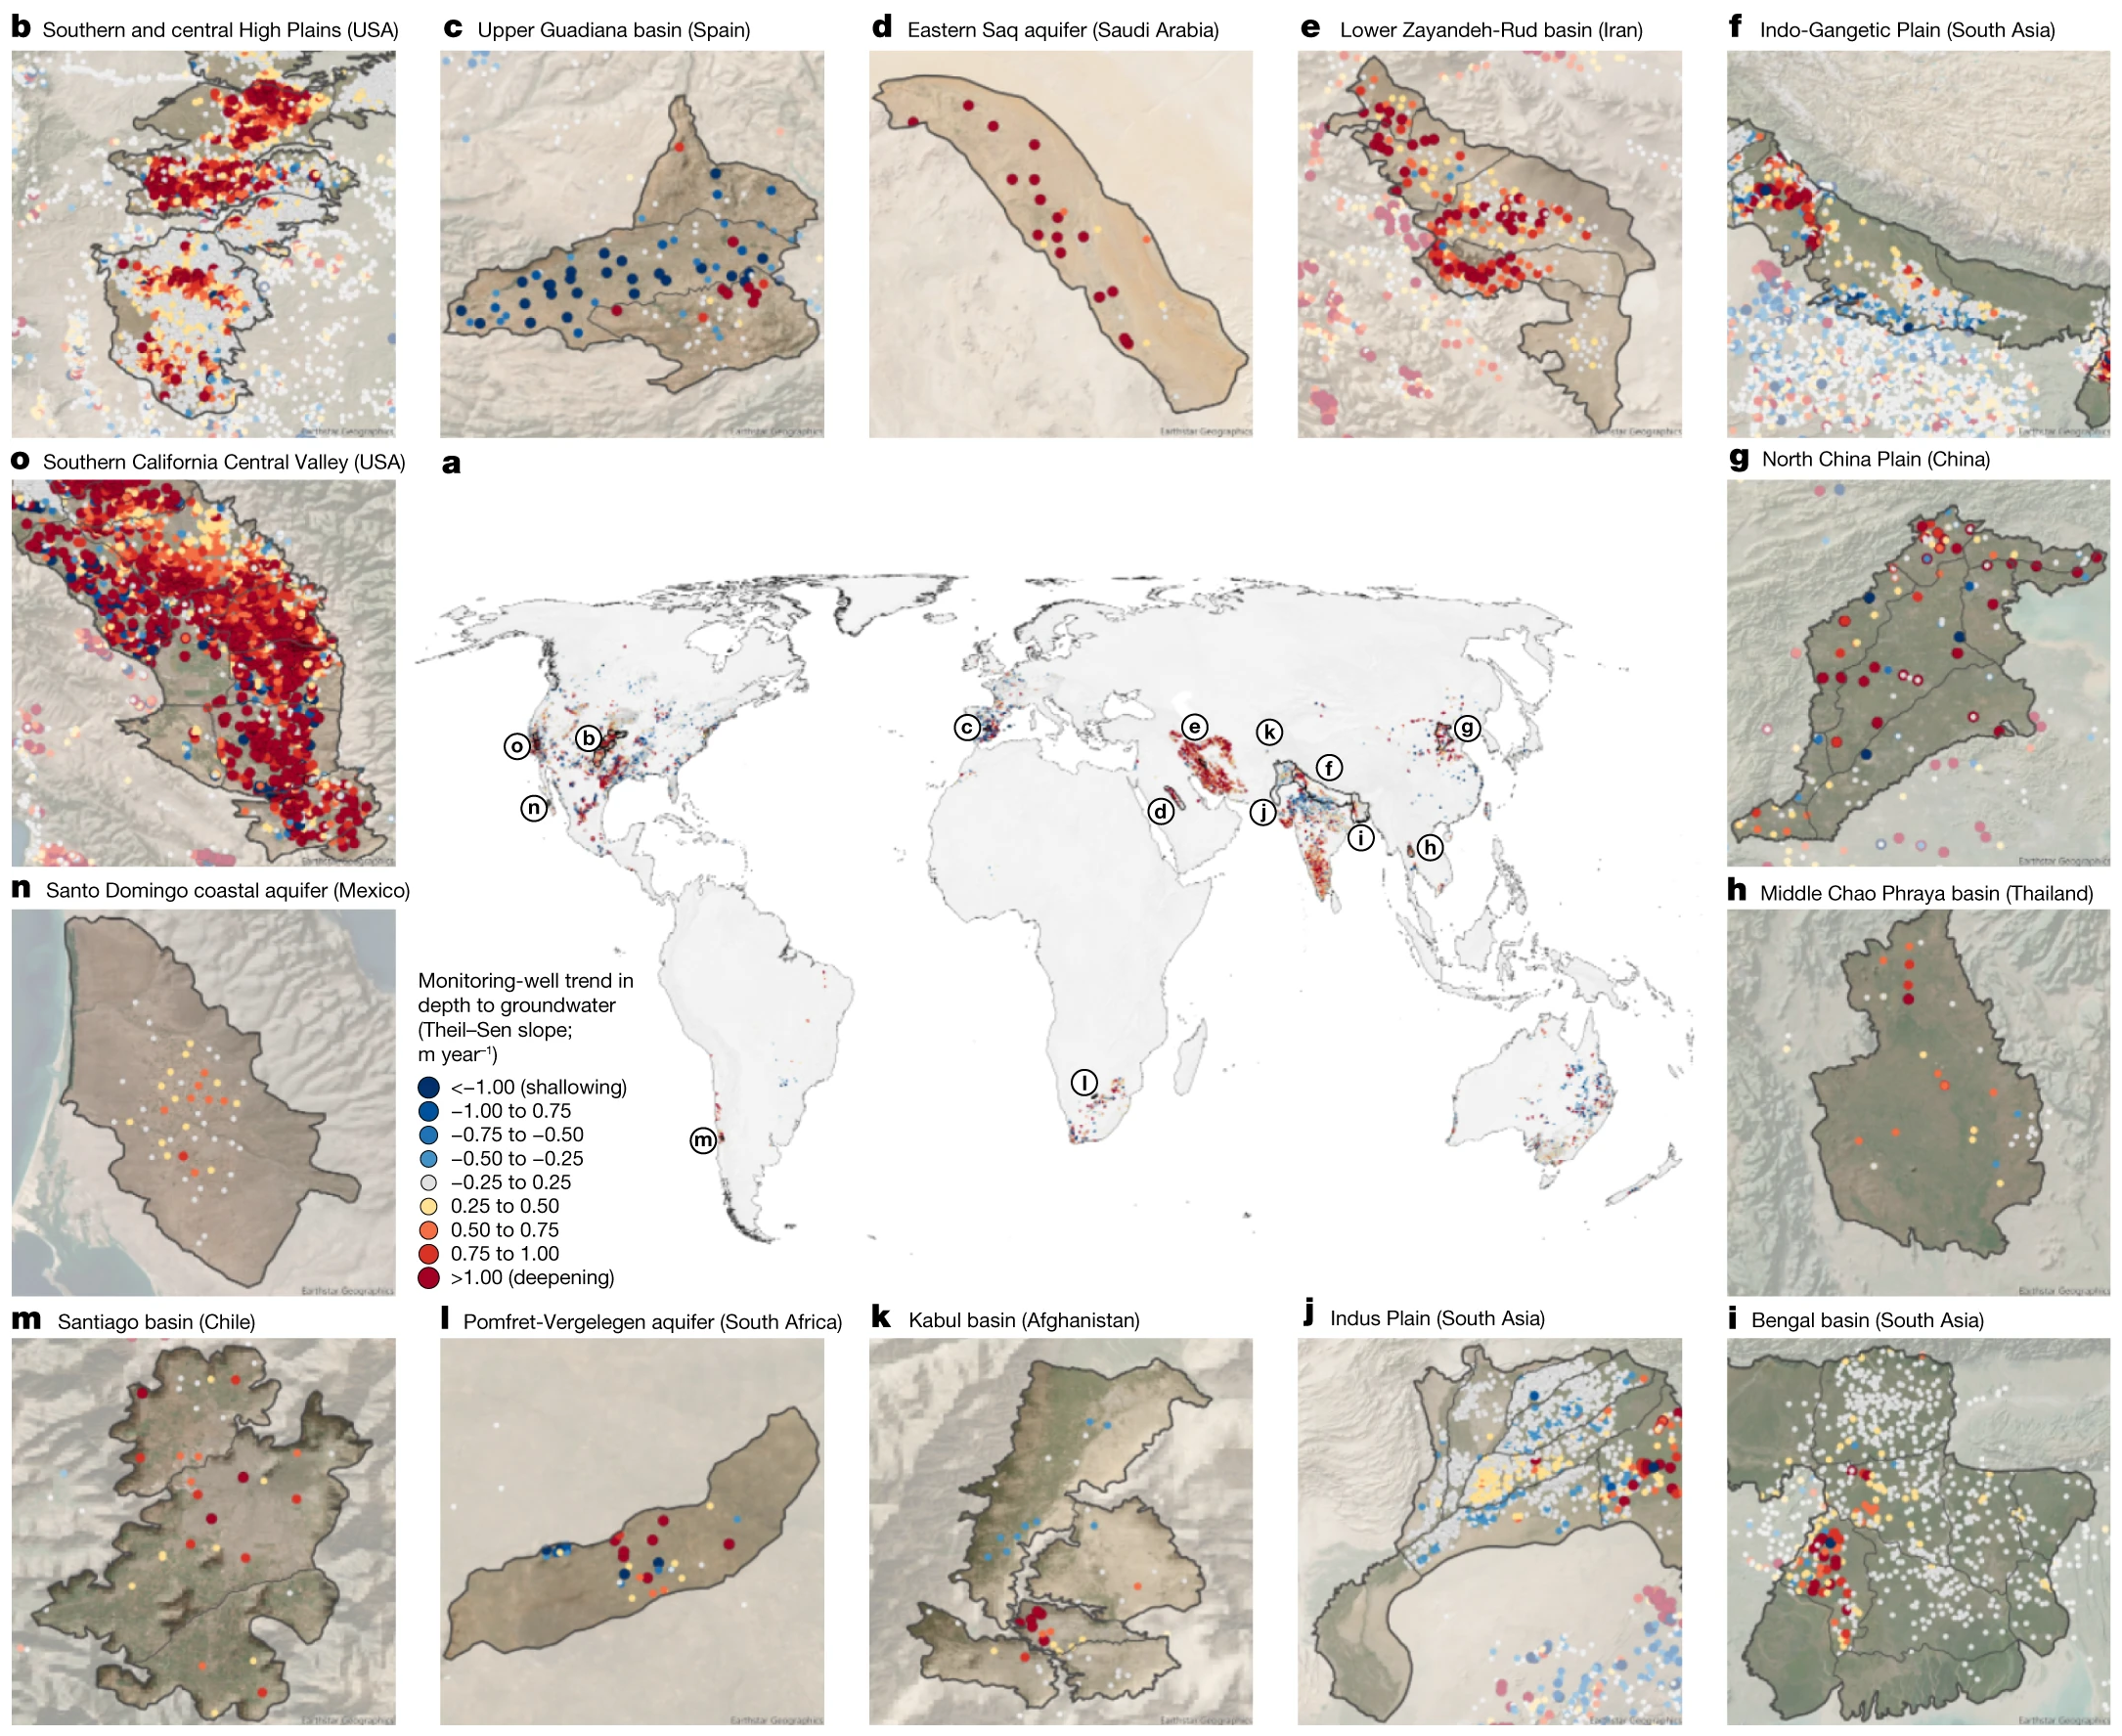
By Matthew Rozsa 24 January 2024 (Salon) – Humans rely on groundwater for many things, but especially our food. Roughly 30 percent of all the planet’s available freshwater comes from groundwater, or water that is found underground in the spaces between rocks, soil and sand. It is primarily used for agriculture and billions of humans are dependent […]

Percentage of documented and undocumented mines, by country. More than half of the global mining areas (56 percent) visible from satellite images have no production information available listed in a global compilation from the S&P Capital IQ Pro database. The total worldwide mining land use for mining in 120,000 km2, with 67,000 km2 undocumented. Graphic: Nature

Impacts for half of the world’s mining areas are undocumented – 56 percent of global mining areas visible from satellite images have no production information available

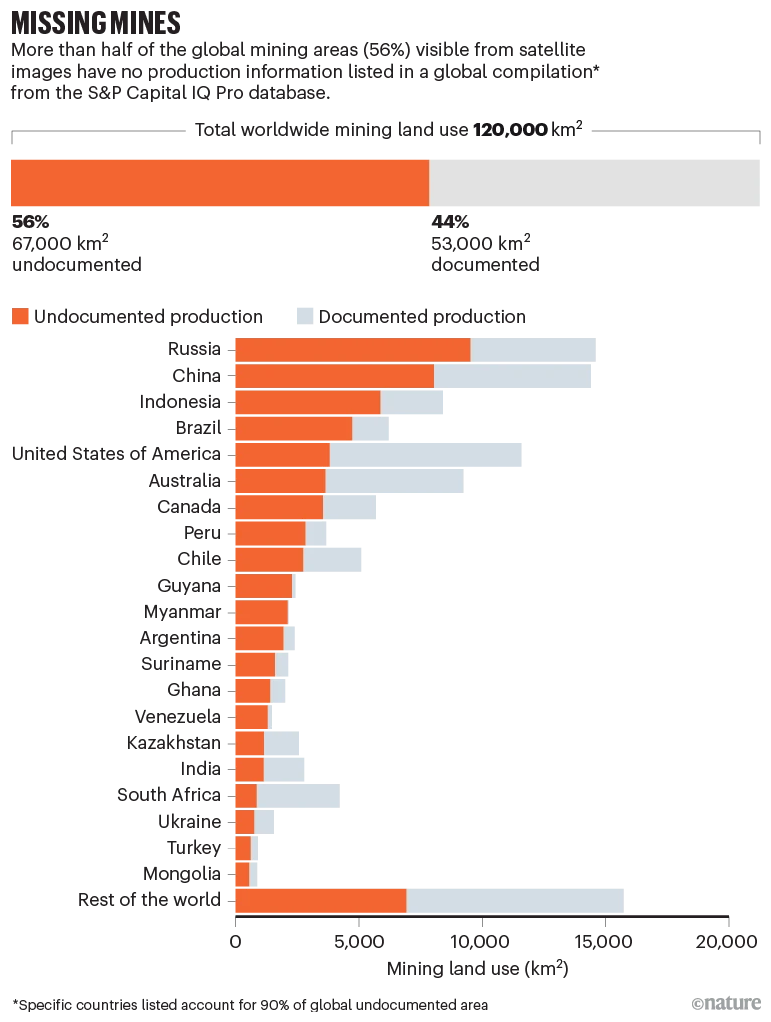
By Victor Maus and Tim T. Werner 3 January 2024 (Nature) – Mining is a crucial industry — from iron and copper to gravel and sand, we depend on it for the basic building blocks of the modern world. It is a fast changing sector, as the clean energy transition and digitalization boost demand for […]

The Norwegian Aker BioMarine’s Antarctic Sea trawls for krill in the Southern Ocean off the coast of the South Orkney Islands, north of the Antarctic Peninsula, on 10 March 2023. Photo: AP Photo / David Keyton

Factory fishing in Antarctica for krill targets the cornerstone of a fragile ecosystem – “What’s coming out of the side are the remnants of the ecosystem”

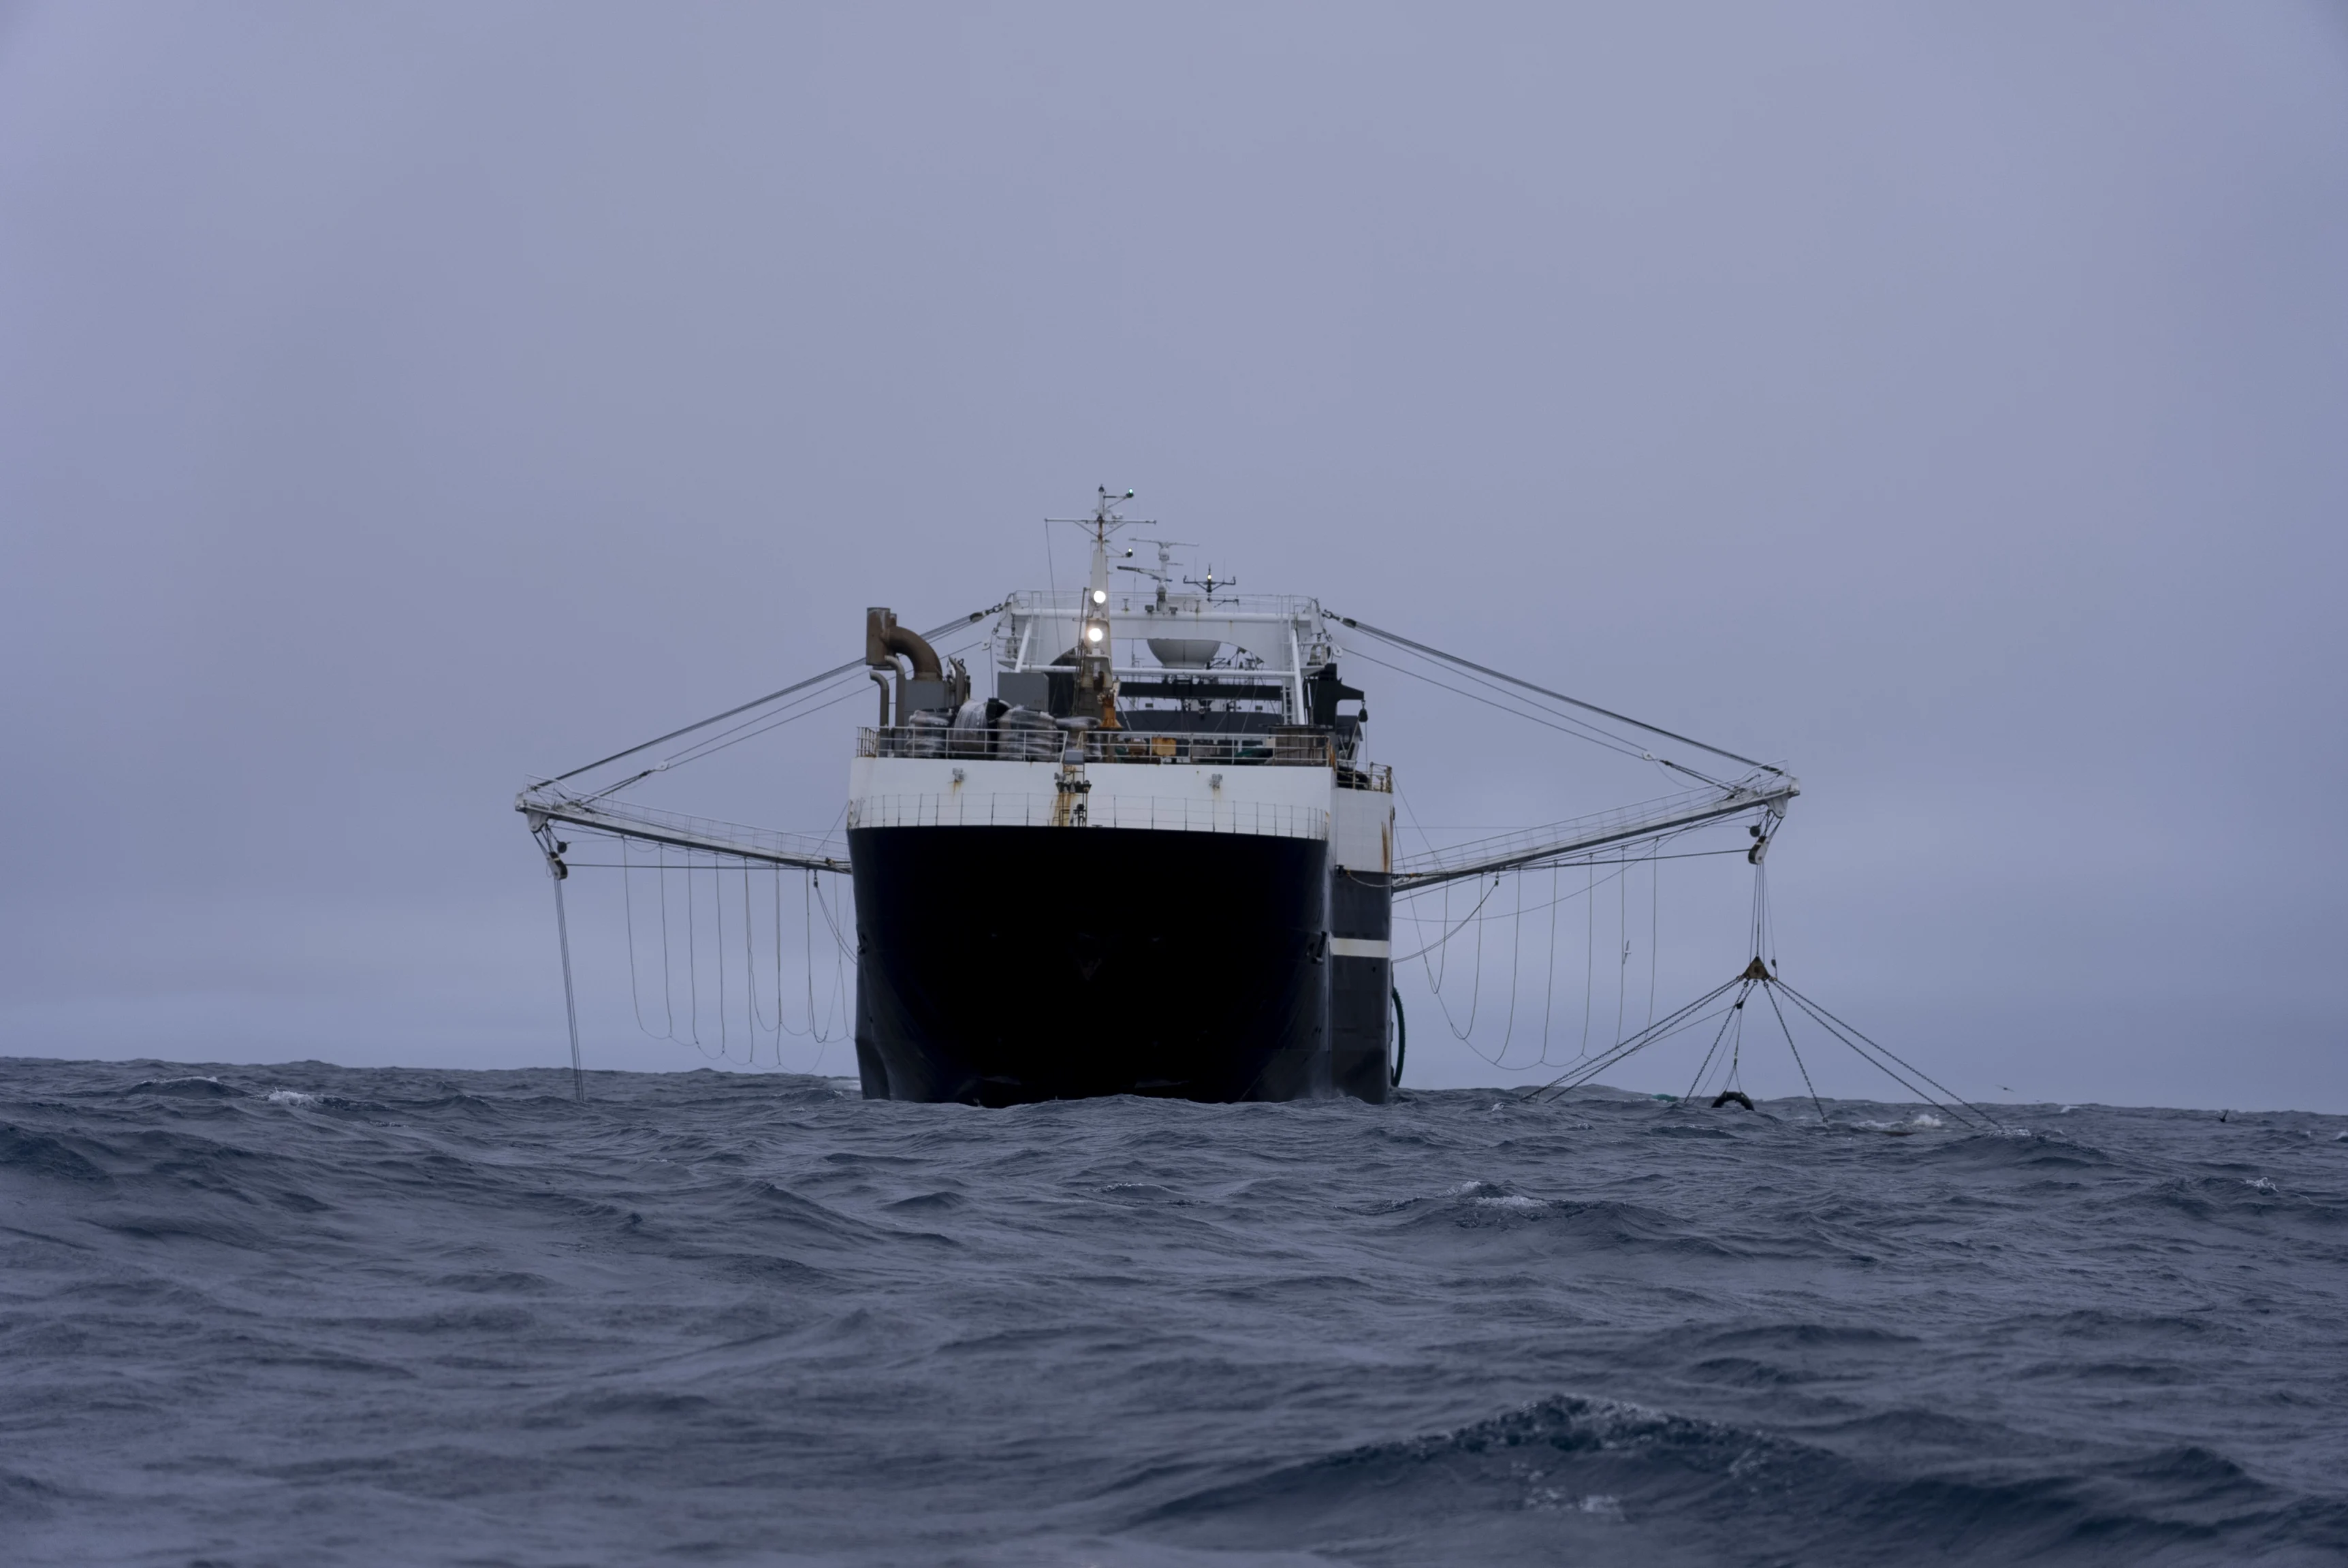
By Joshua Goodman and David Keyton 13 October 2023 (AP) – The Antarctic Endeavour glides across the water’s silky surface as dozens of fin whales spray rainbows from their blowholes into a fairy tale icescape of massive glaciers. But as a patrol of environmentalists approaches the Chilean super trawler in an inflatable boat, the cruder […]

This map shows global temperature anomalies for July 2023 according to the GISTEMP analysis by scientists at NASA’s Goddard Institute for Space Studies. Temperature anomalies reflect how July 2023 compared to the average July temperature from 1951-1980. Graphic: NASA’s Goddard Institute for Space Studies

NASA announces July 2023 was hottest month on record – “The science is clear this isn’t normal”

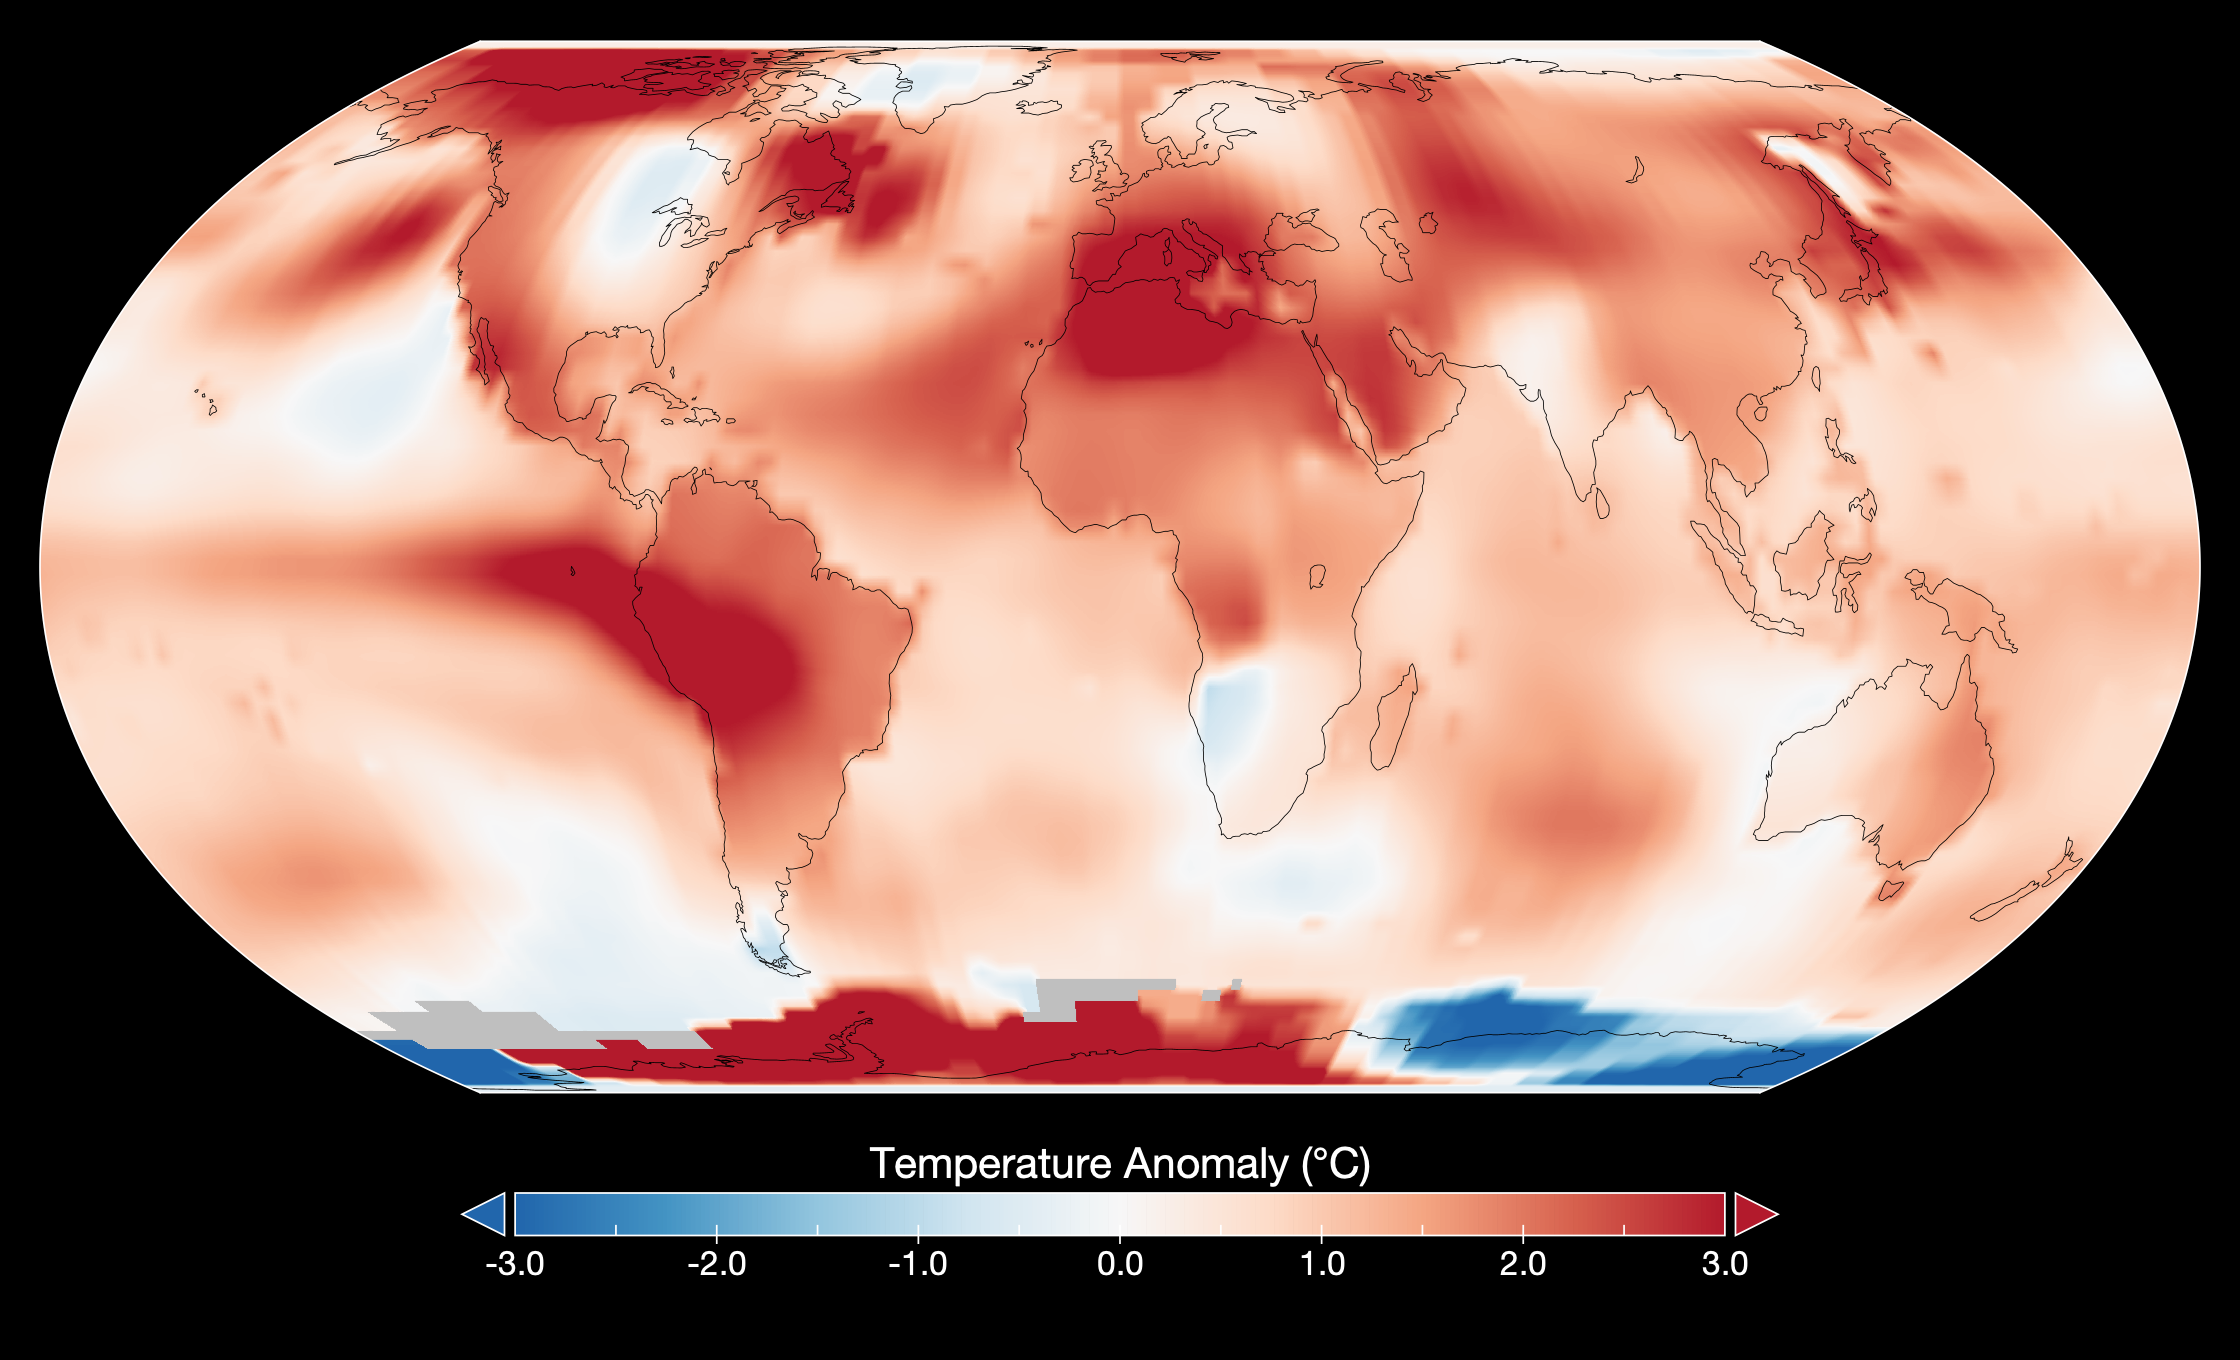
By Sheri Walsh 14 August 2023 (UPI) – July 2023 was the hottest month on record in 143 years, as Americans felt “the effects of the climate crisis,” scientists at NASA’s Goddard Institute for Space Studies in New York announced Monday. According to NASA, July 2023 was on average 0.43 degrees Fahrenheit warmer than any […]

Map showing global water stress projected to 2050. By 2050, an additional 1 billion people are expected to live with extremely high water stress, even if the world limits global temperature rise to 1.3 degrees C to 2.4 degrees C (2.3 degrees F to 4.3 degrees F) by 2100, an optimistic scenario. Global water demand is projected to increase by 20 percent to 25 percent by 2050, while the number of watersheds facing high year-to-year variability, or less predictable water supplies, is expected to increase by 19 percent. Data: wri.org/aqueduct. Graphic: WRI

25 countries, housing one-quarter of the population, face extremely high water stress – By 2050, an additional 1 billion people will live with extremely high water stress

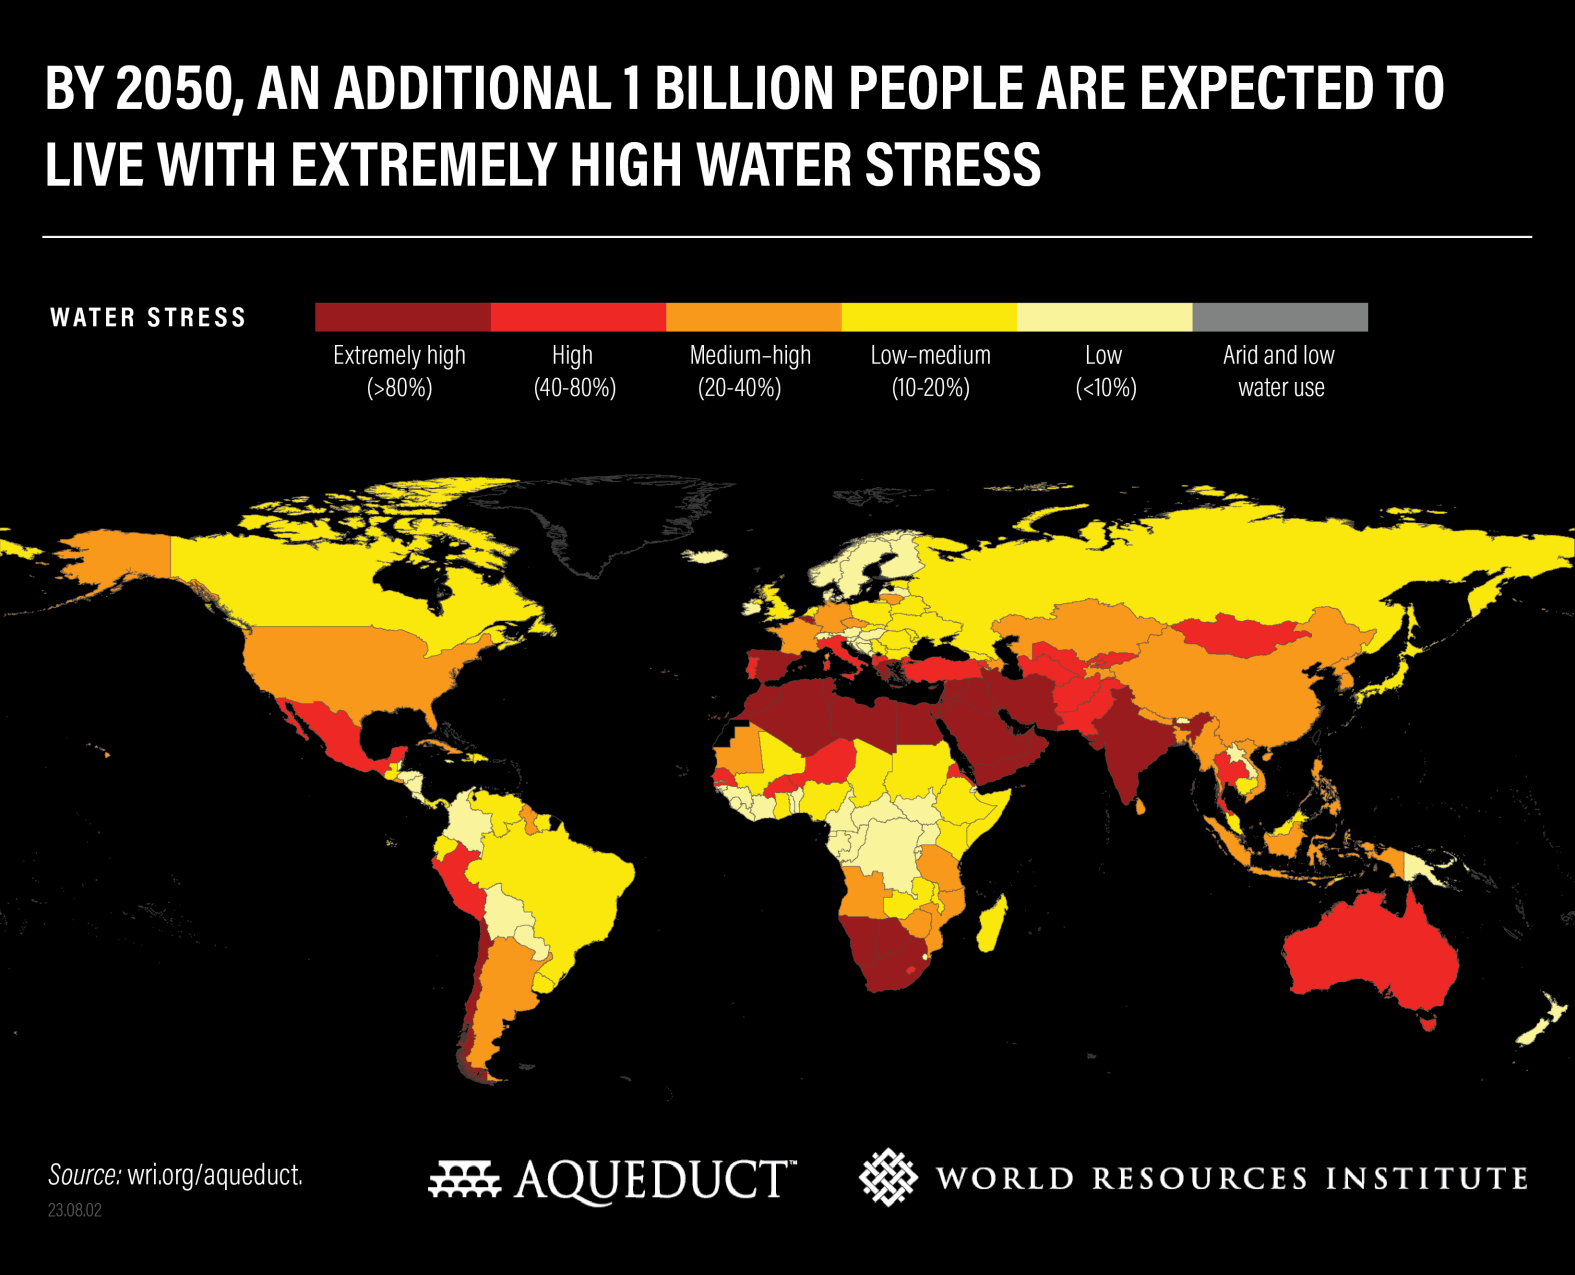
By Samantha Kuzma, Liz Saccoccia, and Marlena Chertock 16 August 2023 (WRI) – New data from WRI’s Aqueduct Water Risk Atlas show that 25 countries — housing one-quarter of the global population — face extremely high water stress each year, regularly using up almost their entire available water supply. And at least 50% of the world’s population […]

Map of surface temperature in South America on 1 August 2023. The winter of 2023 in South America saw temperatures as high as 38.9°C in the Chilean Andes, much higher than what Southern Europe had in mid-summer at the same elevation. Graphic: MetDesk / WXCharts.com

“Pushing temperatures into the unknown”: South America swelters under “fierce” heatwave in the middle of winter 2023 – “This temperature is the highest recorded in this period in all of Chile”

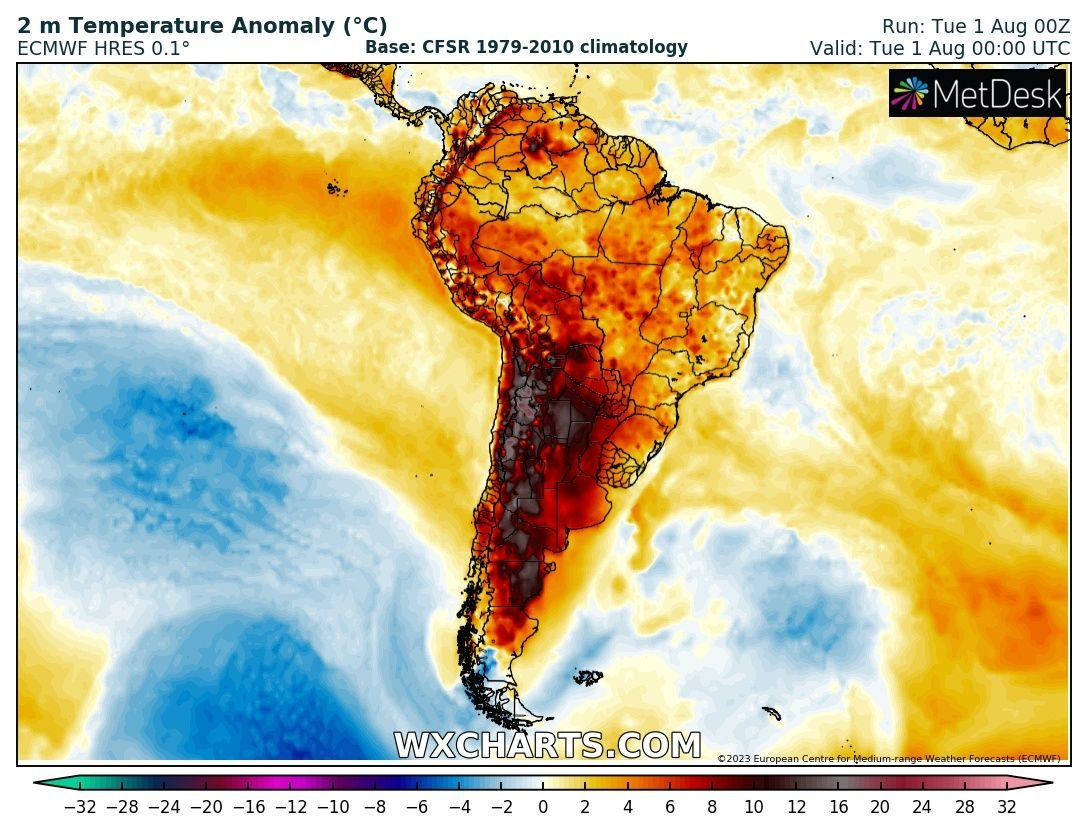
By Sophie Tanno 4 August 2023 (CNN) – Parts of South America are sweltering under abnormally hot temperatures – despite being in the depths of winter – as the combination of human-caused climate change and the arrival of El Niño feed into extreme winter heat. Southern Cone countries including Chile and Argentina have experienced summer-like […]

A satellite image shows a huge clothing dump in the Atacama Desert in Chile. The discarded clothes are located near the municipality of Alto Hospicio in the north of the country. Photo: SkyFi

Vast pile of discarded clothes in desert is so big it’s visible from space

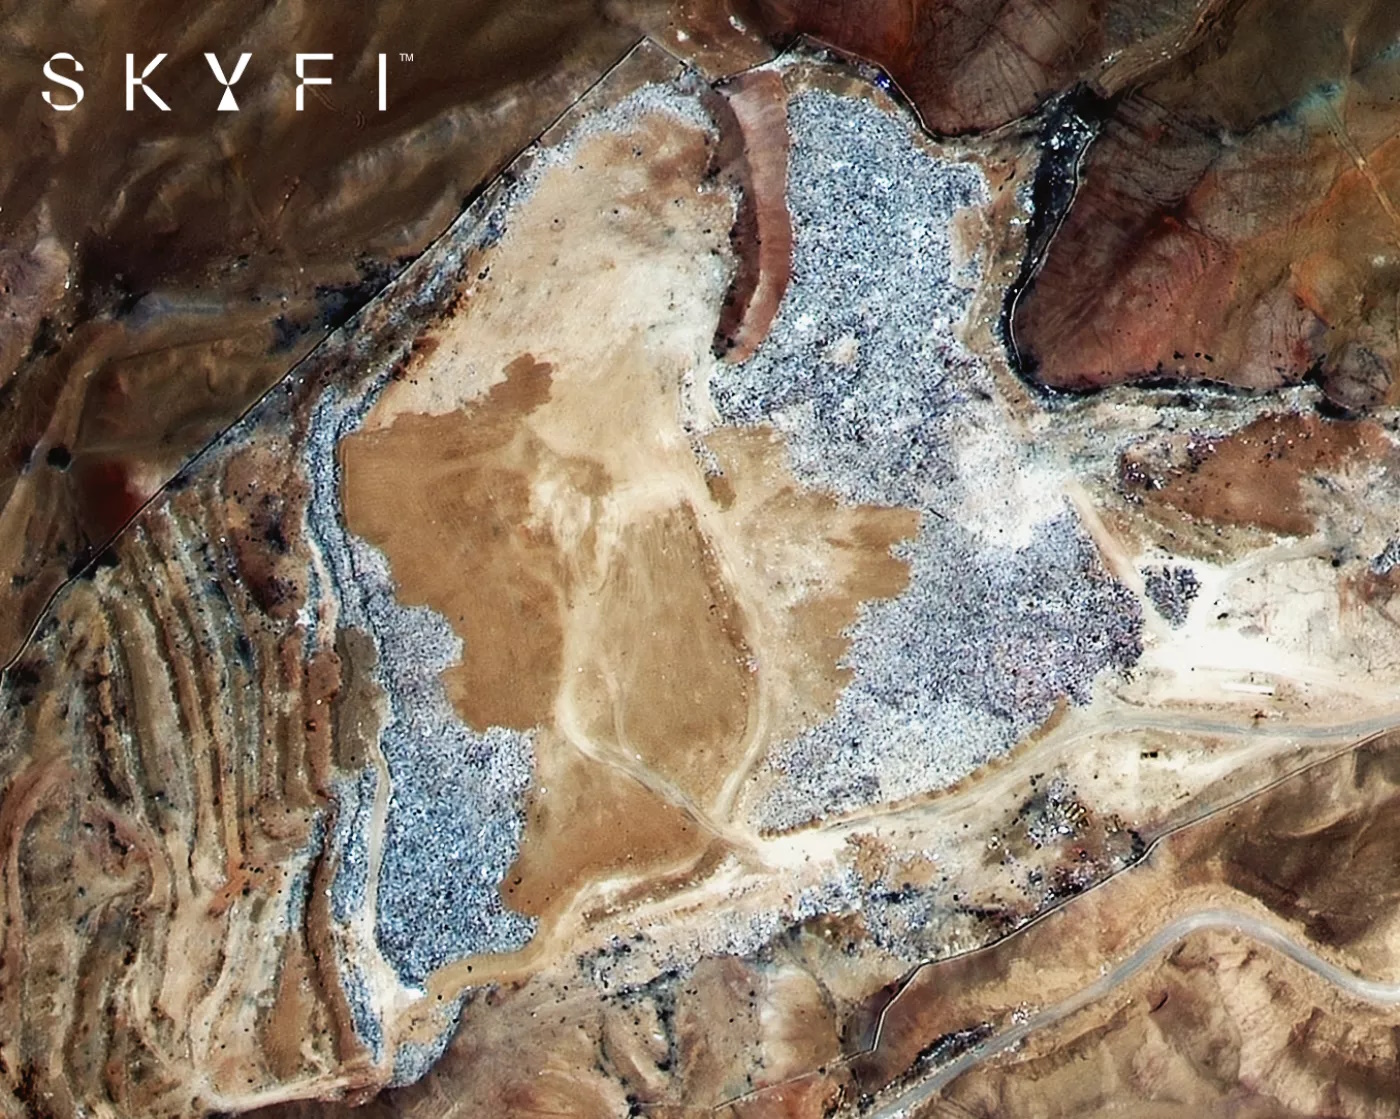
By Aristos Georgiou 22 May 2023 (Newsweek) – A satellite image has revealed an enormous pile of discarded clothing that is so big it’s visible from space. The clothing pile, which contains everything from Christmas sweaters to ski boots, is located in the Atacama Desert—the driest non-polar desert in the world—near the municipality of Alto […]

EIU Democracy Index 2022, global map by regime type. The average global index score stagnated in 2022. Despite expectations of a rebound after the lifting of pandemic-related restrictions, the score was almost unchanged, at 5.29 (on a 0-10 scale), compared with 5.28 in 2021. The positive effect of the restoration of individual freedoms was cancelled out by negative developments globally. The scores of more than half of the countries measured by the index either stagnated or declined. Western Europe was a positive outlier, being the only region whose score returned to pre-pandemic levels. Graphic: EIU

EIU Democracy Index 2022: Frontline democracy and the battle for Ukraine – “Overall the story is one of stagnation. This is a dismal result given that in 2022 the world started to move on from the pandemic-related suppression of individual liberties that persisted through 2020 and 2021”

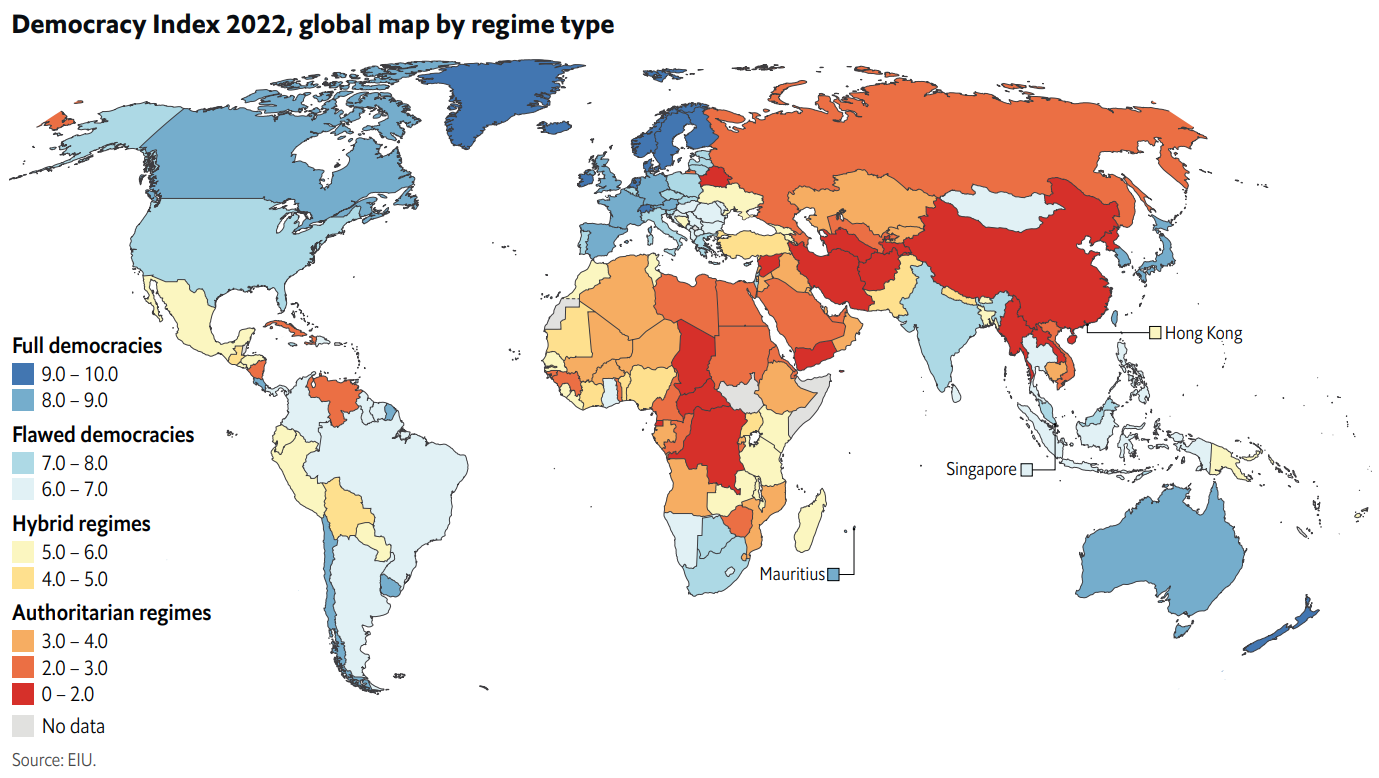
1 February 2023 (EIU) – The Democracy Index, which began in 2006, provides a snapshot of the state of democracy worldwide in 165 independent states and two territories. This covers almost the entire population of the world and the vast majority of the world’s states (microstates are excluded). The Democracy Index is based on five […]

Yearly change in life expectancy in the U.S. and 30 other countries, 1901-2022. Data: Schöley, et al., 2022. Graphic: Fortune

The first global decline in life expectancy since World War II poses a major threat to the economy

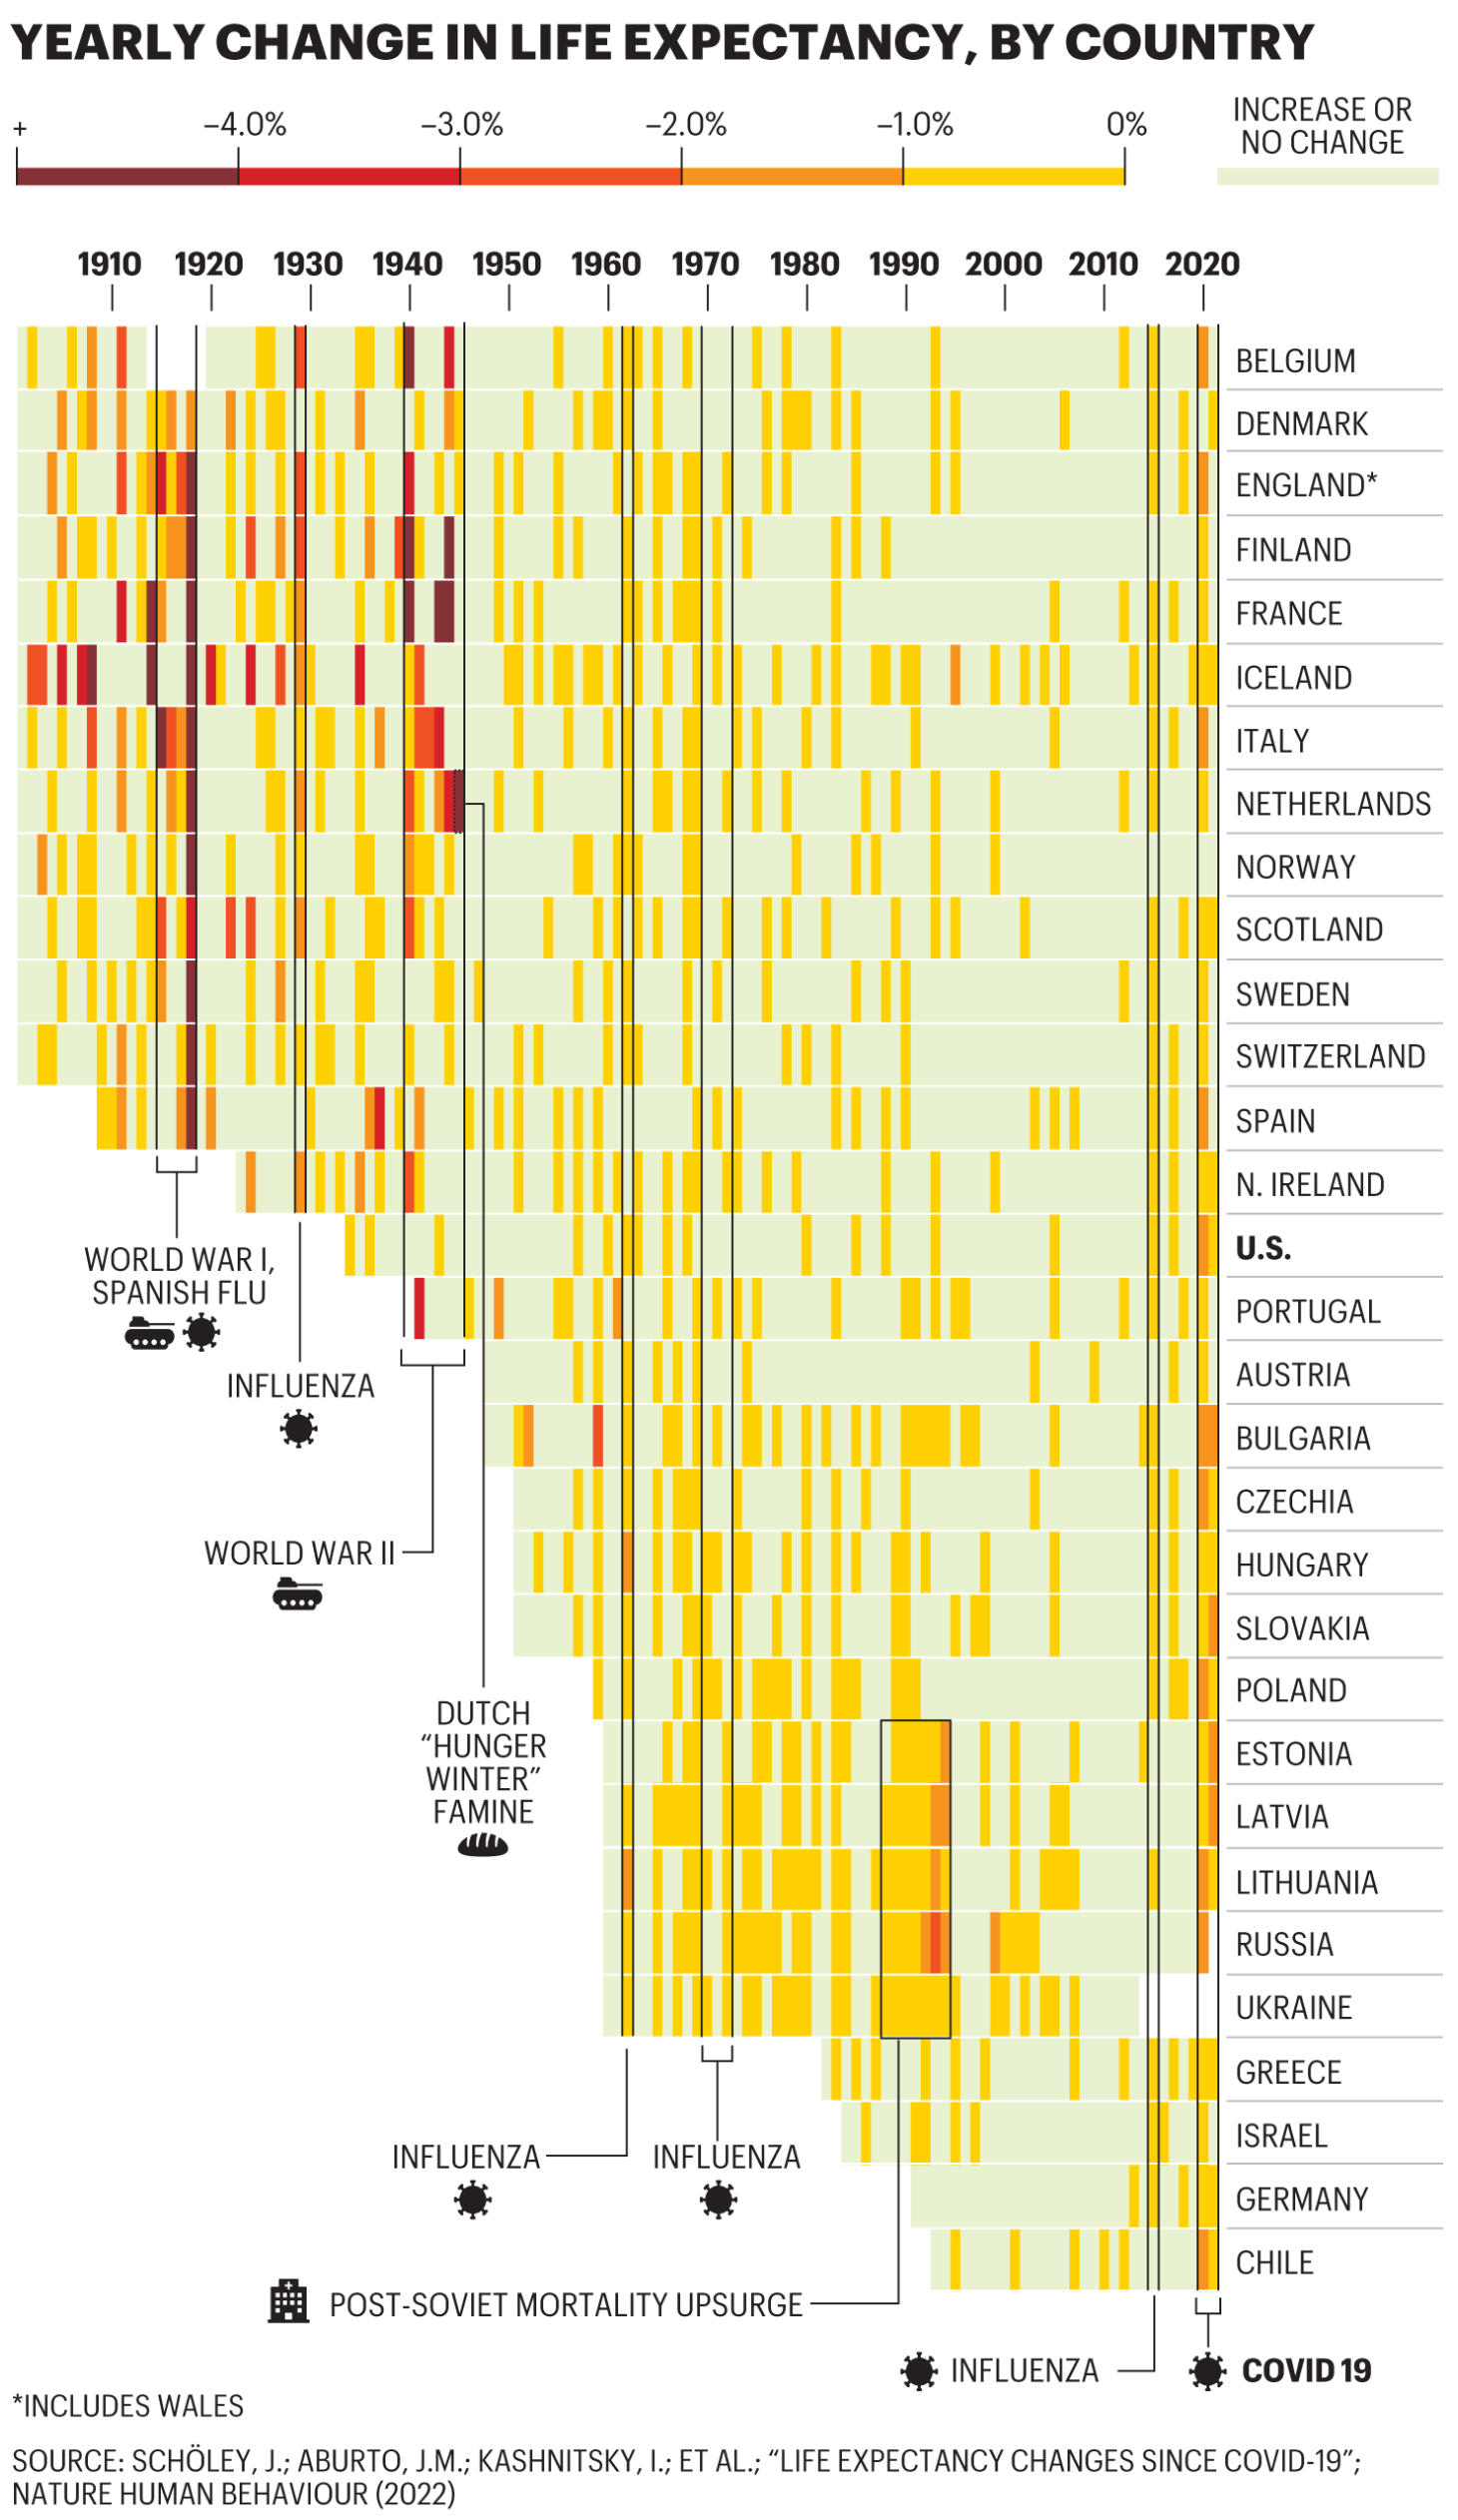
By Matthew Heimer and Nicolas Rapp6 December 2022 (Fortune) – COVID’s devastation shows up starkly in life expectancy data: The pandemic’s peak marked the first time since World War II that LE (as demographers call it) declined across the globe. The graphic above is based on a data set that focuses mostly on Europe, but similar […]

Potential effect of high-temperature days on global life evaluations, 2021-2030. The estimated 17 percent drop in life evaluation by 2030 again does not take adaptability and recovery into account. However, this estimation is based on the increase in the number of high-heat days people will face globally by 2030, and is substantively meaningful. Graphic: Gallup

Rising global temperatures linked to declining wellbeing – “The analysis paints a bleak picture of the future”

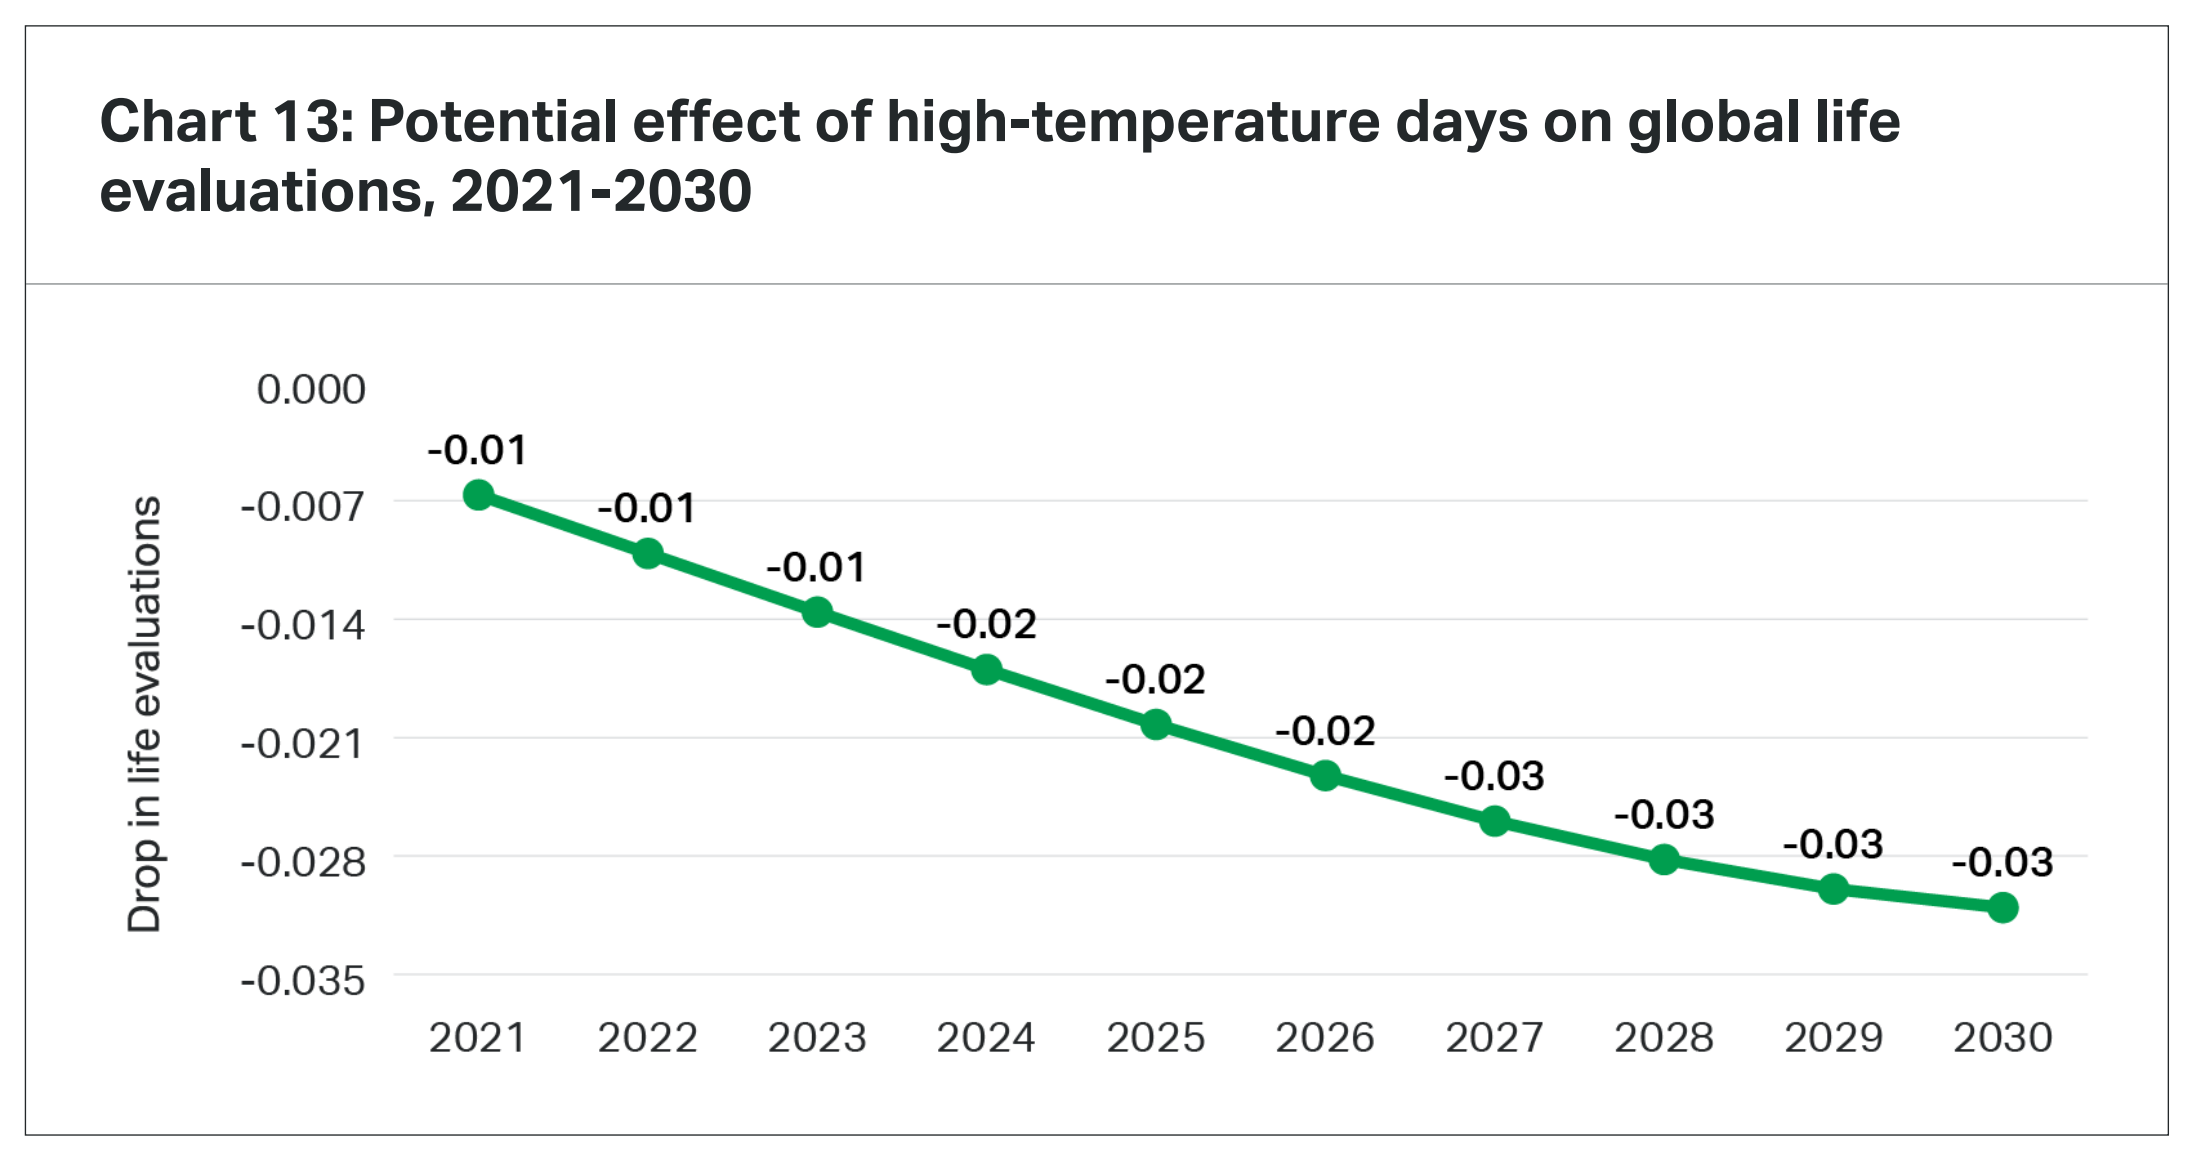
By Benedicte Clouet and Nicole Willcoxon 31 August 2022 (Gallup) – As people around the world suffer through concurrent extreme heat waves, droughts, and wildfires, the effects of climate change are becoming a grim, global reality. Despite robust evidence of the environmental and economic costs of rising temperatures, far less is known about how these […]

Social media & sharing icons powered by UltimatelySocial