WMO: 2020 on track to be one of three warmest years on record – More than 80 percent of the global ocean experienced a marine heatwave in 2020
GENEVA, 2 December 2020 (WMO) – Climate change continued its relentless march in 2020, which is on track to be one of the three warmest years on record. 2011-2020 will be the warmest decade on record, with the warmest six years all being since 2015, according to the World Meteorological Organization.
Ocean heat is at record levels and more than 80% of the global ocean experienced a marine heatwave at some time in 2020, with widespread repercussions for marine ecosystems already suffering from more acidic waters due to carbon dioxide (CO2) absorption, according to the provisional WMO report on the State of the Global Climate in 2020.
The report, which is based on contributions of dozens of international organizations and experts, shows how high-impact events including extreme heat, wildfires, and floods, as well as the record-breaking Atlantic hurricane season, affected millions of people, compounding threats to human health and security and economic stability posed by the COVID-19 pandemic.
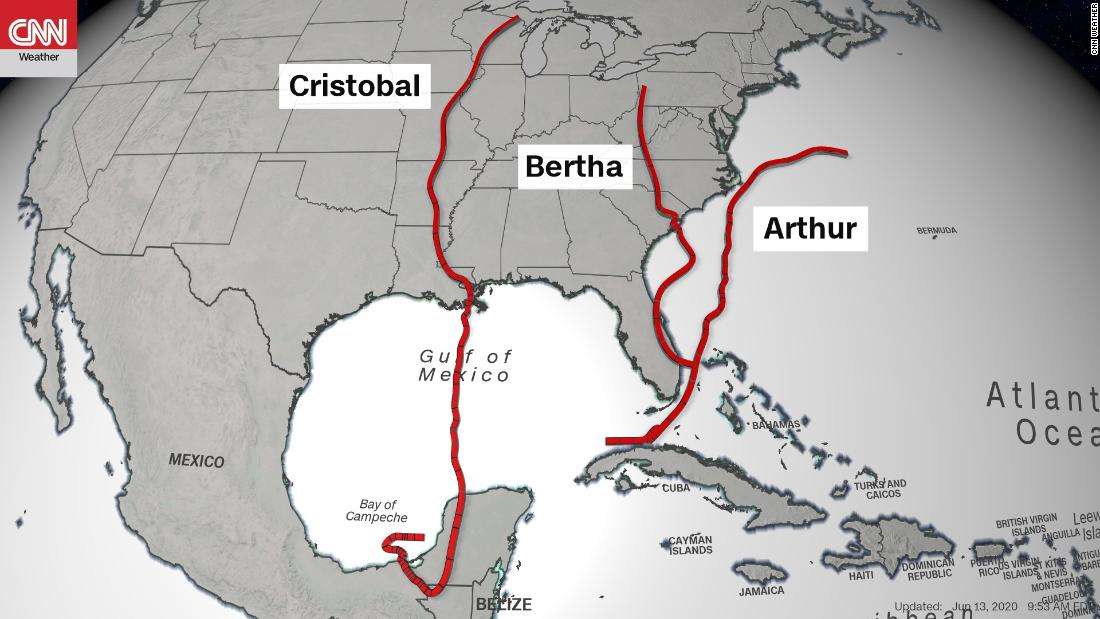
2020 has, unfortunately, been yet another extraordinary year for our climate. We saw new extreme temperatures on land, sea, and especially in the Arctic. Wildfires consumed vast areas in Australia, Siberia, the US West Coast, and South America, sending plumes of smoke circumnavigating the globe. We saw a record number of hurricanes in the Atlantic, including unprecedented back-to-back Category 4 hurricanes in Central America in November. Flooding in parts of Africa and Southeast Asia led to massive population displacement and undermined food security for millions.
WMO Secretary-General, Professor Petteri Taalas
Despite the COVID-19 lockdown, atmospheric concentrations of greenhouse gases continued to rise, committing the planet to further warming for many generations to come because of the long lifetime of CO2 in the atmosphere, according to the report.
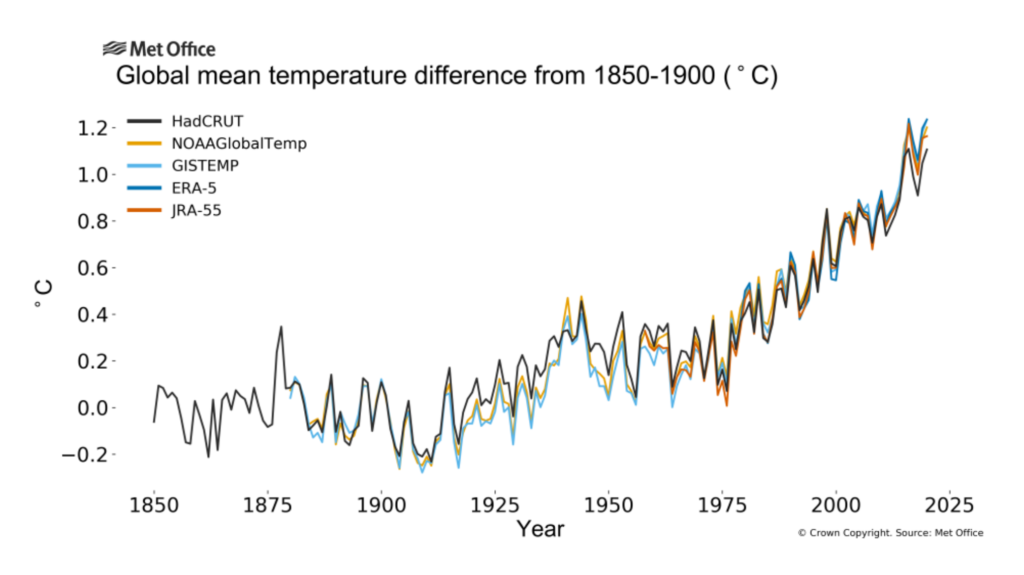
“The average global temperature in 2020 is set to be about 1.2 °C above the pre-industrial (1850-1900) level. There is at least a one in five chance of it temporarily exceeding 1.5 °C by 2024,” said WMO Secretary-General Prof. Petteri Taalas.
“This year is the fifth anniversary of the Paris Agreement on Climate Change. We welcome all the recent commitments by governments to reduce greenhouse gas emissions because we are currently not on track and more efforts are needed.”
“Record warm years have usually coincided with a strong El Niño event, as was the case in 2016. We are now experiencing a La Niña, which has a cooling effect on global temperatures, but has not been sufficient to put a brake on this year’s heat. Despite the current La Niña conditions, this year has already shown near record heat comparable to the previous record of 2016,” said Prof. Taalas.
“2020 has, unfortunately, been yet another extraordinary year for our climate. We saw new extreme temperatures on land, sea, and especially in the Arctic. Wildfires consumed vast areas in Australia, Siberia, the US West Coast, and South America, sending plumes of smoke circumnavigating the globe. We saw a record number of hurricanes in the Atlantic, including unprecedented back-to-back Category 4 hurricanes in Central America in November. Flooding in parts of Africa and South East Asia led to massive population displacement and undermined food security for millions,” he said.
The 2020 provisional State of the Global Climate report is based on temperature data from January to October. The final 2020 report will be published in March 2021. It incorporates information from National Meteorological and Hydrological Services, regional and global climate centres and United Nations partners including the Food and Agriculture Organization of the United Nations (FAO), International Monetary Fund (IMF), Intergovernmental Oceanographic Commission of UNESCO (UNESCO-IOC), International Organization for Migration (IOM), the United Nations Environment Programme (UNEP), UN High Commissioner for Refugees (UNHCR), and the World Food Programme (WFP). […]
Temperatures and heat
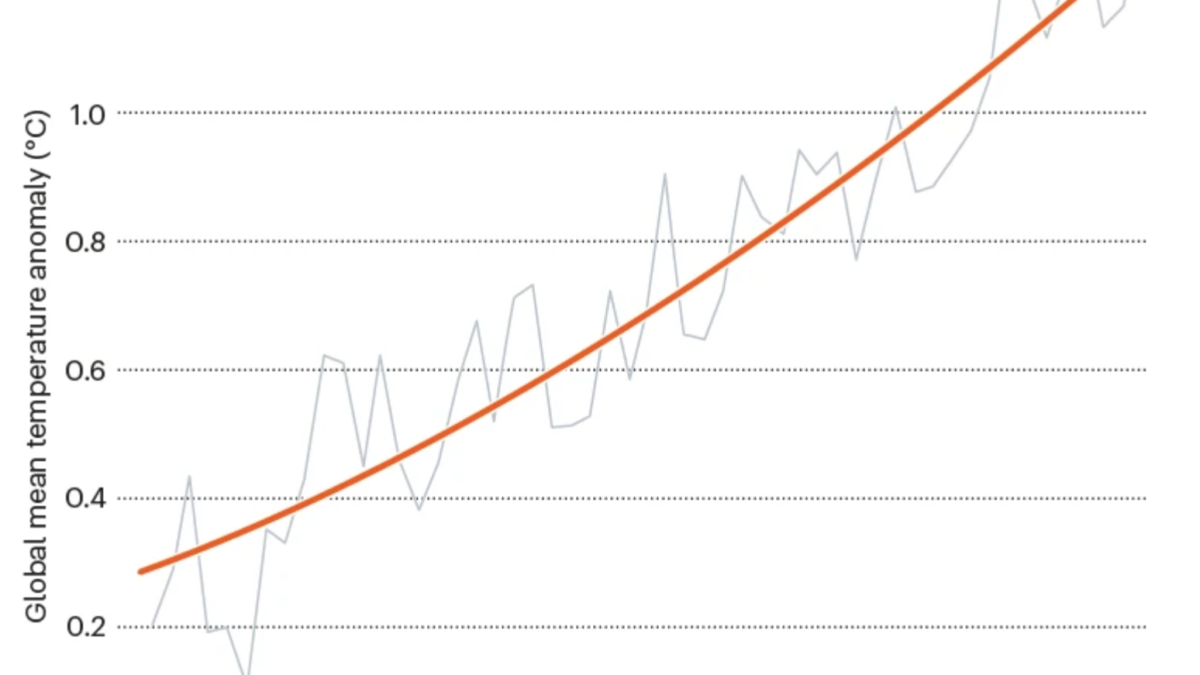
The global mean temperature for January to October 2020 was around 1.2°C above the 1850–1900 baseline, used as an approximation of pre-industrial levels. 2020 is very likely to be one of the three warmest years on record globally. Modern temperature records began in 1850.
The WMO assessment is based on five global temperature datasets (Figure 1). All five of those datasets currently place 2020 as the 2nd warmest for the year to date, following 2016 and ahead of 2019. The difference between the warmest three years is small, however, and exact rankings for each data set could change once data for the entire year are available.
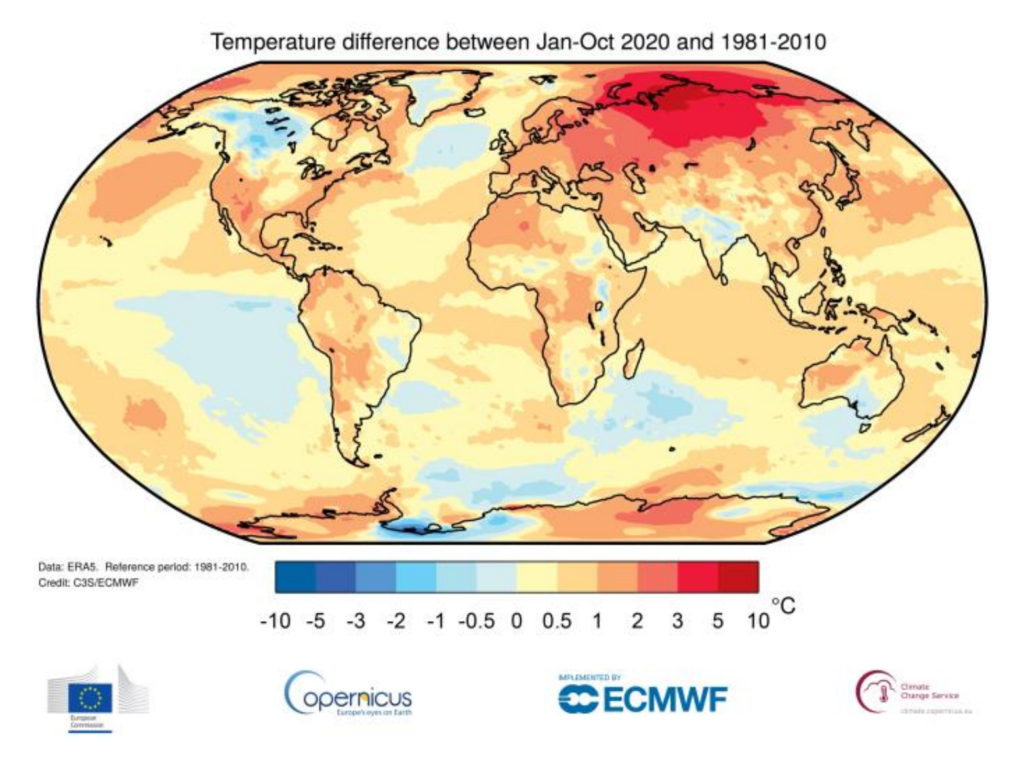
The most notable warmth was observed across northern Asia, particularly the Siberian Arctic, where temperatures were more than 5 °C above average. Siberian heat culminated in late June, when it reached 38.0 °C at Verkhoyansk on the 20th, provisionally the highest known temperature anywhere north of the Arctic Circle. This fuelled the most active wildfire season in an 18-year long data record, as estimated in terms of CO2 emissions released from fires. […]
ocean that experienced an MHW over the year. Horizontal lines in this figure show the final percentages for each category of MHW; (D) Stacked bar plot showing the cumulative number of MHW days averaged over all pixels in the ocean. Graphic:
Robert Schlegel / IMEV
Sea-level rise and ocean heat
Ocean heat content for 2019 was highest on record in the datasets going back to 1960. There is a clear signal for faster heat uptake in recent decades. More than 90% of the excess energy accumulating in the climate system as a result of increased concentrations of greenhouse gases goes into the ocean.
On average, since early 1993, the altimetry-based global mean rate of sea level rise amounts to 3.3 ± 0.3 mm/yr. The rate has also increased over that time. A greater loss of ice mass from the ice sheets is the main cause of the accelerated rise in the global mean sea level.
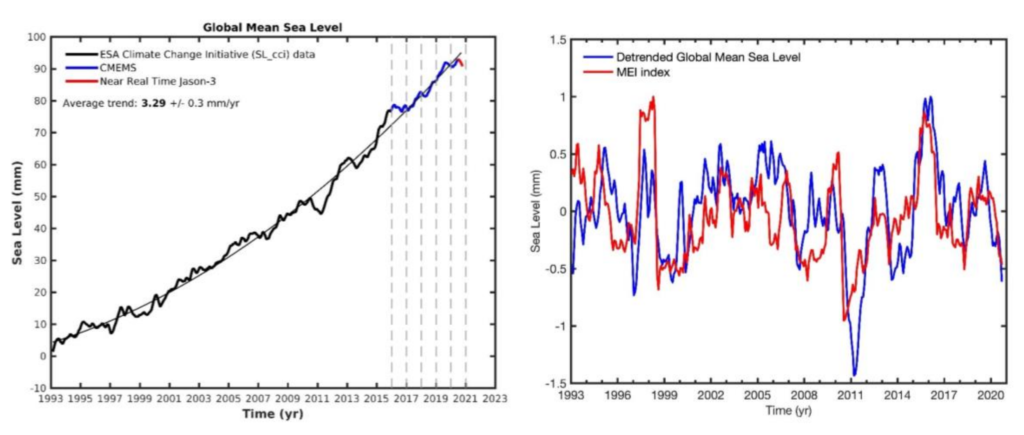
Global mean sea-level in 2020 is similar to that in 2019, and consistent with the long-term trend. Developing La Niña conditions have led to a recent small drop in global sea level, similar to the temporary drops associated with previous La Niña events.
As with heatwaves on land, extreme heat can affect the near-surface layer of the oceans with a range of consequences for marine life and dependent communities. Satellite retrievals of sea-surface temperature are used to monitor marine heatwaves, which can be categorized as moderate, strong, severe, or extreme. Much of the ocean experienced at least one ‘strong’ marine heatwave at some point in 2020. The Laptev Sea experienced an extreme marine heatwave from June to October. Sea ice extent was unusually low in the region and adjacent land areas experienced heatwaves during the summer. [more]