Global map showing the highest marine heatwave (MHW) category experienced at each pixel in 2021 (reference period 1982–2011). Light grey indicates that no MHW occurred in a pixel over the entire year. (b) Stacked bar plot showing the percentage of the surface of the ocean experiencing an MHW on any given day of the year. (c) Stacked bar plot showing the cumulative percentage of the surface of the ocean that experienced an MHW over the year. Note: These values are based on when in the year a pixel first experienced its highest MHW category, so no pixel is counted twice. Horizontal lines in this figure show the final percentages for each category of MHW. (d) Stacked bar plot showing the cumulative number of MHW days averaged over the surface of the ocean. Note: This average is calculated by dividing the cumulative sum of MHW days per pixel weighted by the surface area of those pixels. Data: National Oceanic and Atmospheric Administration Optimum Interpolation Sea Surface Temperature (NOAA OISST). Graphic: Robert Schlegel

WMO: Four key climate change indicators broke records in 2021 – Past seven years have been the warmest seven years on record – “A dismal litany of humanity’s failure to tackle climate disruption”

GENEVA, 18 May 2022 (WMO) – Four key climate change indicators – greenhouse gas concentrations, sea level rise, ocean heat and ocean acidification – set new records in 2021. This is yet another clear sign that human activities are causing planetary scale changes on land, in the ocean, and in the atmosphere, with harmful and […]

Sateliite data showing the 2021 Antarctic ozone hole, which reached its maximum area on 7 October 2021 and ranked as the 13th-largest such feature since 1979. This view, from a NASA video, shows its current extent based on satellite data. Data: Paul Newman and Eric Nash / NASA / Ozone Watch. Graphic: Joshua Stevens

Video: Larger-than-average ozone hole over Antarctica in 2021 – Ozone layer recovery slower than anticipated, will be no earlier than 2070

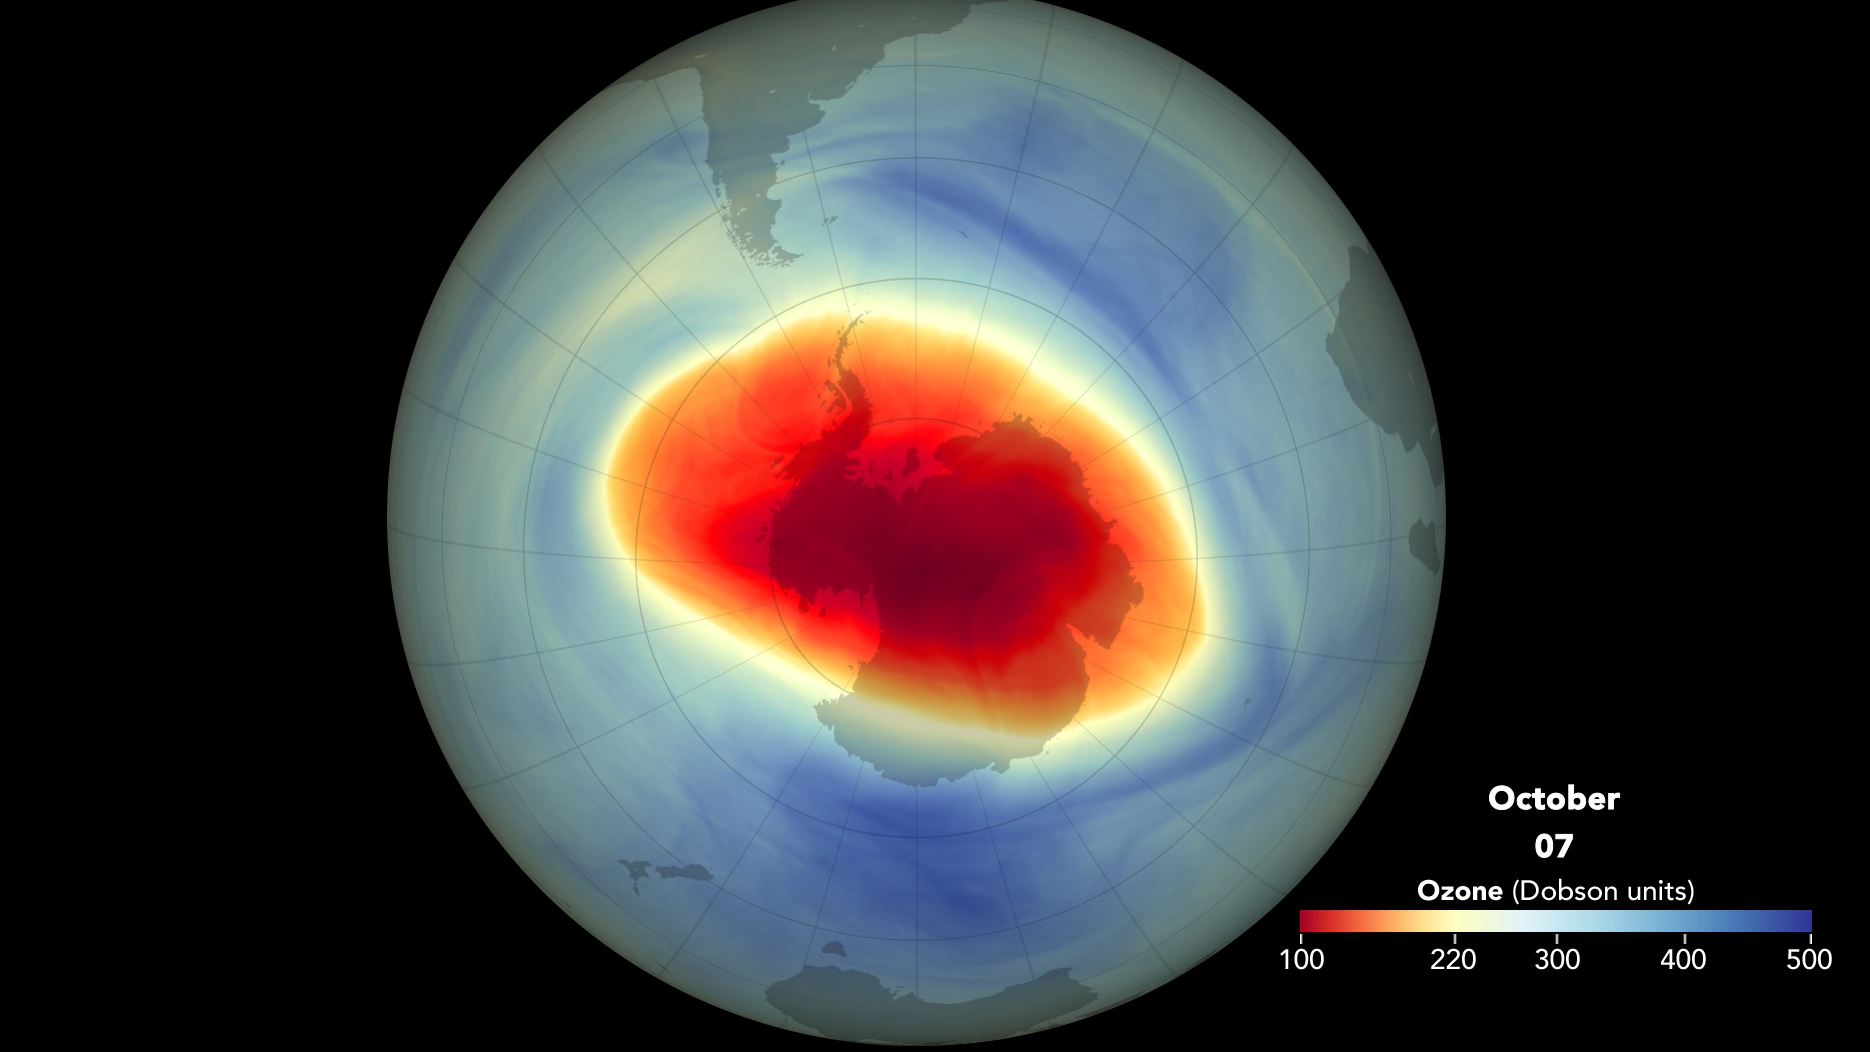
By Elizabeth Howell 5 November 2021 (Space.com) – A new NASA video highlights the giant ozone hole that opened over Antarctica this year. A cold Southern Hemisphere winter, and possible effects of global warming, have caused the hole to grow to its 13th-largest extent since 1979. The ozone depletion you see in the NASA video is monitored by three […]

Total column ozone field (in Dobson Units) from CAMS, 1 April 2020 - 6 April 2020, showing values below 250 DU over large parts of the Arctic. Video: Copernicus Atmosphere Monitoring Service / ECMWF

Arctic ozone depletion tracks at record levels in Spring 2020

9 April 2020 (WMO) – Depletion of the ozone layer, ­ the shield that protects life on Earth from harmful levels of ultraviolet radiation, ­is at an unprecedented level over large parts of the Arctic this spring . This phenomenon is caused by the continuing presence of ozone­-depleting substances in the atmosphere and a very […]

Social media & sharing icons powered by UltimatelySocial