Pacific island sea levels rising faster than global average, WMO says – Economic damage in Southwest Pacific due to flooding in 2022 was $8.5 billion, almost triple compared to the previous year

By Gabrielle Tétrault-Farber
17 August 2023
GENEVA (Reuters) – Sea levels in the South-West Pacific are rising faster than the global average, threatening low-lying islands while heat damages marine ecosystems, the U.N. meteorological agency said on Friday.
In its State of the Climate in the South-West Pacific 2022 report, the World Meteorological Organization (WMO) said water levels were rising about 4 mm per year in some areas, slightly above the global mean rate.
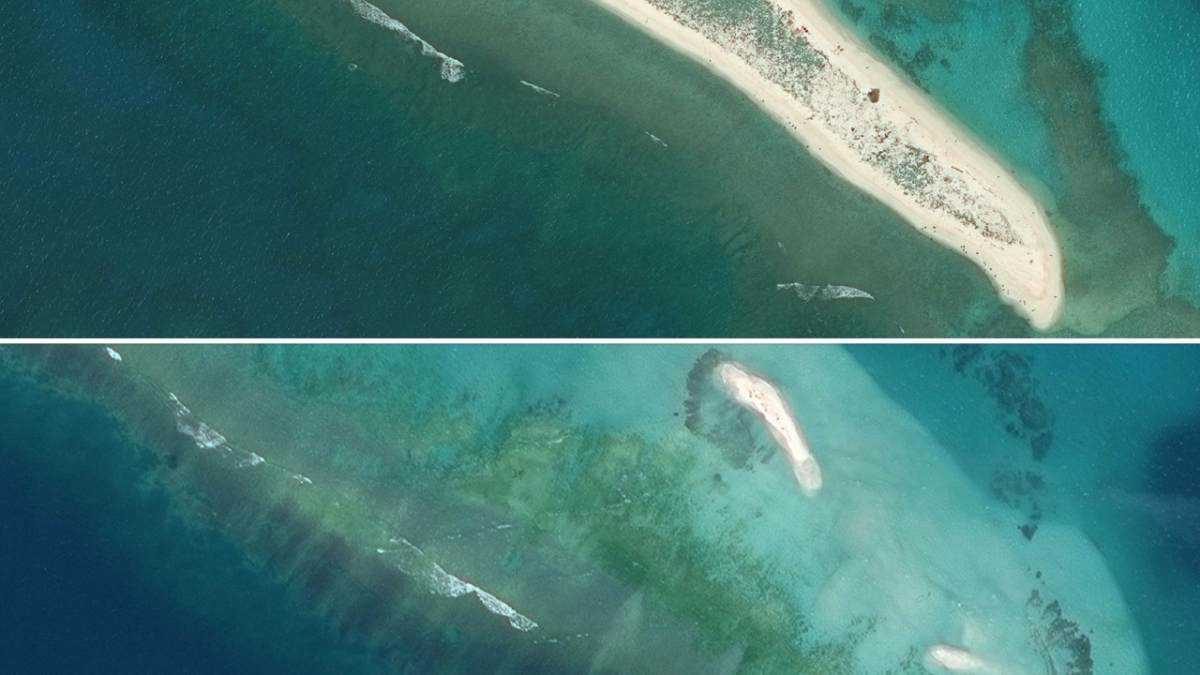
That means low-lying territory such as Tuvalu and the Solomon Islands over time could become flooded, destroying agricultural and habitable lands with inhabitants unable to move to higher elevations.
The report added that marine heatwaves had occurred in a large area northeast of Australia and south of Papua New Guinea over more than six months, affecting marine life and the livelihoods of local communities.

WMO Secretary-General Petteri Taalas said that El Niño, a warming of water surface temperatures in the eastern and central Pacific Ocean that returned this year, would strongly affect the region.
“This will have a big impact on the South-West Pacific region as it is frequently associated with higher temperatures, disruptive weather patterns and more marine heatwaves and coral bleaching,” Taalas said in a statement.
The region last year recorded 35 natural hazards, including floods and storms, that killed more than 700 people, according to the report. These hazards directly affected more than 8 million people.
Although the number of reported disaster weather events in the region decreased last year compared to 2021, the scale of economic losses due to flooding and weather events increased, according to the report.
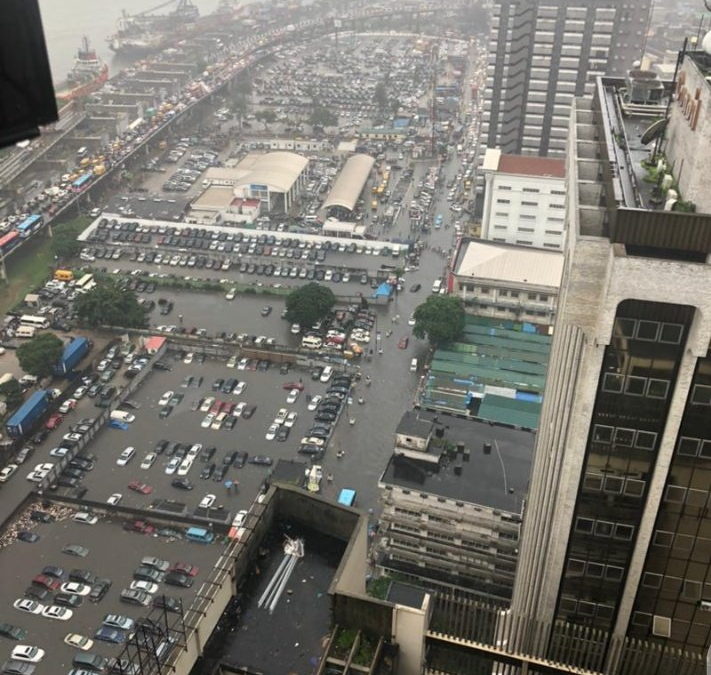
Flood damage, including in Australia and the Philippines, amounted to $8.5 billion, almost triple the previous year.
Pacific island sea levels rising faster than global average, WMO says

Climate change impacts increase in South-West Pacific
FIJI, 18 August 2023 (WMO) – Weather-related disasters and climate change impacts are unravelling the fabric of society in the South-West Pacific. Sea level rise threatens the future of low-lying islands whilst increasing ocean heat and acidification harms vital and vulnerable marine ecosystems, according to a new report from the World Meteorological Organization (WMO).
The State of the Climate in the South-West Pacific 2022 report provides a snapshot of climate indicators including temperatures, sea level rise, ocean heat and acidification, and extreme weather events in 2022. It also highlights the socio-economic risks and impacts on key sectors like agriculture.
The report, along with an interactive story map, is one of a series of five regional reports and a global report from WMO providing the latest climate insights to inform decision-making.
The three-year-long La Niña event had a clear influence on temperatures in 2022. But despite its temporary cooling influence, it was still a warm year for the region. The mean temperature in 2022 was 0.2 °C to 0.3 °C higher than during the last strong La Niña event in 2011.
“The El Niño, which followed three years of La Niña conditions, is very likely to continue during the rest of the year. This will have a big impact on the South-West Pacific region as it is frequently associated with higher temperatures, disruptive weather patterns and more marine heatwaves and coral bleaching,” said WMO Secretary-General Prof. Petteri Taalas.

Compared to 2021, the number of reported disaster events decreased; however, economic losses increased. Economic damage due to flooding was US$ 8.5 billion, almost triple compared to the previous year, with most of the damage attributable to a series of flooding events in Australia. Tropical Storms Megi and Nalgae caused devastating flooding in the Philippines.
“Early warning is one of the most effective ways of reducing damage from disasters, as it empowers people to make risk-informed decisions for food security, as well as other sectors,” said Prof. Taalas.
“Despite continuous efforts to strengthen multi-hazard early warning systems, the present report clearly shows that there are still significant gaps to be addressed,” he said.
“The Early Warnings for All initiative … is critical in the Pacific, which is characterized by distinct disaster risk hotspots that are intensifying and expanding as climate-related hydrometeorological disasters intensify,” said Armida Salsiah Alisjahbana, Under-Secretary-General of the United Nations and Executive Secretary of the Economic and Social Commission for Asia Pacific.
“ESCAP and WMO, working in partnership, will continue to invest in raising climate ambition and accelerating the implementation of policy actions, which includes bringing early warnings to all in the region so that no one is left behind as our climate change crisis continues to evolve,” she said.
The report shows how the agriculture sector is one of the most critical sectors affected by climate-related disasters, echoing the national adaptation plans of many countries in the South-West Pacific. Enhancing the resilience of food systems is therefore a high priority. [more]


