Understanding climate warming impacts on carbon release from the tundra – “We anticipate an increase in respiration across the whole Arctic and alpine tundra”
![Effects of experimental open-top chamber (OTC) warming on ecosystem respiration (ER). Experimental warming increased ER across the tundra biome but the magnitude of the response varied across time and space. Effect of OTC warming on ER Hedges’ SMD calculated as (mean ER of the warmed plots − mean ER of the control plots)/pooled standard deviation across the 136 growing season datasets (that is, unique experiment × ER measurement year combinations). On the top of the graph, a blue diamond shows the mean estimate (est. = 0.57 and 95% CI [0.44–0.70], error bars) of the ER response across the 136 datasets, as well as the Q value testing for heterogeneity and P value from the meta-analysis. Black dots represent ER Hedges’ SMDs of individual datasets and 95% CIs (black error bars) in alphabetical and chronological order. Individual datasets are represented by the experiment ID in black (left) and ER measurement year (right) in a colour scale ranging from dark blue, light blue, orange to red which represents increasingly longer warming duration at the time of ER measurements. Experiments with more than 1 year of ER data are grouped. See Supplementary Tables 1, 2 and 4 for details on the datasets and SMD and CI values. The black dashed vertical line (SMD = 0) represents no change in ER with warming whereas the areas to the right and left of it represent increased (SMD > 0) versus decreased (SMD < 0) ER with warming. Dashed vertical lines (x = 0.2, 0.5, 0.8 and −0.2, −0.5, −0.8) reflect small, medium and large positive and negative Hedges’ SMD, that is, increasingly greater ER increases and decreases with warming. Graphic: Maes. et al., 2024 / Nature](https://desdemonadespair.net/wp-content/uploads/2024/04/image-47.png)
By Sara-Lena Brännström
17 April 2024
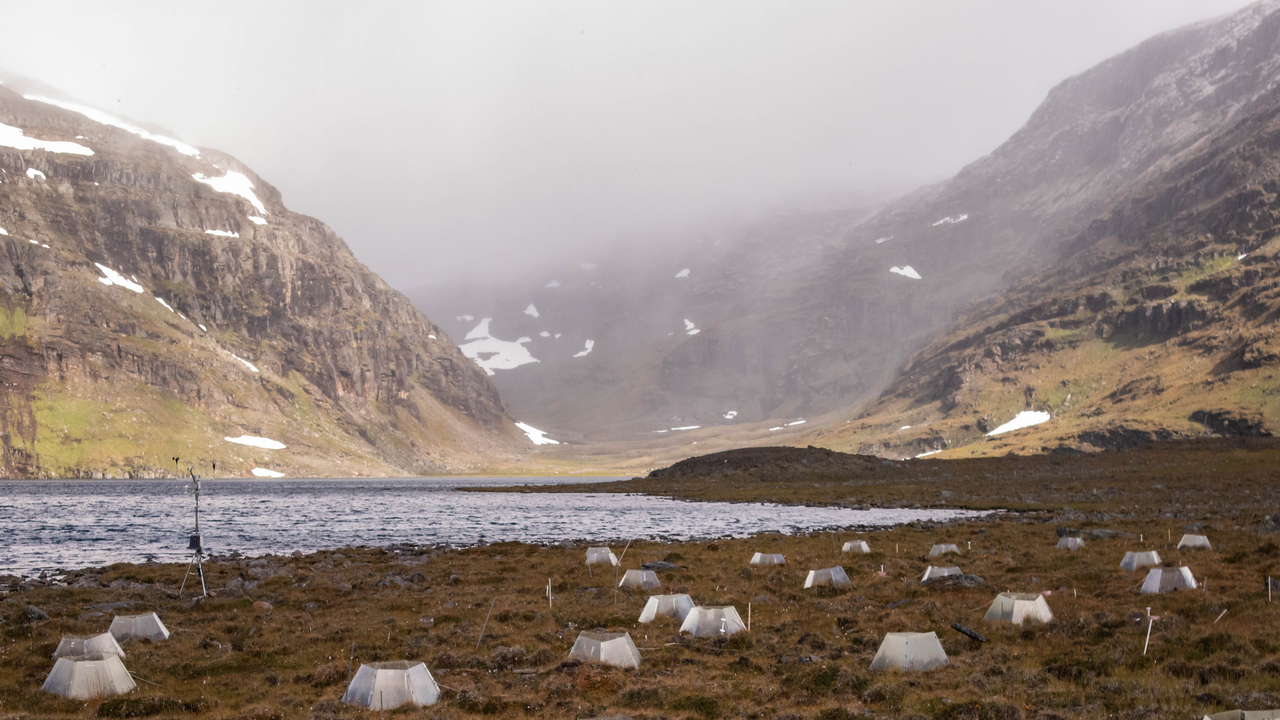
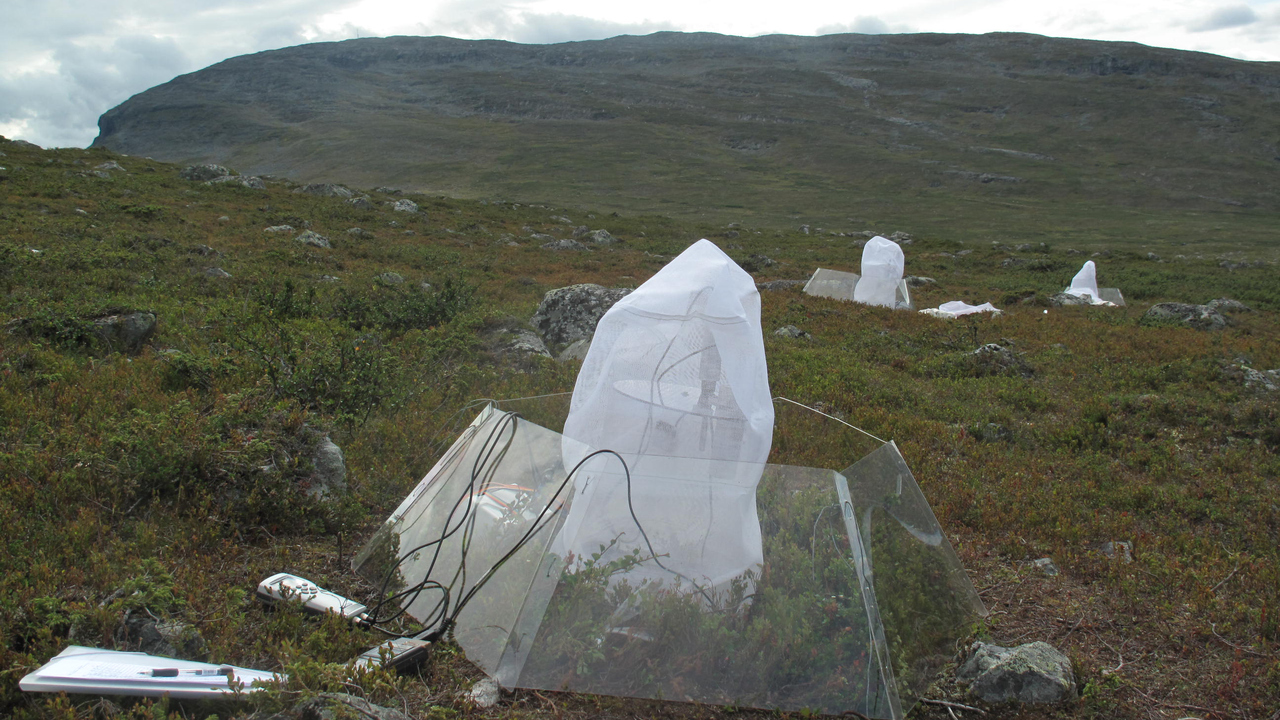
(Umeå University) – A team of over 70 scientists from different countries used so called open-top chambers (OTCs) to experimentally simulate the effects of warming on 28 tundra sites around the world. OTCs basically serve as mini-greenhouses, blocking wind and trapping heat to create local warming.
The warming experiments led to a 1.4 degrees Celsius increase in air temperature and a 0.4 degrees increase in soil temperature, along with a 1.6 percent drop in soil moisture. These changes boosted ecosystem respiration by 30 percent during the growing season, causing more carbon to be released because of increased metabolic activity in soil and plants. The changes persisted for at least 25 years after the start of the experimental warming – which earlier studies hadn’t revealed.
“We knew from earlier studies that we were likely to find an increase in respiration with warming, but we found a remarkable increase – nearly four times greater than previously estimated, though it varied with time and location,” says Sybryn Maes of Umeå University, the study’s lead author.
Creating better climate models
The increase in ecosystem respiration also varied with local soil conditions, such as nitrogen and pH levels. This means that differences in soil conditions and other factors lead to geographic differences in the response – some regions will see more carbon release than others. Understanding the links between soil conditions and respiration in response to warming is important for creating better climate models.
“Our work represents the first assessment of ecosystem respiration response to experimental warming across such a broad environmental gradient in the tundra, incorporating a comprehensive set of environmental drivers,” says Associate Professor Ellen Dorrepaal of Umeå University.
Some areas more sensitive to warming
The study also offers a broader perspective on Arctic and alpine regions by predicting increases in respiration across the whole tundra area together with more detailed information about variation in the sensitivity of the response.
“We see that some areas, particularly parts of Siberia and Canada, exhibit greater sensitivity to warming,” says Professor Matti Kummu of Aalto University. “We anticipate an increase in respiration across the whole Arctic and alpine tundra, but more in situ data, particularly on the local soil conditions, is key to addressing the outstanding uncertainties and refining our predictions.”
Understanding how ecosystems shift in response to climate change and how these changes feed back into the climate is vital to get an accurate picture of how our world will change. These findings serve as an important baseline for improved climate models, but the researchers plan to refine them further by analyzing how the experimental sites change over time and expand the experiment’s scope to include new sites.
Contact
- Sybryn Maes, Climate Impacts Research Centre / Department of Ecology and Environmental Science, Umeå University, Abisko, Sweden, Department of Earth and Environmental Sciences, KU Leuven, Leuven, Belgium, Tel: +32 478 50 52 64, Email: sybryn.maes@gmail.com
- Ellen Dorrepaal, Climate Impacts Research Centre / Department of Ecology and Environmental Science, Umeå University, Abisko, Sweden, Tel: +46 73 045 92 64, Email: ellen.dorrepaal@umu.se
Understanding climate warming impacts on carbon release from the tundra
Environmental drivers of increased ecosystem respiration in a warming tundra
ABSTRACT: Arctic and alpine tundra ecosystems are large reservoirs of organic carbon1,2. Climate warming may stimulate ecosystem respiration and release carbon into the atmosphere3,4. The magnitude and persistency of this stimulation and the environmental mechanisms that drive its variation remain uncertain5,6,7. This hampers the accuracy of global land carbon–climate feedback projections7,8. Here we synthesize 136 datasets from 56 open-top chamber in situ warming experiments located at 28 arctic and alpine tundra sites which have been running for less than 1 year up to 25 years. We show that a mean rise of 1.4 °C [confidence interval (CI) 0.9–2.0 °C] in air and 0.4 °C [CI 0.2–0.7 °C] in soil temperature results in an increase in growing season ecosystem respiration by 30% [CI 22–38%] (n = 136). Our findings indicate that the stimulation of ecosystem respiration was due to increases in both plant-related and microbial respiration (n = 9) and continued for at least 25 years (n = 136). The magnitude of the warming effects on respiration was driven by variation in warming-induced changes in local soil conditions, that is, changes in total nitrogen concentration and pH and by context-dependent spatial variation in these conditions, in particular total nitrogen concentration and the carbon:nitrogen ratio. Tundra sites with stronger nitrogen limitations and sites in which warming had stimulated plant and microbial nutrient turnover seemed particularly sensitive in their respiration response to warming. The results highlight the importance of local soil conditions and warming-induced changes therein for future climatic impacts on respiration.
Environmental drivers of increased ecosystem respiration in a warming tundra