Effects of experimental open-top chamber (OTC) warming on ecosystem respiration (ER). Experimental warming increased ER across the tundra biome but the magnitude of the response varied across time and space. Effect of OTC warming on ER Hedges’ SMD calculated as (mean ER of the warmed plots − mean ER of the control plots)/pooled standard deviation across the 136 growing season datasets (that is, unique experiment × ER measurement year combinations). On the top of the graph, a blue diamond shows the mean estimate (est. = 0.57 and 95% CI [0.44–0.70], error bars) of the ER response across the 136 datasets, as well as the Q value testing for heterogeneity and P value from the meta-analysis. Black dots represent ER Hedges’ SMDs of individual datasets and 95% CIs (black error bars) in alphabetical and chronological order. Individual datasets are represented by the experiment ID in black (left) and ER measurement year (right) in a colour scale ranging from dark blue, light blue, orange to red which represents increasingly longer warming duration at the time of ER measurements. Experiments with more than 1 year of ER data are grouped. See Supplementary Tables 1, 2 and 4 for details on the datasets and SMD and CI values. The black dashed vertical line (SMD = 0) represents no change in ER with warming whereas the areas to the right and left of it represent increased (SMD > 0) versus decreased (SMD 

Understanding climate warming impacts on carbon release from the tundra – “We anticipate an increase in respiration across the whole Arctic and alpine tundra”

By Sara-Lena Brännström 17 April 2024 (Umeå University) – A team of over 70 scientists from different countries used so called open-top chambers (OTCs) to experimentally simulate the effects of warming on 28 tundra sites around the world. OTCs basically serve as mini-greenhouses, blocking wind and trapping heat to create local warming. The warming experiments […]

The Bald Mountain Wildfire burns in the Grande Prairie Forest Area in Alberta on 12 May 2023. Government of Alberta Fire Service / Canadian Press / AP

Forests are no longer our climate friends – “As extreme as this year’s wildfire emissions have been, they are just the latest escalation in a multi-decade flood of CO₂ pouring out of Canada’s ‘managed’ forests and forestry”

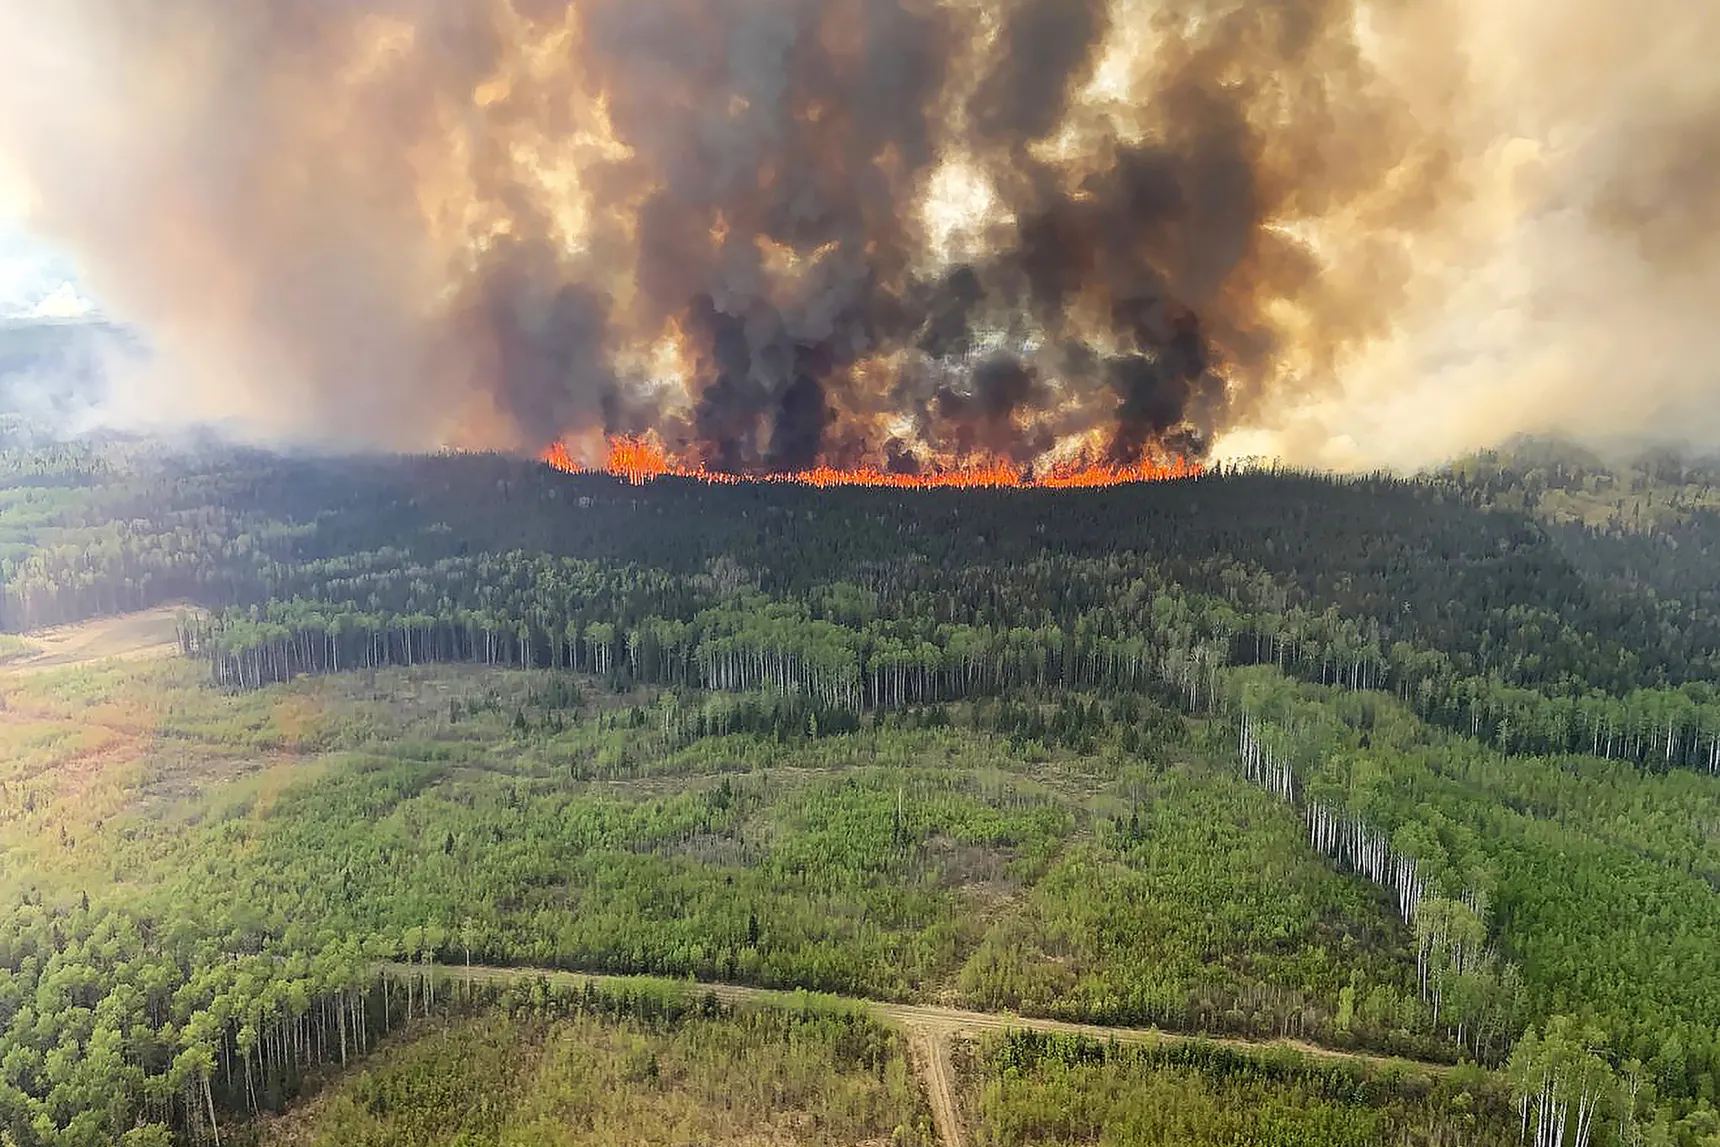
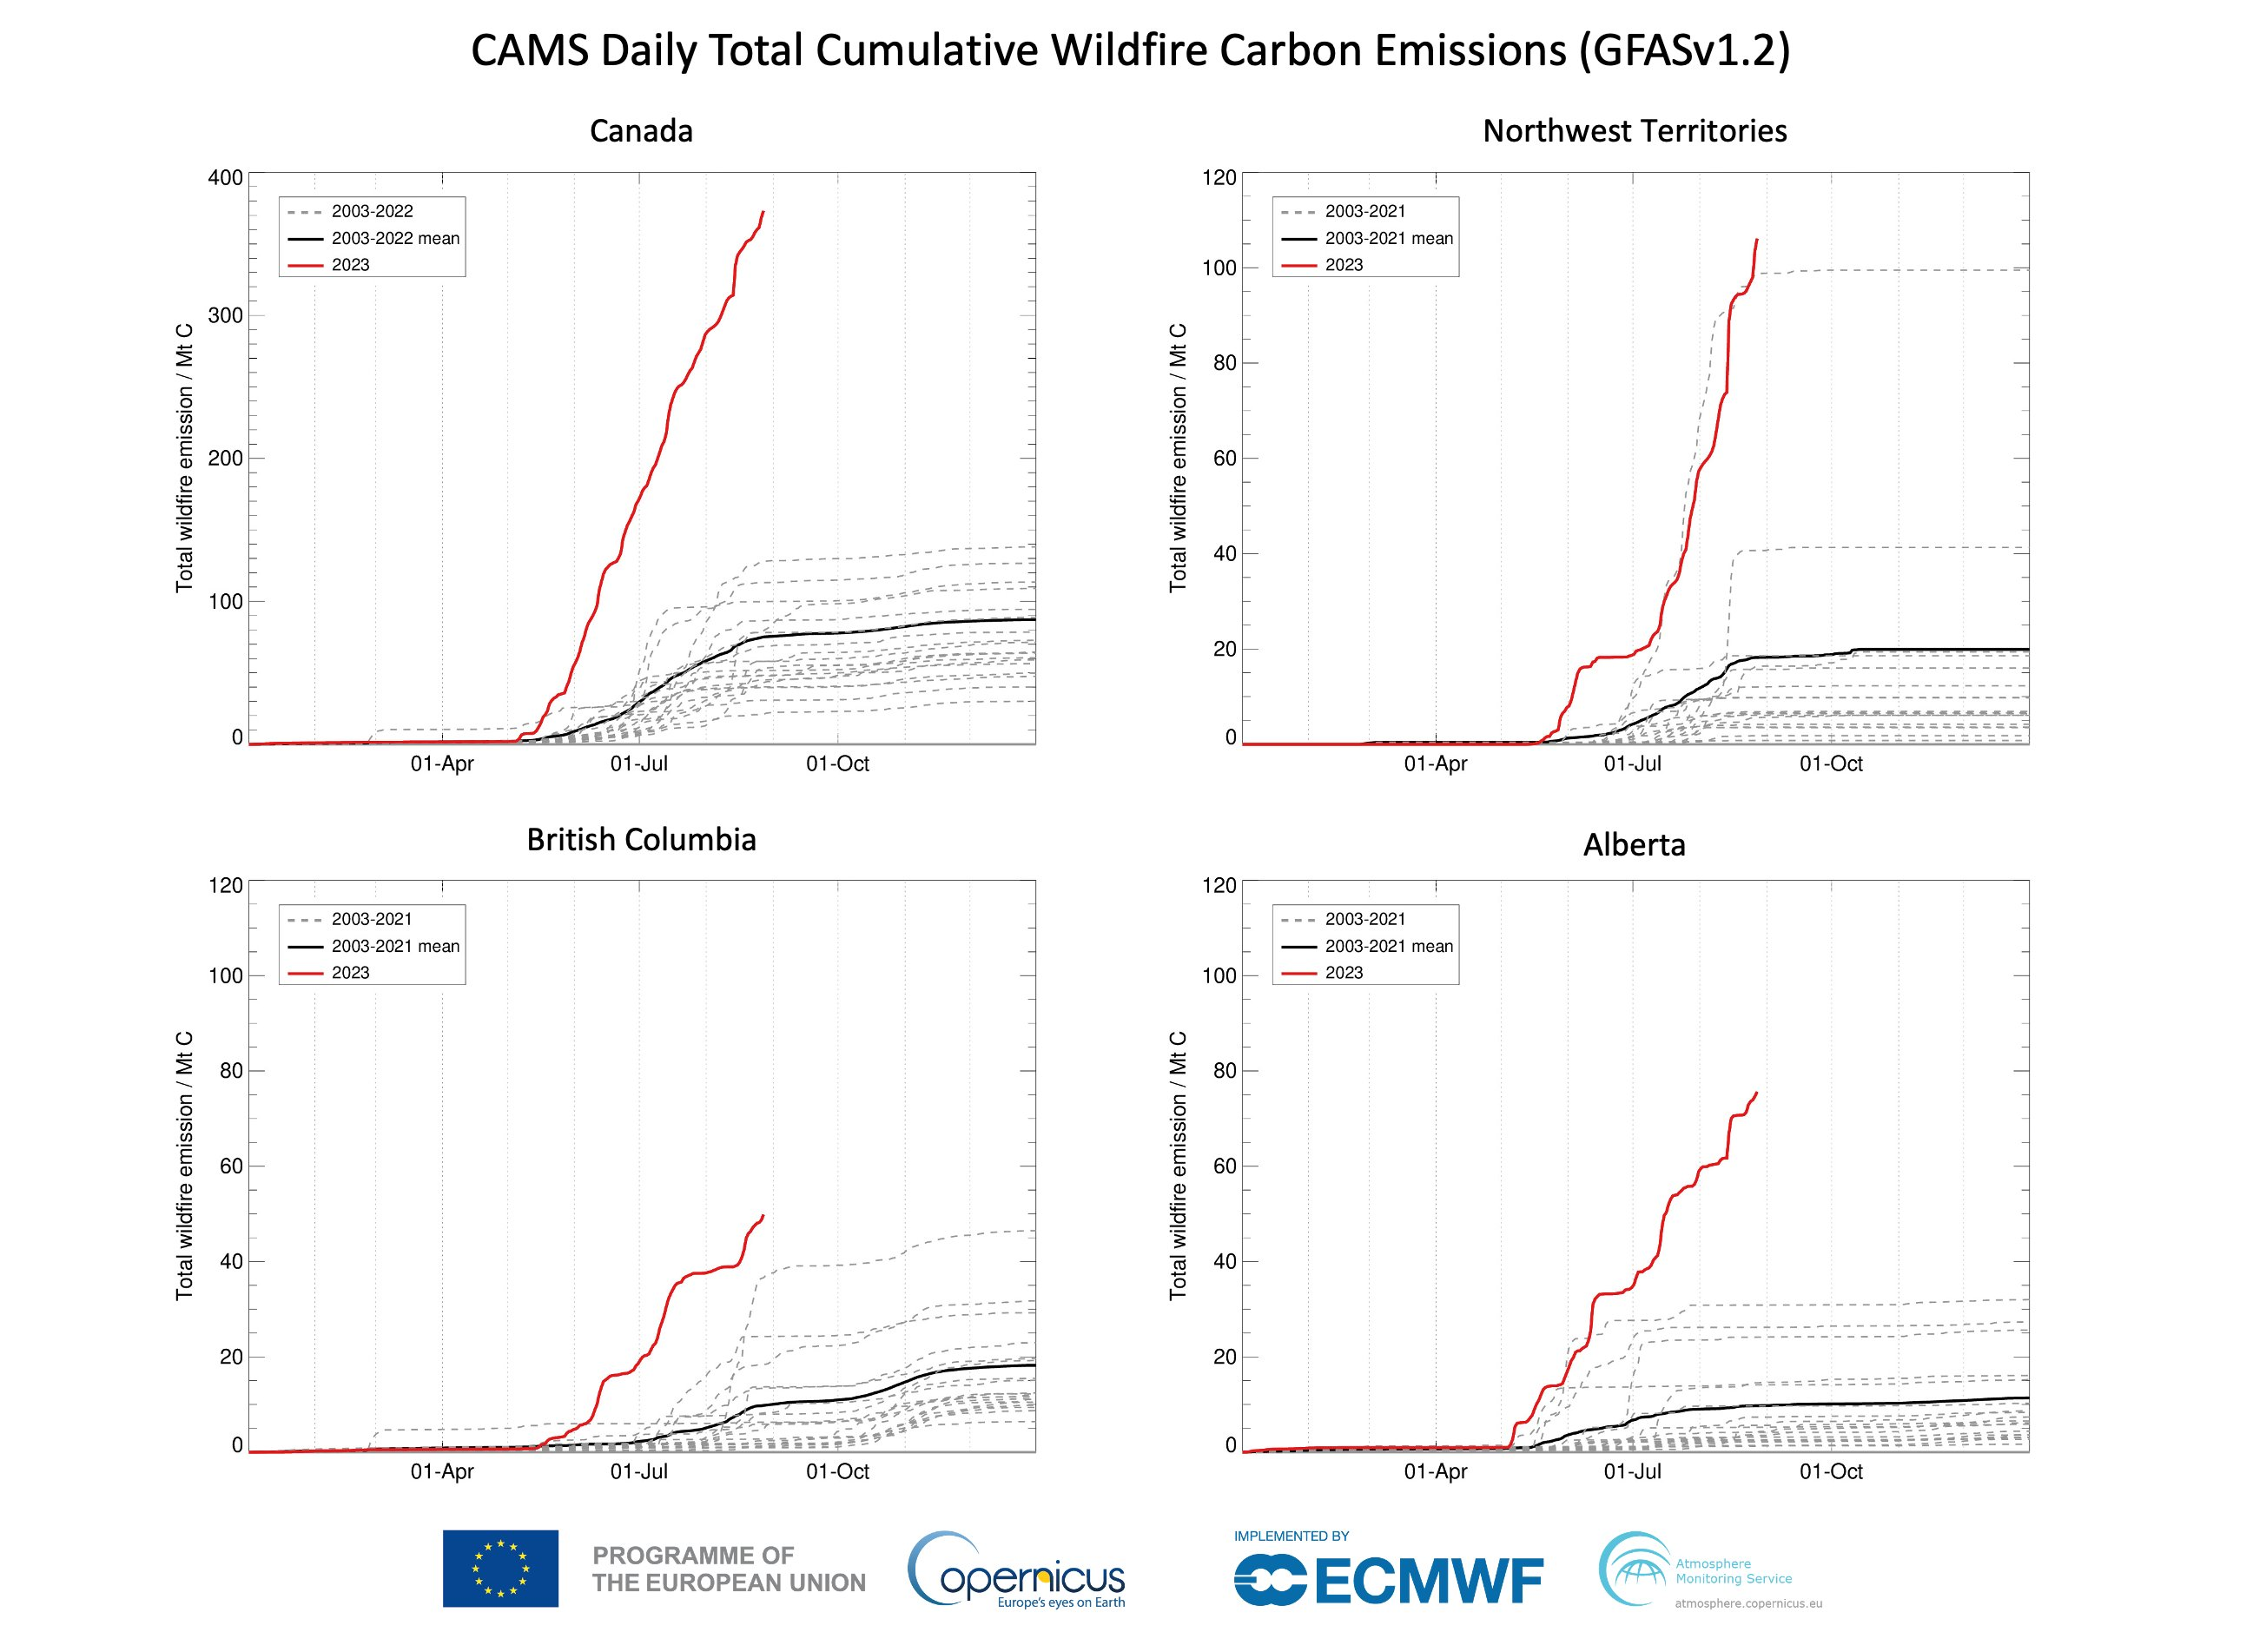
By David Wallace-Wells 6 September 2023 (The New York Times) – Canadian wildfires have this year burned a land area larger than 104 of the world’s 195 countries. The carbon dioxide released by them so far is estimated to be nearly 1.5 billion tons — more than twice as much as Canada releases through transportation, […]

CAMS Daily total cumulative carbon emissions from Canada wildfires in 2023, compared with emissions since 2003. Data for 2023 are current through 28 August 2023. Growth in fire emissions have surpassed 2014 to set a new record for the last two decades. Graphic: Mark Parrington / Copernicus Atmosphere Monitoring Service

Wildfires in Canada’s Northwest Territories have released 97 megatons of carbon, 277 times what its people emit – Emissions from wildfires across Canada in 2023 vastly exceed the 2014 record

By Liny Lamberink 28 August 2023 (CBC News) – Wildfires in the N.W.T have emitted 97 megatonnes of carbon into the air so far this year — 277 times more than what was caused by humans in the territory back in 2021. Mark Parrington, a senior scientist working at the European Union’s Copernicus Atmosphere Monitoring Service (CAMS), […]

a, Volume transport. Black symbols show estimates ± calculated total uncertainty made using joint mooring-model-hydrographic method (square/triangle/circle symbols, 84° E/140° E/170° E; equation (2), Extended Data Fig. 7 and Supplementary Section 2). White symbols show comparative estimates from other studies11,24,47,48,49,50 (Supplementary Table 3). Blue line, total volume transport for time periods of 1994–1996, 2007–2011 and 2016–2018, which estimates the strength of the lower limb of overturning circulation in the Australian Antarctic Basin (shading shows total error of 1.2 Sv; Supplementary Table 2). b, Oxygen transport. Black line, total oxygen transport that estimates abyssal ventilation ± total uncertainty of 290 Sv mol kg−1 (equation (3)). c, Comparison of lower limb of overturning circulation and shelf salinities from a site of DSW formation in Ross Sea (Terra Nova Bay; refs. 12,13,35). Dotted blue arrows show declining trend in overturning for 1994–2009 and 1994–2017 that have uncertainties of ±0.5 Sv decade−1. Graphic: Gunn, et al., 2023 / Nature Climate Change

Deep ocean currents around Antarctica headed for collapse – “Such profound changes to the ocean’s overturning of heat, freshwater, oxygen, carbon, and nutrients will have a significant adverse impact on the oceans for centuries to come”

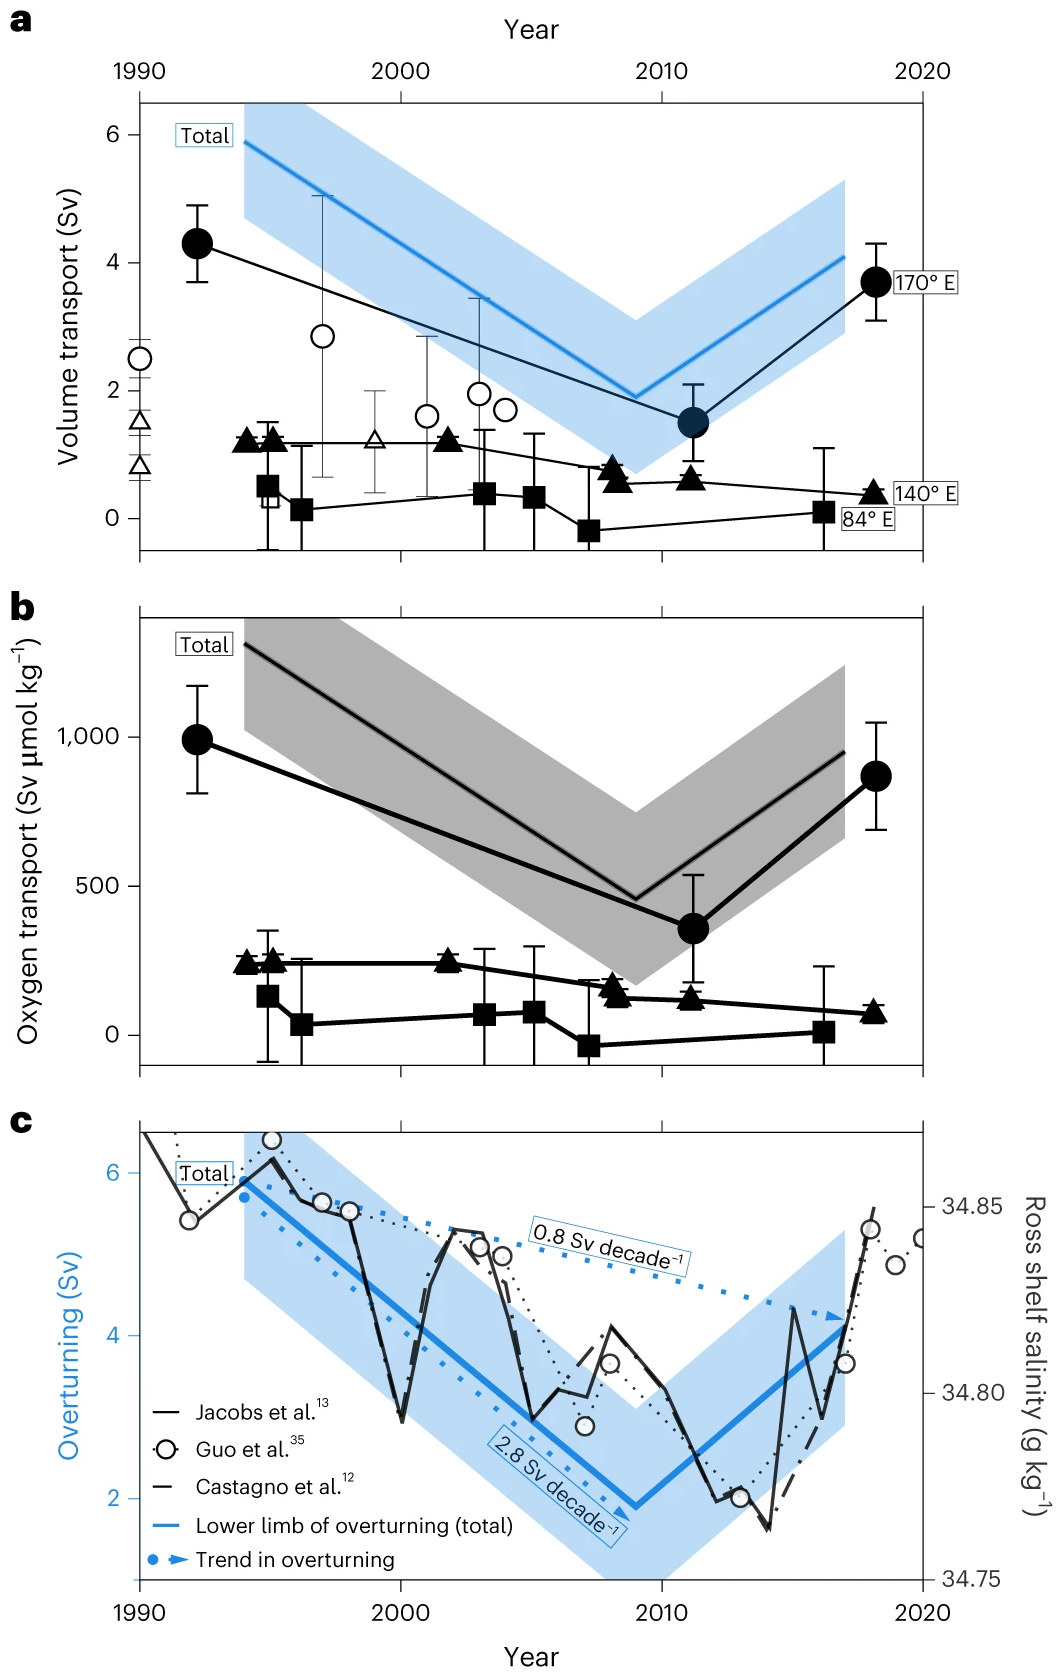
By Kathy Gunn, Matthew England, and Steve Rintoul 25 May 2023 (The Conversation) – Antarctica sets the stage for the world’s greatest waterfall. The action takes place beneath the surface of the ocean. Here, trillions of tonnes of cold, dense, oxygen-rich water cascade off the continental shelf and sink to great depths. This Antarctic “bottom […]

Geographical distribution of the measured mass light absorption coefficient (at 365 nm, babs-365, Mm−1, M = 10−6) of water-soluble brown carbon (BrC) in the circum-Arctic. The data dots are plotted at the middle of each sample. The shading was interpolated based on the measurements using the Data-Interpolating Variational Analysis method in the software Ocean Data View. The color range is set as the 10th and 90th percentiles of babs-365. The observed babs-365 of water-soluble BrC at Utqiaġvik (formerly Barrow) from August to September (2012) for PM10 samples (diamond) and at Alert from May to early June (1991) for total suspended samples (square) is also shown for comparison. Graphic: Yue, et al., 2022 / One Earth

Brown carbon from biomass burning imposes strong Arctic warming feedback – “We expect an increasing importance of brown carbon in the warming of the circum-arctic in the future”

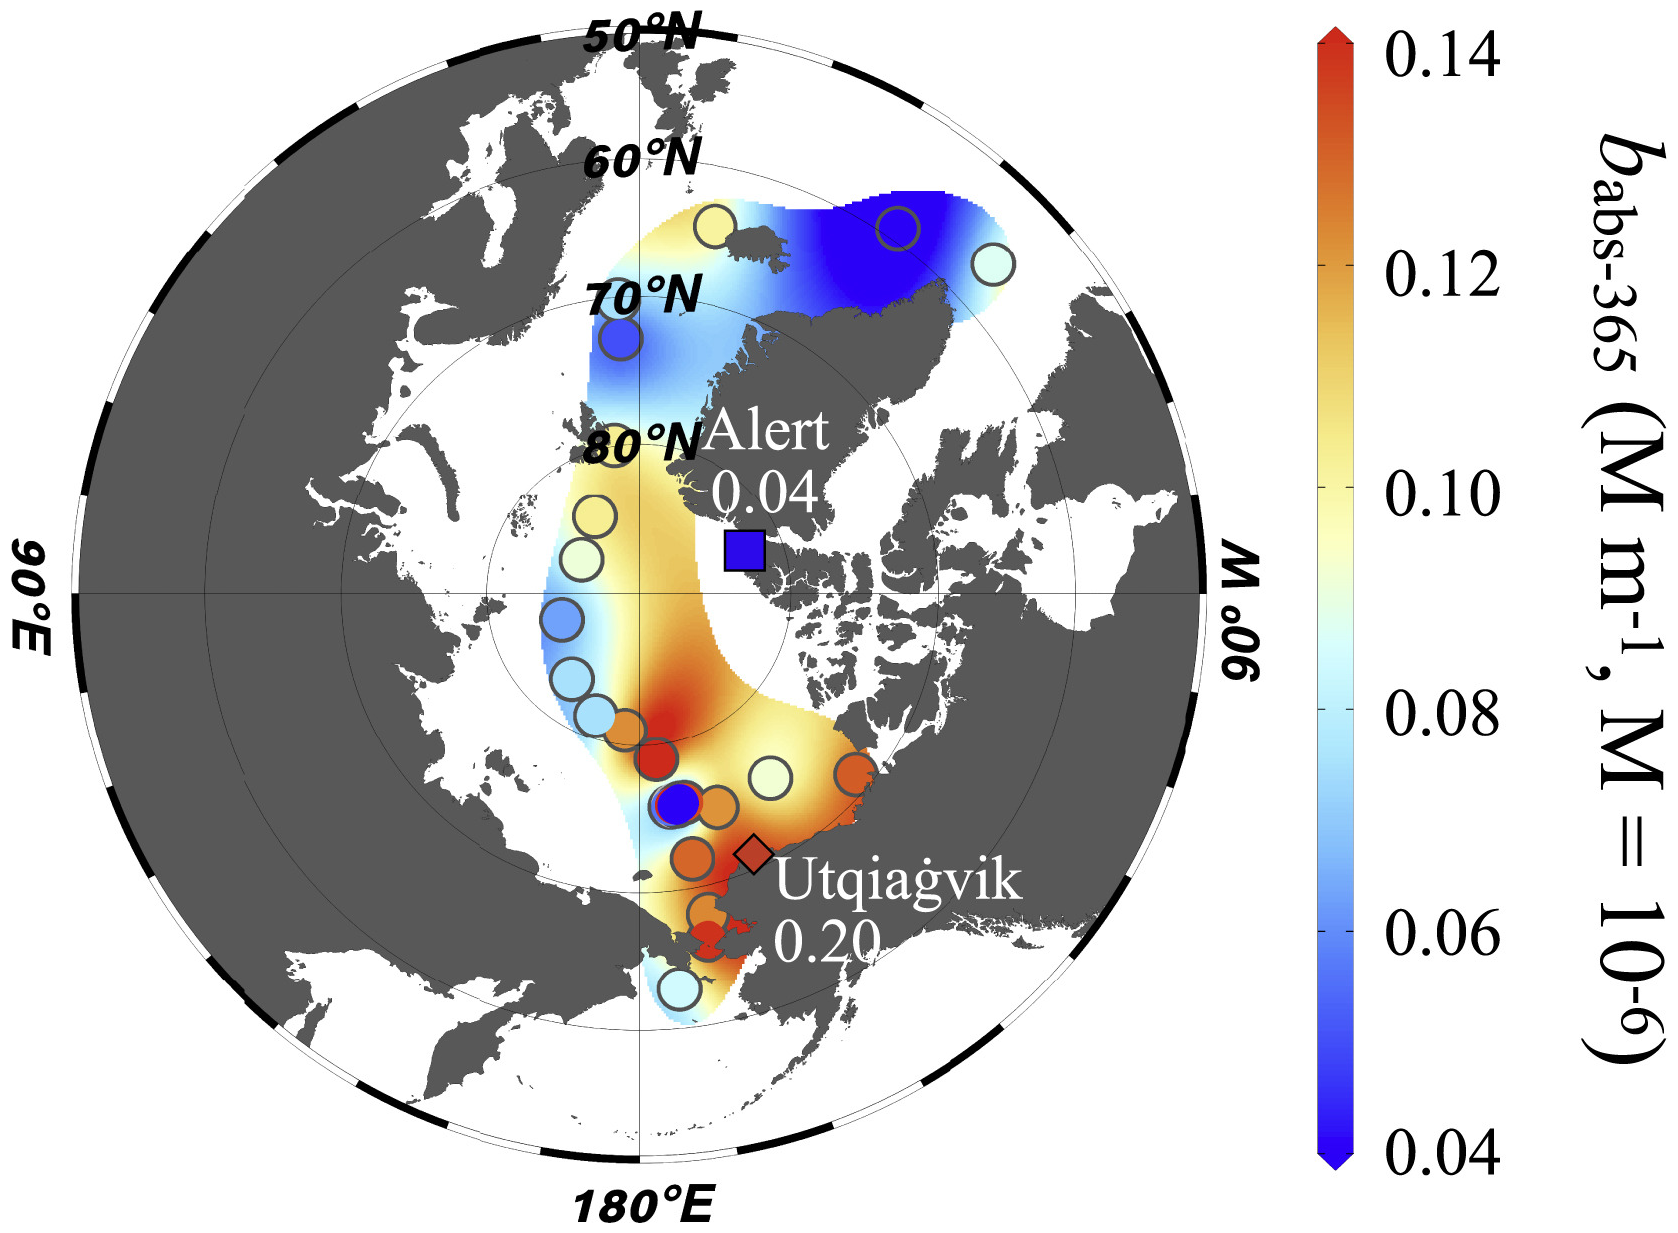
18 March 2022 (Max Planck Institute for Chemistry) – Rapid warming in the Arctic and accelerated glacier and sea ice melting have a huge impact on the global environment. Greenhouse gases, such as carbon dioxide, and black carbon aerosols are well-known warming agents. In contrast, atmospheric, light absorbing brown carbon particles belong to the least […]

Black carbon mass density over North America from GEOS-5, 21 July 2021. Smoke from wildfires in the U.S. West poured into the eastern U.S. on 20-21 July 2021. In New York City, levels of fine particulate pollution rose above 170 on the air quality index, a level considered harmful even for healthy people. Data: GEOS-5 data from the Global Modeling and Assimilation Office at NASA GSFC. Graphic: Joshua Stevens / NASA Earth Observatory

Skies turn hazy from Pittsburgh to Washington to Boston, as smoke from fires in Canada pour into the U.S. Northeast

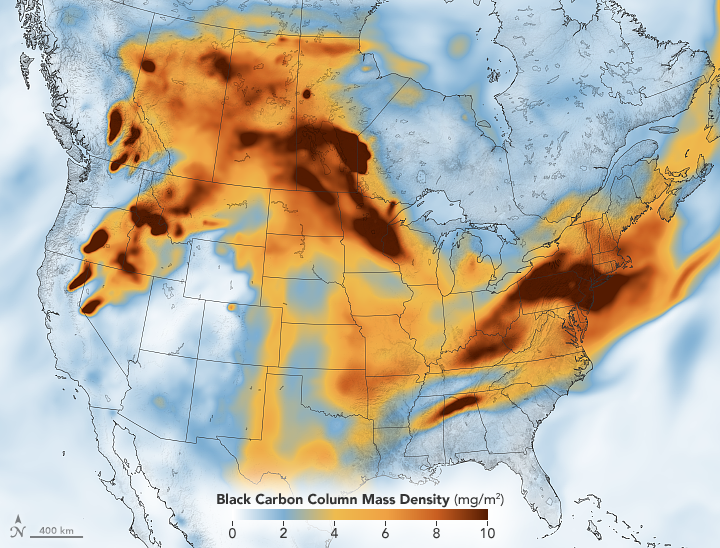
By Adam Voiland 23 July 2021 (NASA) – While plumes of wildfire smoke from western North America have passed over the northeastern U.S. and Canada multiple times each summer in recent years, they often go unnoticed. That is because smoke that spreads far from its source typically moves at a fairly high altitude—between 5 and 10 kilometers—as […]

World consumption of primary energy in exajoules, 1994-2019. Primary energy consumption rose by 1.3 percent in 2019, less than half its rate in 2018 (2.8 percent). Growth was driven by renewables (3.2 EJ) and natural gas (2.8 EJ), which  together contributed three quarters of the increase. All fuels grew at a slower rate than their 10-year averages, apart from nuclear, with coal consumption falling for the fourth time in six years (-0.9 EJ). By region, consumption fell in North America, Europe and CIS, and growth was below average in South and Central America. In the other regions, growth was roughly in line with historical averages. China was the biggest individual driver of primary energy growth, accounting for more than three  quarters of net global growth. Oil continues to hold the largest share of the energy mix (33.1 percent). Coal is the  second largest fuel but lost share in 2019 to account for 27.0 percent, its lowest  level since 2003. The share of both natural gas and renewables rose to record highs of 24.2 percent and 5.0 percent respectively. Renewables has now overtaken nuclear, which makes up only 4.3 percent of the energy mix. The share of hydroelectricity has been stable at around 6 percent for several years. Graphic: BP

BP Statistical Review of World Energy 2020: Carbon emissions increase for another year, coal still the single largest source of power generation

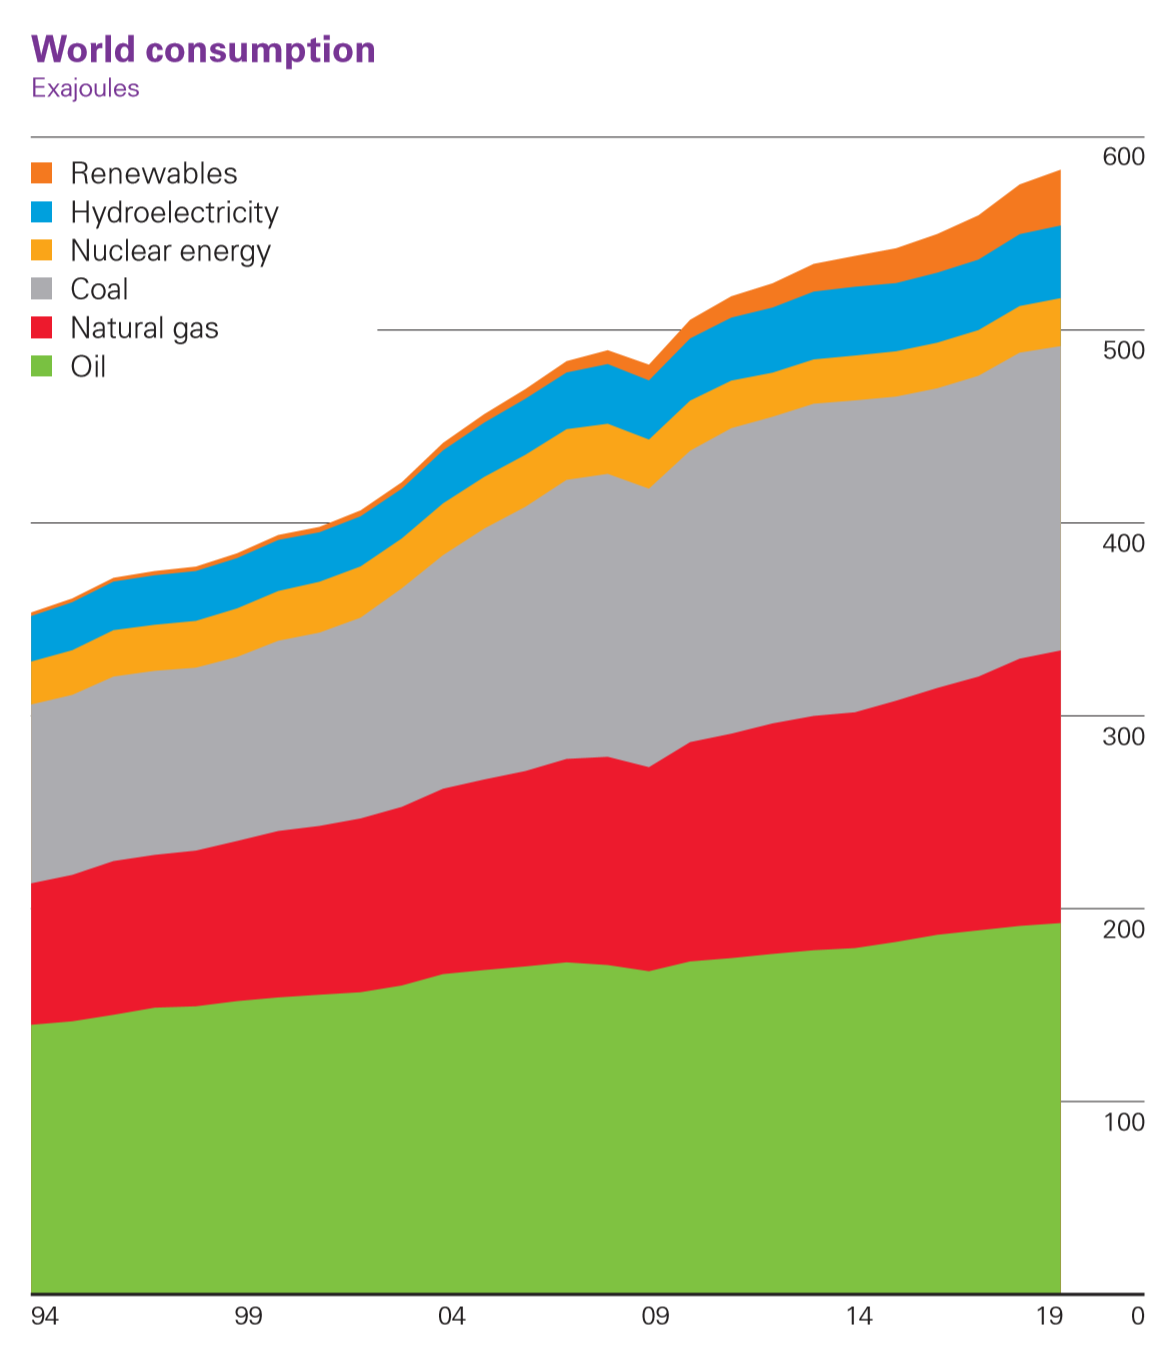
By Bernard Looney 17 June 2020 (BP) – The COVID-19 pandemic may well turn out to be the most tragic and disruptive event that many of us will ever live through. As I write this – in the middle of June – over 400 thousand people globally have lost their lives to the infection. Millions […]

Excitation near the saddle-node bifurcation and steady-state solutions for global carbon cycle model. Graphic: Rothman, 2019 / PNAS

Breaching carbon threshold could lead to mass extinction – Carbon dioxide emissions may trigger “reflex” in global carbon cycle, with devastating consequences

By Jennifer Chu 8 July 2019 (MIT News) – In the brain, when neurons fire off electrical signals to their neighbors, this happens through an “all-or-none” response. The signal only happens once conditions in the cell breach a certain threshold. Now an MIT researcher has observed a similar phenomenon in a completely different system: Earth’s […]

Gas storage tanks receiving natural gas from feeder pipelines before compression for transport in high-pressure pipelines at the Haynseville shale formation, Texas. This photo was taken with a forward-looking infrared (FLIR) camera tuned to the infrared spectrum of methane, allowing visualization of methane, which is invisible in the normal camera view and to the naked eye. Photo: Sharon Wilson / Howarth, 2019 / Biogeosciences

Fracking prompts global spike in atmospheric methane – “This recent increase in methane in massive”

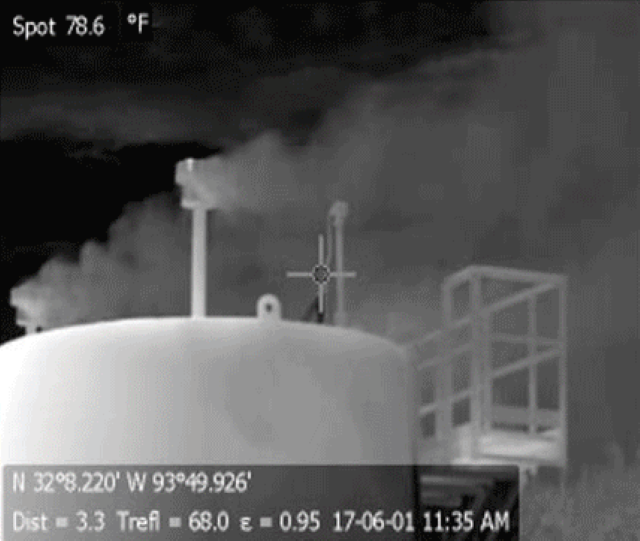
By Blaine Friedlander 14 August 2019 (Cornell Chronicle) – As methane concentrations increase in the Earth’s atmosphere, chemical fingerprints point to a probable source: shale oil and gas, according to new Cornell research published 14 August 2019 in Biogeosciences, a journal of the European Geosciences Union. The research suggests that this methane has less carbon-13 relative […]

Animation showing the concentration of black carbon particulates — commonly called soot — around the Arctic from 1 July 2019 to 29 July 2019. Graphic: Lauren Dauphin / NASA Earth Observatory

Arctic fires fill Northern Hemisphere skies with soot

By Kasha Patel 1 August 2019 (NASA) – In June and July 2019, more than 100 long-lived and intense wildfires blazed within the Arctic Circle. Most of them burned in Alaska and Siberia, though a few raged even in Greenland. As these fires lofted thick plumes of smoke into the skies, they also launched megatons of tiny, harmful particles into the […]

Social media & sharing icons powered by UltimatelySocial