World consumption of primary energy in exajoules, 1994-2019. Primary energy consumption rose by 1.3 percent in 2019, less than half its rate in 2018 (2.8 percent). Growth was driven by renewables (3.2 EJ) and natural gas (2.8 EJ), which  together contributed three quarters of the increase. All fuels grew at a slower rate than their 10-year averages, apart from nuclear, with coal consumption falling for the fourth time in six years (-0.9 EJ). By region, consumption fell in North America, Europe and CIS, and growth was below average in South and Central America. In the other regions, growth was roughly in line with historical averages. China was the biggest individual driver of primary energy growth, accounting for more than three  quarters of net global growth. Oil continues to hold the largest share of the energy mix (33.1 percent). Coal is the  second largest fuel but lost share in 2019 to account for 27.0 percent, its lowest  level since 2003. The share of both natural gas and renewables rose to record highs of 24.2 percent and 5.0 percent respectively. Renewables has now overtaken nuclear, which makes up only 4.3 percent of the energy mix. The share of hydroelectricity has been stable at around 6 percent for several years. Graphic: BP
World consumption of primary energy in exajoules, 1994-2019. Primary energy consumption rose by 1.3 percent in 2019, less than half its rate in 2018 (2.8 percent). Growth was driven by renewables (3.2 EJ) and natural gas (2.8 EJ), which together contributed three quarters of the increase. All fuels grew at a slower rate than their 10-year averages, apart from nuclear, with coal consumption falling for the fourth time in six years (-0.9 EJ). By region, consumption fell in North America, Europe and CIS, and growth was below average in South and Central America. In the other regions, growth was roughly in line with historical averages. China was the biggest individual driver of primary energy growth, accounting for more than three  quarters of net global growth. Oil continues to hold the largest share of the energy mix (33.1 percent). Coal is the  second largest fuel but lost share in 2019 to account for 27.0 percent, its lowest  level since 2003. The share of both natural gas and renewables rose to record highs of 24.2 percent and 5.0 percent respectively. Renewables has now overtaken nuclear, which makes up only 4.3 percent of the energy mix. The share of hydroelectricity has been stable at around 6 percent for several years. Graphic: BP

By Bernard Looney
17 June 2020

(BP) – The COVID-19 pandemic may well turn out to be the most tragic and disruptive event that many of us will ever live through. As I write this – in the middle of June – over 400 thousand people globally have lost their lives to the infection. Millions more might have done so without the widespread lockdown of economies across the world, which came at huge economic and social cost. [Download Statistical Review of World Energy pdf]

This combined health and economic shock is bound to reshape the global economic, political and social environment in which we all live and work. It has the potential to accelerate emerging trends and create opportunities to shift the world onto a more sustainable path. But it also risks slowing progress if the short-term, domestic issues raised by COVID-19 are prioritized over long-term, global challenges, such as climate change. It feels like the world is at a pivotal moment: it needs to address these short-term concerns but in a way that builds back better.

In that context, this year’s edition of bp’s Statistical Review of World Energy provides a timely reminder of global energy trends prior to the crisis.

Renewable energy consumption by region in exajoules, 1994-2019. Renewable energy consumption (including biofuels but excluding hydro) grew by 12.1 percent, below its historical average, although its increase in energy terms (3.2 EJ) was  the highest on record and the largest for any fuel in 2019. By country, China was the largest contributor to renewables growth (0.8 EJ), followed by the US (0.3 EJ) and  Japan (0.2 EJ). Wind provided the largest contribution to the growth of renewables electricity generation (160 TWh) followed closely by solar (140 TWh). Solar has constantly increased its share of renewable generation and now makes up 26 percent compared with only 14 percent five years earlier. Graphic: BP
Renewable energy consumption by region in exajoules, 1994-2019. Renewable energy consumption (including biofuels but excluding hydro) grew by 12.1 percent, below its historical average, although its increase in energy terms (3.2 EJ) was the highest on record and the largest for any fuel in 2019. By country, China was the largest contributor to renewables growth (0.8 EJ), followed by the US (0.3 EJ) and Japan (0.2 EJ). Wind provided the largest contribution to the growth of renewables electricity generation (160 TWh) followed closely by solar (140 TWh). Solar has constantly increased its share of renewable generation and now makes up 26 percent compared with only 14 percent five years earlier. Graphic: BP

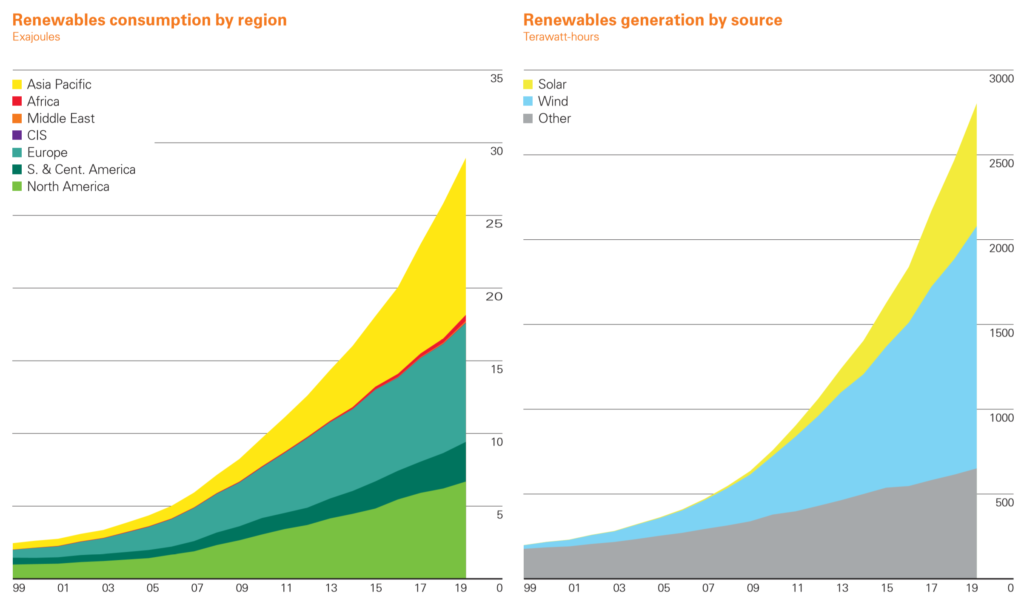
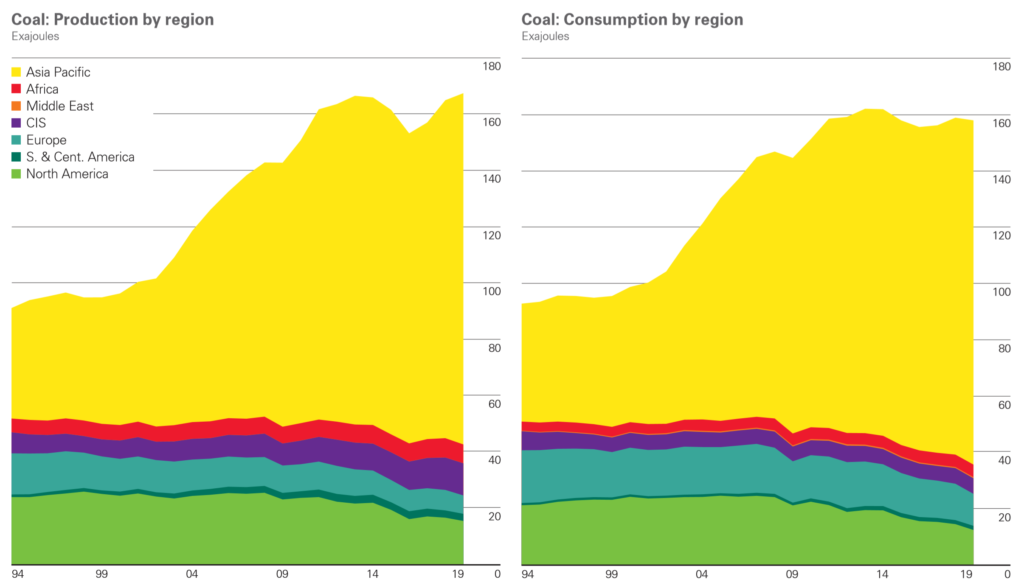
Some aspects are encouraging – particularly the continuing strong growth of renewable energy. Led by wind and solar power, renewable energy increased by a record amount, accounting for over 40% of the growth in primary energy in 2019. At the same time, coal consumption fell for the fourth time in the past six years, with its share in the global energy mix falling to its lowest level for 16 years.

But other aspects of the energy system continued to give cause for concern. Despite last year’s decline, coal was still the single largest source of power generation, accounting for over 36% of global power. That compares with just 10% provided by renewable energy. Renewables will need to grow even more strongly over the next three decades to decarbonize the power sector.

Oil consumption by region, million barrels daily, 1994-2019. World oil production fell by 60,000 b/d in 2019 as strong growth in US output (1.7 million b/d) was more than offset by a decline in OPEC production (-2 million b/d), with sharp declines in Iran (-1.3 million b/d) Venezuela (-560,000 b/d) and Saudi Arabia (-430,000 b/d). Oil consumption grew by a below-average 0.9 million barrels per day (b/d), or 0.9 percent. Growth was led by China (680,000 b/d) and other emerging economies, while demand fell in the OECD (-290,000 b/d). Graphic: BP

More worrying is the trend for carbon emissions. The slowing in the growth of carbon emissions to 0.5% in 2019 may suggest some grounds for optimism. But this deceleration needs to be seen in the context of the big increase in carbon emissions in 2018 of 2.1%. The hope was that as the one-off factors boosting carbon emissions in 2018 unwound, carbon emissions would fall significantly. That fall did not happen. The average annual growth in carbon emissions over 2018 and 2019 was greater than its 10-year average. As the world emerges from the COVID-19 crisis it needs to make decisive changes to move to a more sustainable path.

The disruption to our everyday lives caused by the lockdowns has provided a glimpse of a cleaner, lower carbon world: air quality in many of the world’s most polluted cities has improved; skies have become clearer. The IEA (International Energy Agency) estimate that global CO2 emissions may fall by as much as 2.6 gigatonnes this year. That has come at considerable cost and as economies restart and our lives return to normal there is a risk that these gains will be lost.

Natural gas consumption by region, billion cubic metres, 1994-2019. Natural gas consumption increased by 78 billion cubic metres (bcm), or 2 percent, well below the strong growth seen in 2018 (5.3 percent). Growth was driven by the US (27 bcm) and China (24 bcm), while Russia and Japan saw the largest declines (10 and 8 bcm respectively). Gas production grew by 132 bcm (3.4 percent), with the US accounting for almost  two-thirds of this increase (85 bcm). Australia (23 bcm) and China (16 bcm) were also key contributors to growth. Graphic: BP

But to get to net zero by 2050, the world requires similar-sized reductions in carbon emissions every other year for the next 25 years. This can be achieved only by a radical shift in all our behaviours. By using resources and energy more efficiently. And by implementing the full range of zero and low carbon energies and technologies at our disposal – including renewable energies, electrification, hydrogen, CCUS (carbon capture use and storage), bioenergy and many more. These technologies exist today – the challenge is to use them at pace and scale.

At bp, we are committed to playing our part. In February, we adopted a new purpose – to reimagine energy for people and our planet. And we announced a new ambition, to be a net zero company by 2050 or sooner and to help the world get to net zero. The experience of COVID-19 has only reinforced our commitment to this purpose and ambition, by highlighting both the fragility of our planet and the opportunities it provides to truly build back better.

Coal consumption by region in exajoules, 1994-2019. World coal consumption fell by 0.6% (-0.9 EJ), its fourth decline in six years. In the non-OECD, there were notable increases in China (1.8 EJ), Indonesia (0.6 EJ) and  Vietnam (0.5 EJ), however, growth in India was only 0.3% (0.1 EJ) – its lowest since 2001. OECD demand fell sharply, led by the US (-1.9 EJ) and Germany (-0.6 EJ), to the lowest level in our data series (which goes back to 1965). Global coal production rose by 1.5%, with China and Indonesia providing the only significant increases  (3.2 EJ and 1.3 EJ respectively). The largest declines in production also came from the US (-1.1 EJ) and Germany (-0.3 EJ). Graphic: BP
Coal consumption by region in exajoules, 1994-2019. World coal consumption fell by 0.6% (-0.9 EJ), its fourth decline in six years. In the non-OECD, there were notable increases in China (1.8 EJ), Indonesia (0.6 EJ) and Vietnam (0.5 EJ), however, growth in India was only 0.3% (0.1 EJ) – its lowest since 2001. OECD demand fell sharply, led by the US (-1.9 EJ) and Germany (-0.6 EJ), to the lowest level in our data series (which goes back to 1965). Global coal production rose by 1.5%, with China and Indonesia providing the only significant increases (3.2 EJ and 1.3 EJ respectively). The largest declines in production also came from the US (-1.1 EJ) and Germany (-0.3 EJ). Graphic: BP

As bp along with the rest of the world navigate the energy transition, we will need timely, objective and comprehensive data on the global energy system. That is the role that the Statistical Review has been playing for the past 69 years and will continue to play in the future.

I hope this year’s Statistical Review is useful to everyone else seeking ways to get to net zero and build back better. And I would like to thank the very many people who help our economics team in compiling it, including the governments and statistical agencies around the world who have contributed their official data again this year. The Statistical Review would not be possible without your generous co-operation and transparency. Thank you.

Bernard Looney
Chief executive officer
June 2020

Statistical Review of World Energy