Warmer air and warmer water are combining to melt Greenland ice sheet – “This unfortunately adds to the overwhelming body of evidence showing the sensitivity of the Greenland ice sheet to climate change”
By Rachel Koning Beals
17 October 2022
(MarketWatch) – The Greenland ice sheet — one of the two most important glaciers of its kind on Earth — may be even more sensitive to the warming climate than scientists previously thought.
The findings, published in the journal Nature Geoscience, shed fresh light on the forces driving ice loss. Ice sheets are so large — in fact, they used to cover almost all of Earth — that their disappearance could push up ocean levels to a degree that even New York and San Francisco will have to prepare for a new normal.
By some measures, the Greenland ice sheet is losing an average of around 250 billion metric tons of ice per year, scientists say. These ice sheet losses are speeding up over time, studies have found, owed to two developments: warm air temperatures that cause melting to occur on the surface, as well as glaciers at the ice sheet’s edge crumbling into the sea, degraded by already warmer oceans.
And why are oceans warmer? Earth’s temperature has risen by 0.14° Fahrenheit (0.08° Celsius) per decade since 1880, but the rate of warming since 1981 is more than twice that: 0.32° F (0.18° C) per decade, the National Oceanic and Atmospheric Administration (NOAA) says. It’s being driven higher by the emissions put off by burning the fossil fuels CL00, +0.75% that power our cars and planes, and which also heat and cool our homes.
Until now, ice sheet losses had been mainly attributed to those warm ocean waters lapping at the edge of the ice. But the new research finds that rising air temperatures are a major influence, as well.
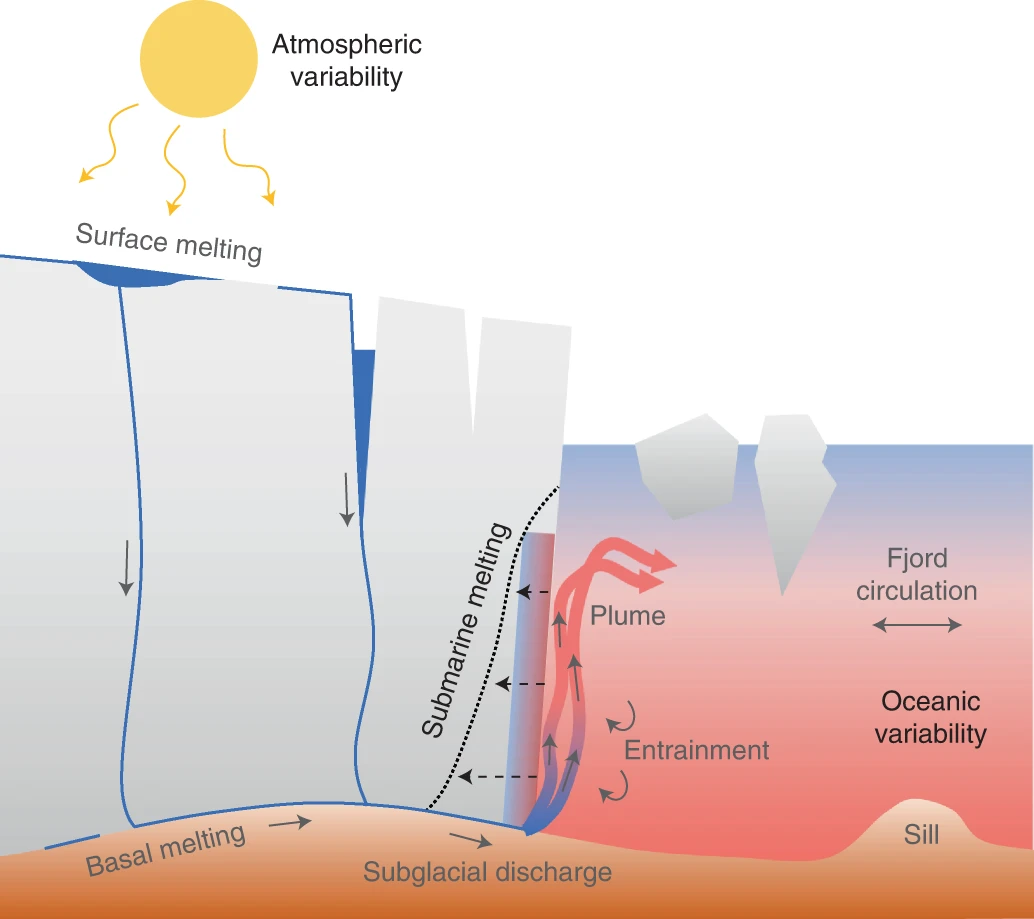
Donald Slater, a scientist at the University of Edinburgh and the lead study author, likened the process to ice cubes in a glass of water. They melt faster when the water is warmer. But they also melt faster when the water is stirred.
Why is the Greenland ice sheet important?
The Greenland and Antarctic ice sheets are the largest ice masses in the world, and play an important role in the global climate system.
The Antarctic ice sheet is the largest block of ice on Earth. It covers more than 5.4 million square miles and contains about 7.2 million cubic miles of water. The Antarctic ice sheet is about 1.2 miles thick; if it melted, sea level would rise by about 200 feet, putting coastal communities and habitats at extreme risk.
The Greenland ice sheet is much smaller than the Antarctic Ice sheet, only about 656,000 square miles. It is still the second-largest body of ice on the planet. According to NASA, 5 trillion tons of ice have melted over all of Greenland for approximately the past 15 years, enough to increase the global sea level by nearly an inch.
Both ice sheets have been losing mass at an increasing rate since the 1990s, which has contributed one third of the global sea level rise over this period. And major studies project further declines in the polar ice sheets in the future, but the degree of uncertainty is large. The outlook depends, in part, on how effective efforts to reduce coal, oil and natural gas-generating greenhouse gas emissions can be. Read more from the European Enviroment Agency. The United Nations has suggested that sea ice may decrease by 25% within the next century.
In a separate report issued earlier this year, scientists warned that Antarctica’s Thwaites Glacier is ‘holding on by its fingernails” because it is warming faster from underneath, putting stress on the ice shelf holding it in place. The glacier has been compared to Florida in size.
Scientists are particularly concerned about the effects that a melting ice sheet could have on some coastal U.S. cities, such as: New York City; Washington, D.C.; San Francisco; and New Orleans. These popular metro areas could become underwater cities if ice sheets melt enough to raise the sea level significantly. For certain, it’s already becoming more expensive or more complex to insure coastal properties, as well as those in the line of wildfires and floods.
What’s more, melting ice sheets put more fresh water into the oceans, and large additions of fresh water change the ocean ecosystems. Organisms, such as many types of corals, for example, depend on saltwater for survival. And greater fresh water pouring into the oceans may lead to a reduction in krill, the tiny crustaceans that kick off the Antarctic marine food chain that eventually feeds larger fish and land animals — and, of course, people. Read more on these impacts at National Geographic.
How has climate change melted ice sheets?
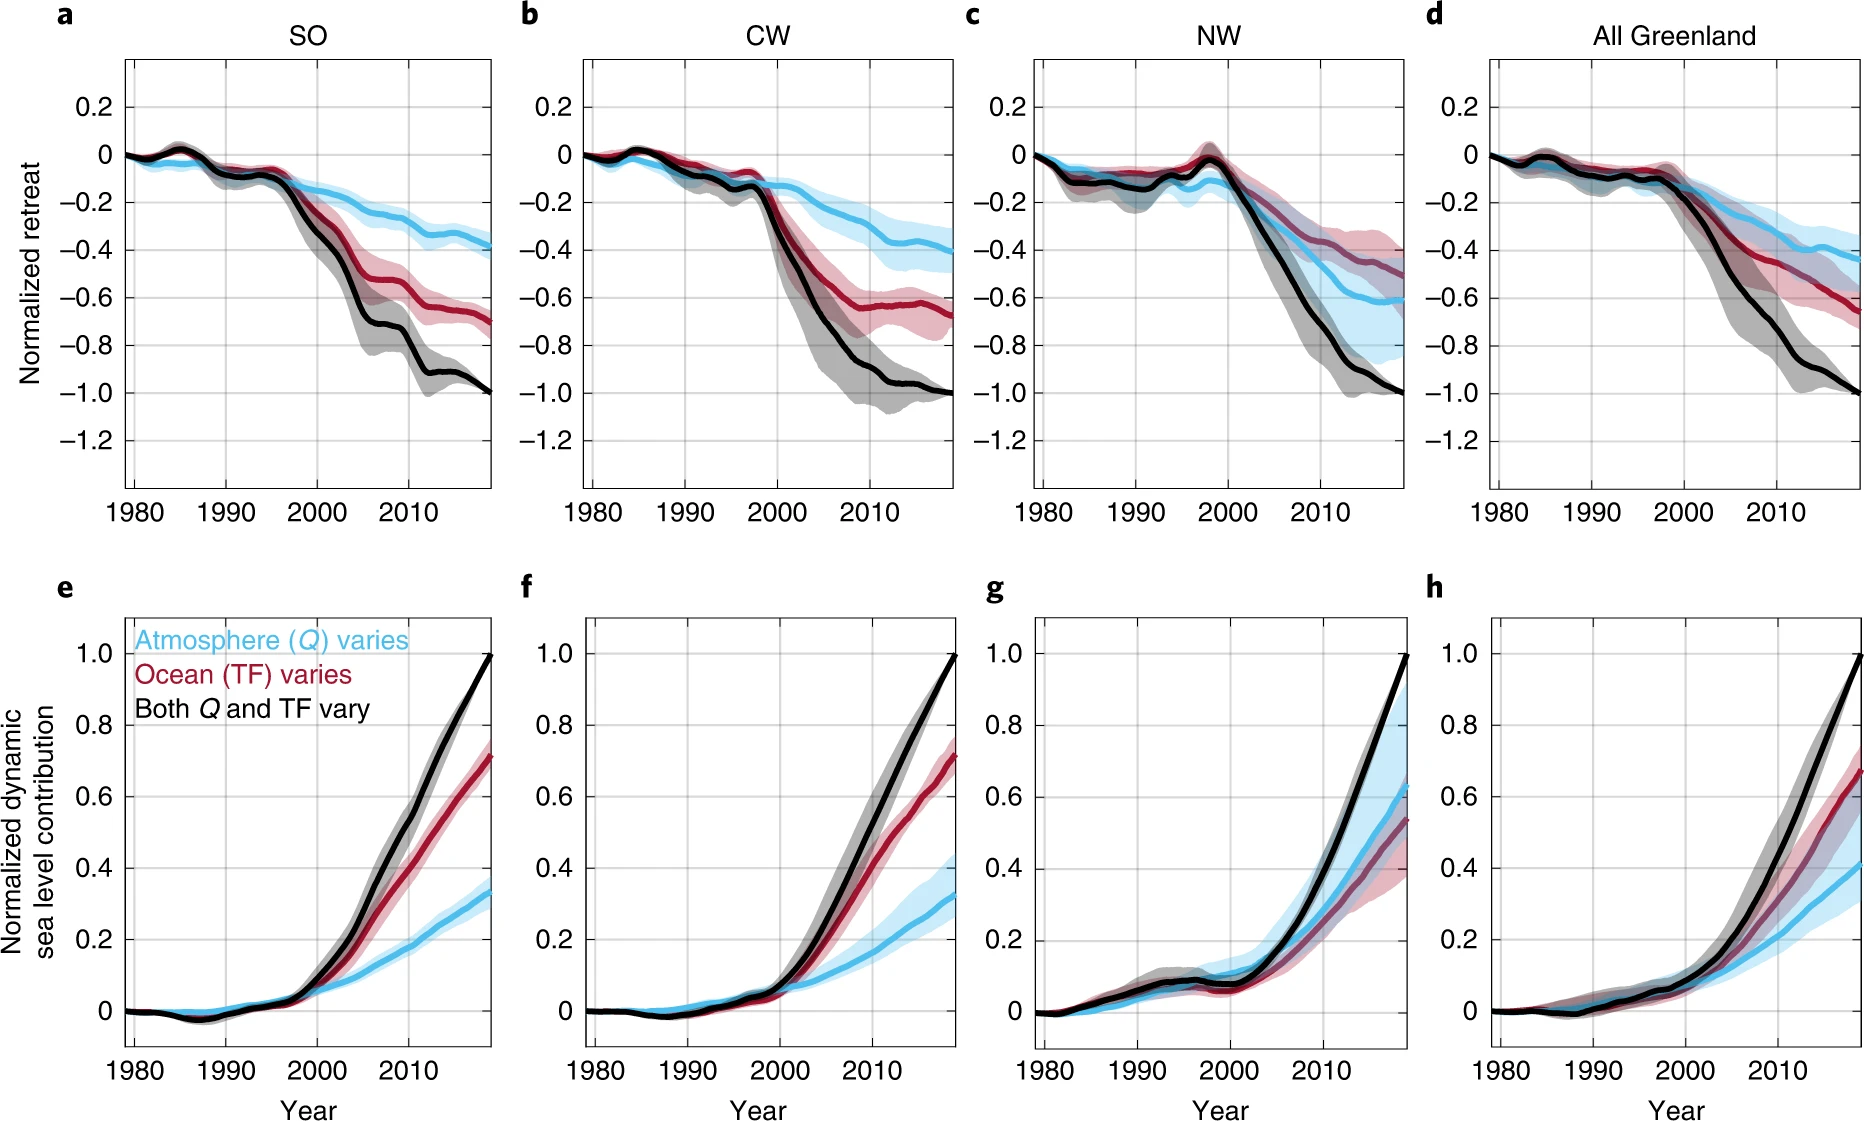
If the atmosphere hadn’t warmed over the last few decades, the new research finds, the retreat of Greenland’s glaciers as a whole likely would have been reduced by as much as a third. In northwestern Greenland, where the ocean waters breaking against the glaciers are much colder, the loss could have been reduced by as much as half.
“This unfortunately adds to the overwhelming body of evidence showing the sensitivity of the Greenland ice sheet to climate change, hence the need for urgent action to reduce greenhouse gas emissions,” Slater said.
The U.S. and other large nations have pledged to record sharp reductions in Earth-warming greenhouse gas (GHG) emissions by the end of this decade and to produce net-zero emissions by 2050, with major emitter China slightly behind the other economic giants. But an energy crisis in Europe and parts of Asia, sparked by Russia’s invasion of Ukraine, has revived the use of coal, natural gas NG00, -6.83% and other fossil fuels, especially in the short term.
U.N. reports indicate that without the more aggressive 2030 targets, most major economies aren’t moving fast enough to meet the 2050 net-zero commitments that have dominated political platforms of late.
For sure, higher seas could also cost both developed and developing nations in lost lives, lost business and recovery costs. A Deloitte analysis shows that insufficient action on climate change and global warming could cost the U.S. economy alone $14.5 trillion in the next 50 years. A loss of this scale is equivalent to nearly 4% of GDP, or $1.5 trillion in 2070 alone.
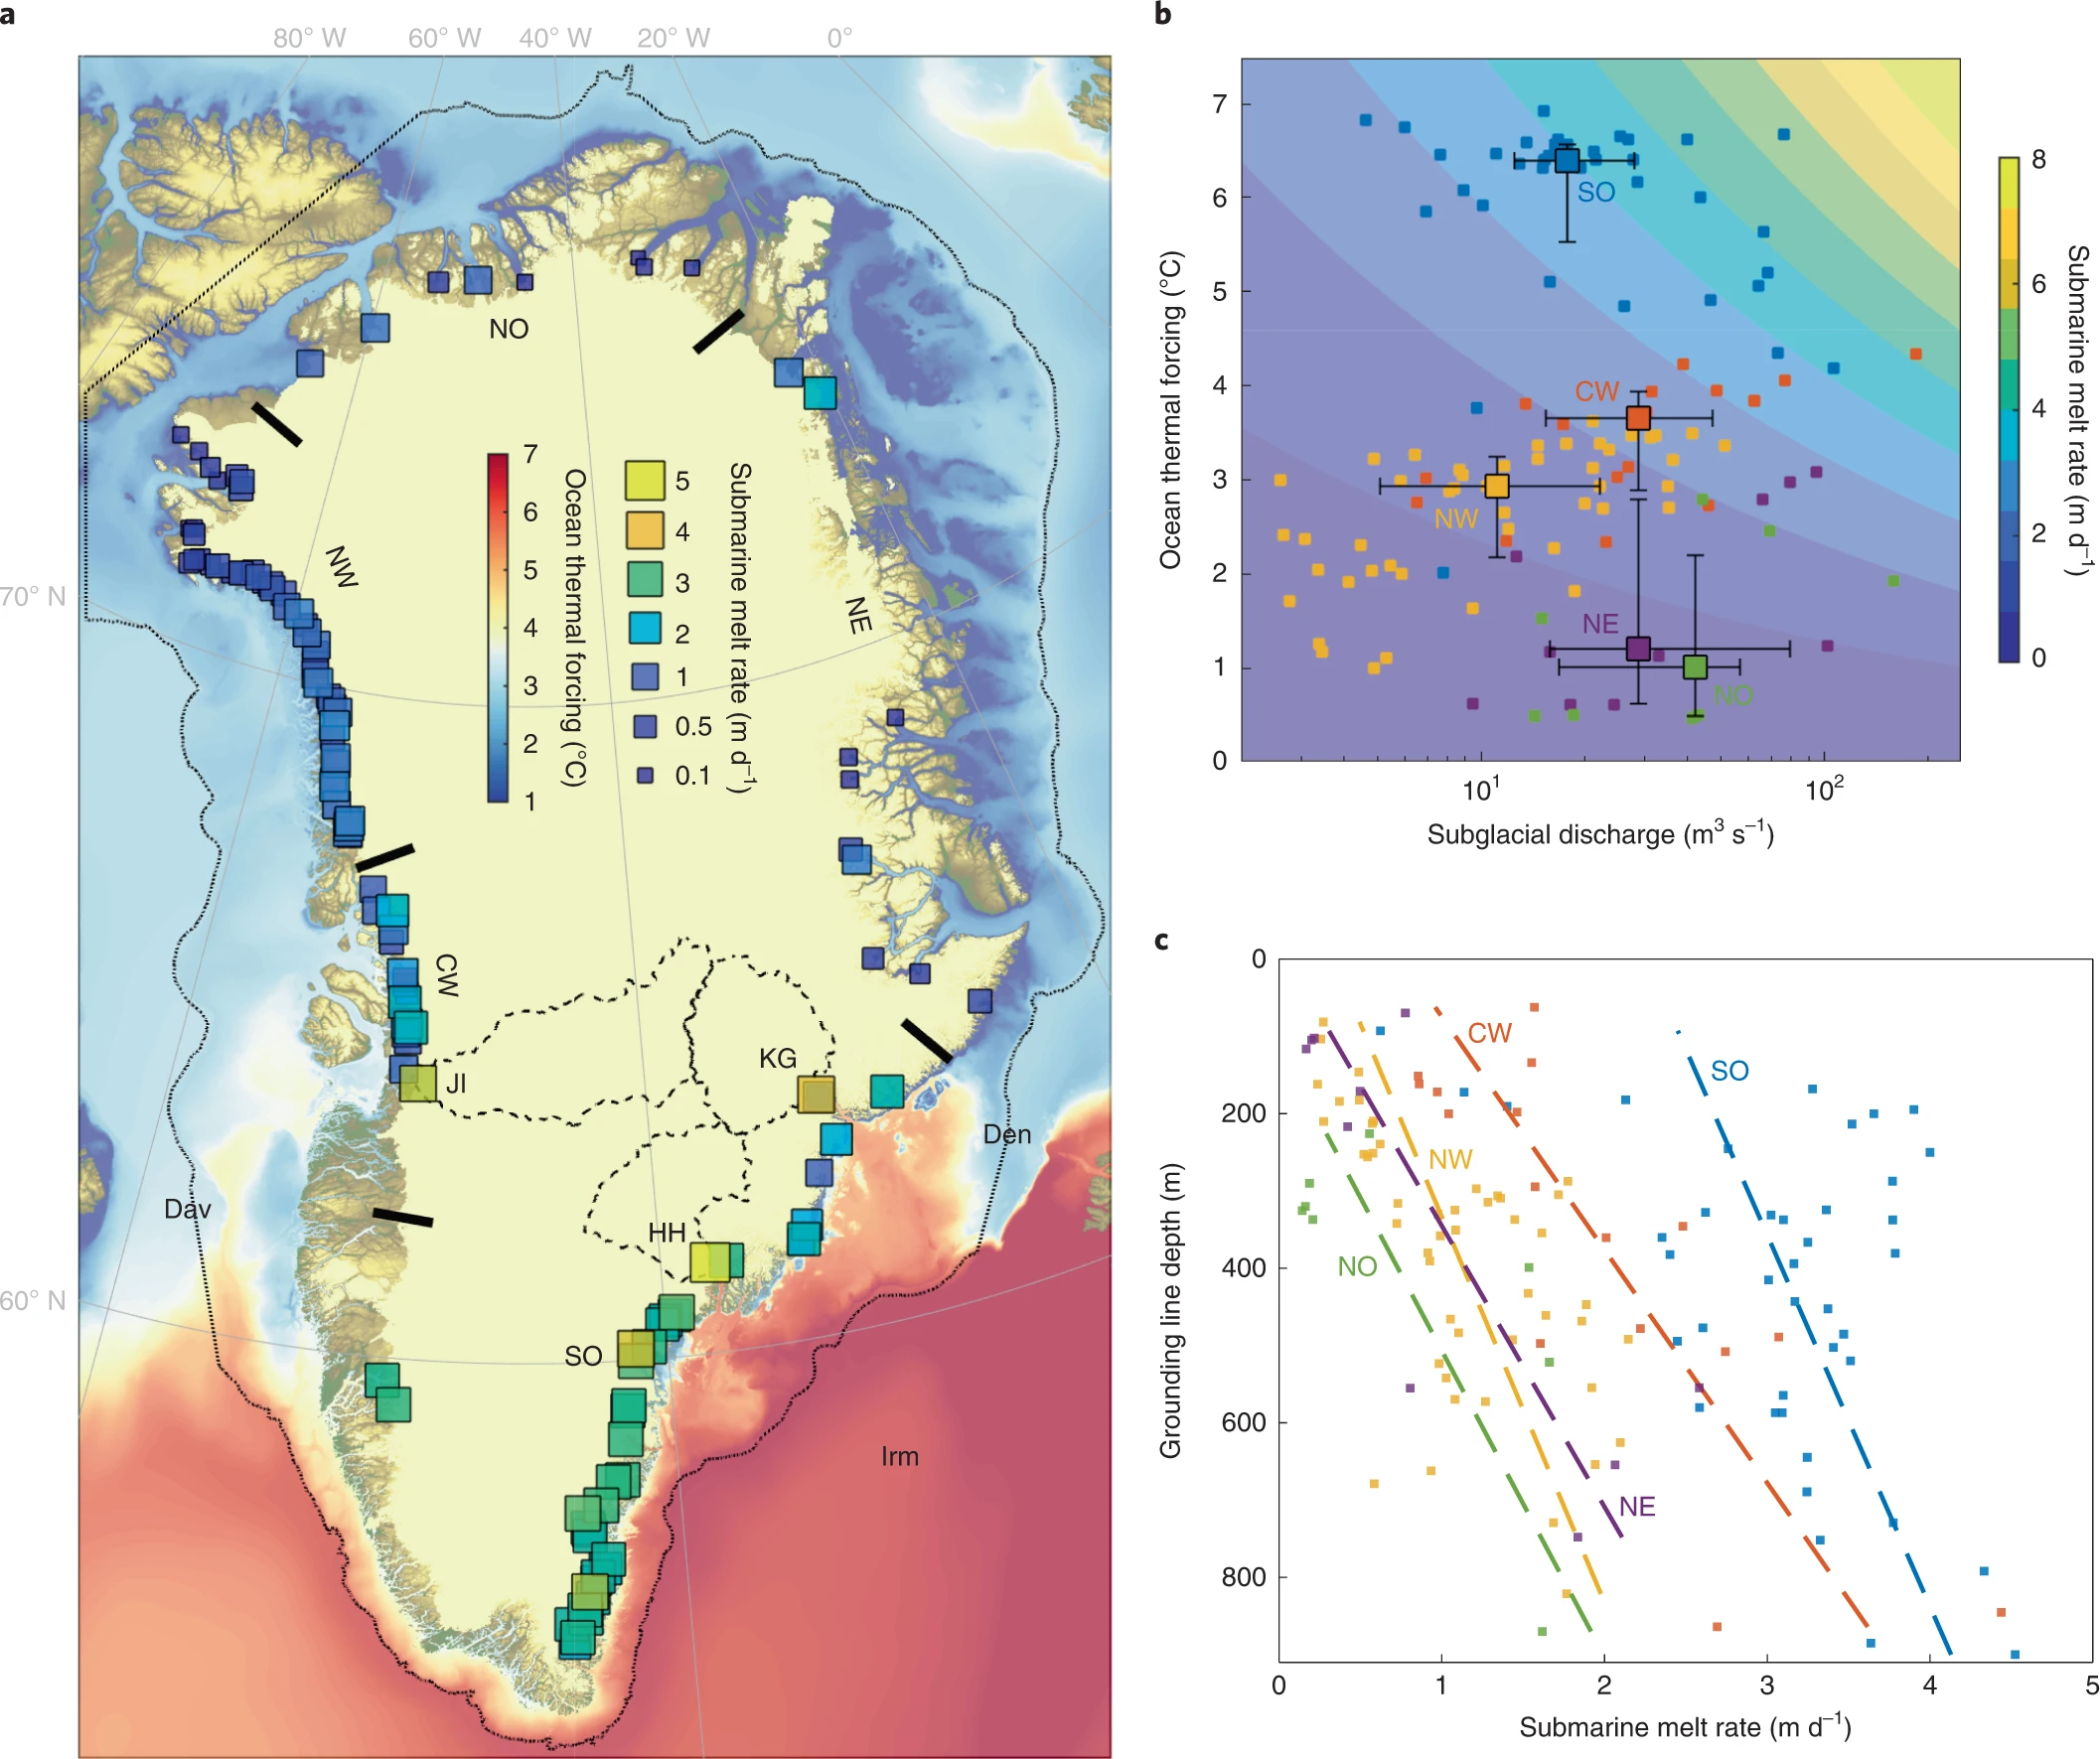
Submarine melting of glaciers in Greenland amplified by atmospheric warming
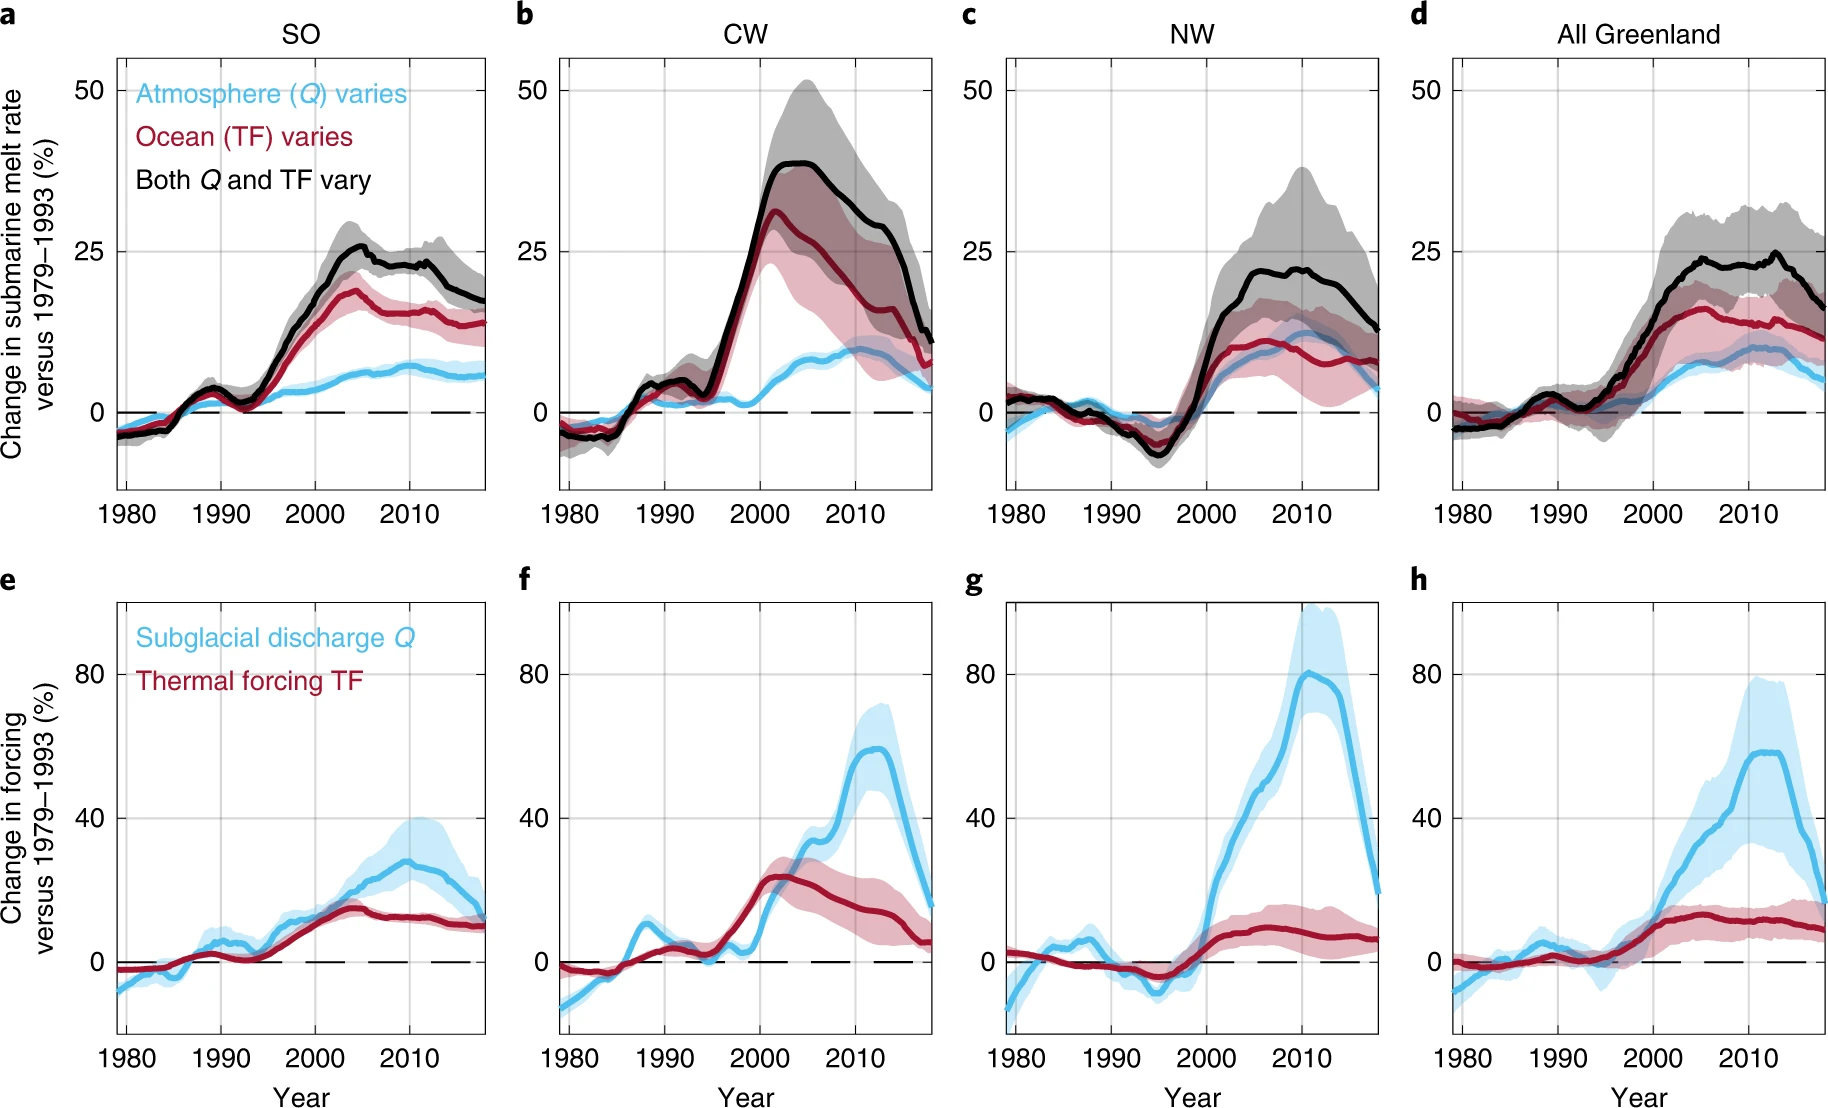
ABSTRACT: Rapid ice loss from the Greenland ice sheet since 1992 is due in equal parts to increased surface melting and accelerated ice flow. The latter is conventionally attributed to ocean warming, which has enhanced submarine melting of the fronts of Greenland’s marine-terminating glaciers. Yet, through the release of ice sheet surface meltwater into the ocean, which excites near-glacier ocean circulation and in turn the transfer of heat from ocean to ice, a warming atmosphere can increase submarine melting even in the absence of ocean warming. The relative importance of atmospheric and oceanic warming in driving increased submarine melting has, however, not been quantified. Here, we reconstruct the rate of submarine melting at Greenland’s marine-terminating glaciers from 1979 to 2018 and estimate the resulting dynamic mass loss. We show that in south Greenland, variability in submarine melting was indeed governed by the ocean, but, in contrast, the atmosphere dominated in the northwest. At the ice sheet scale, the atmosphere plays a first-order role in controlling submarine melting and the subsequent dynamic mass loss. Our results challenge the attribution of dynamic mass loss to ocean warming alone and show that a warming atmosphere has amplified the impact of the ocean on the Greenland ice sheet.
Submarine melting of glaciers in Greenland amplified by atmospheric warming