July 2023 sees multiple global temperature records broken – Global mean temperature temporarily exceeded the 1.5° C threshold – “The extreme weather which has affected many millions of people in July is unfortunately the harsh reality of climate change and a foretaste of the future”
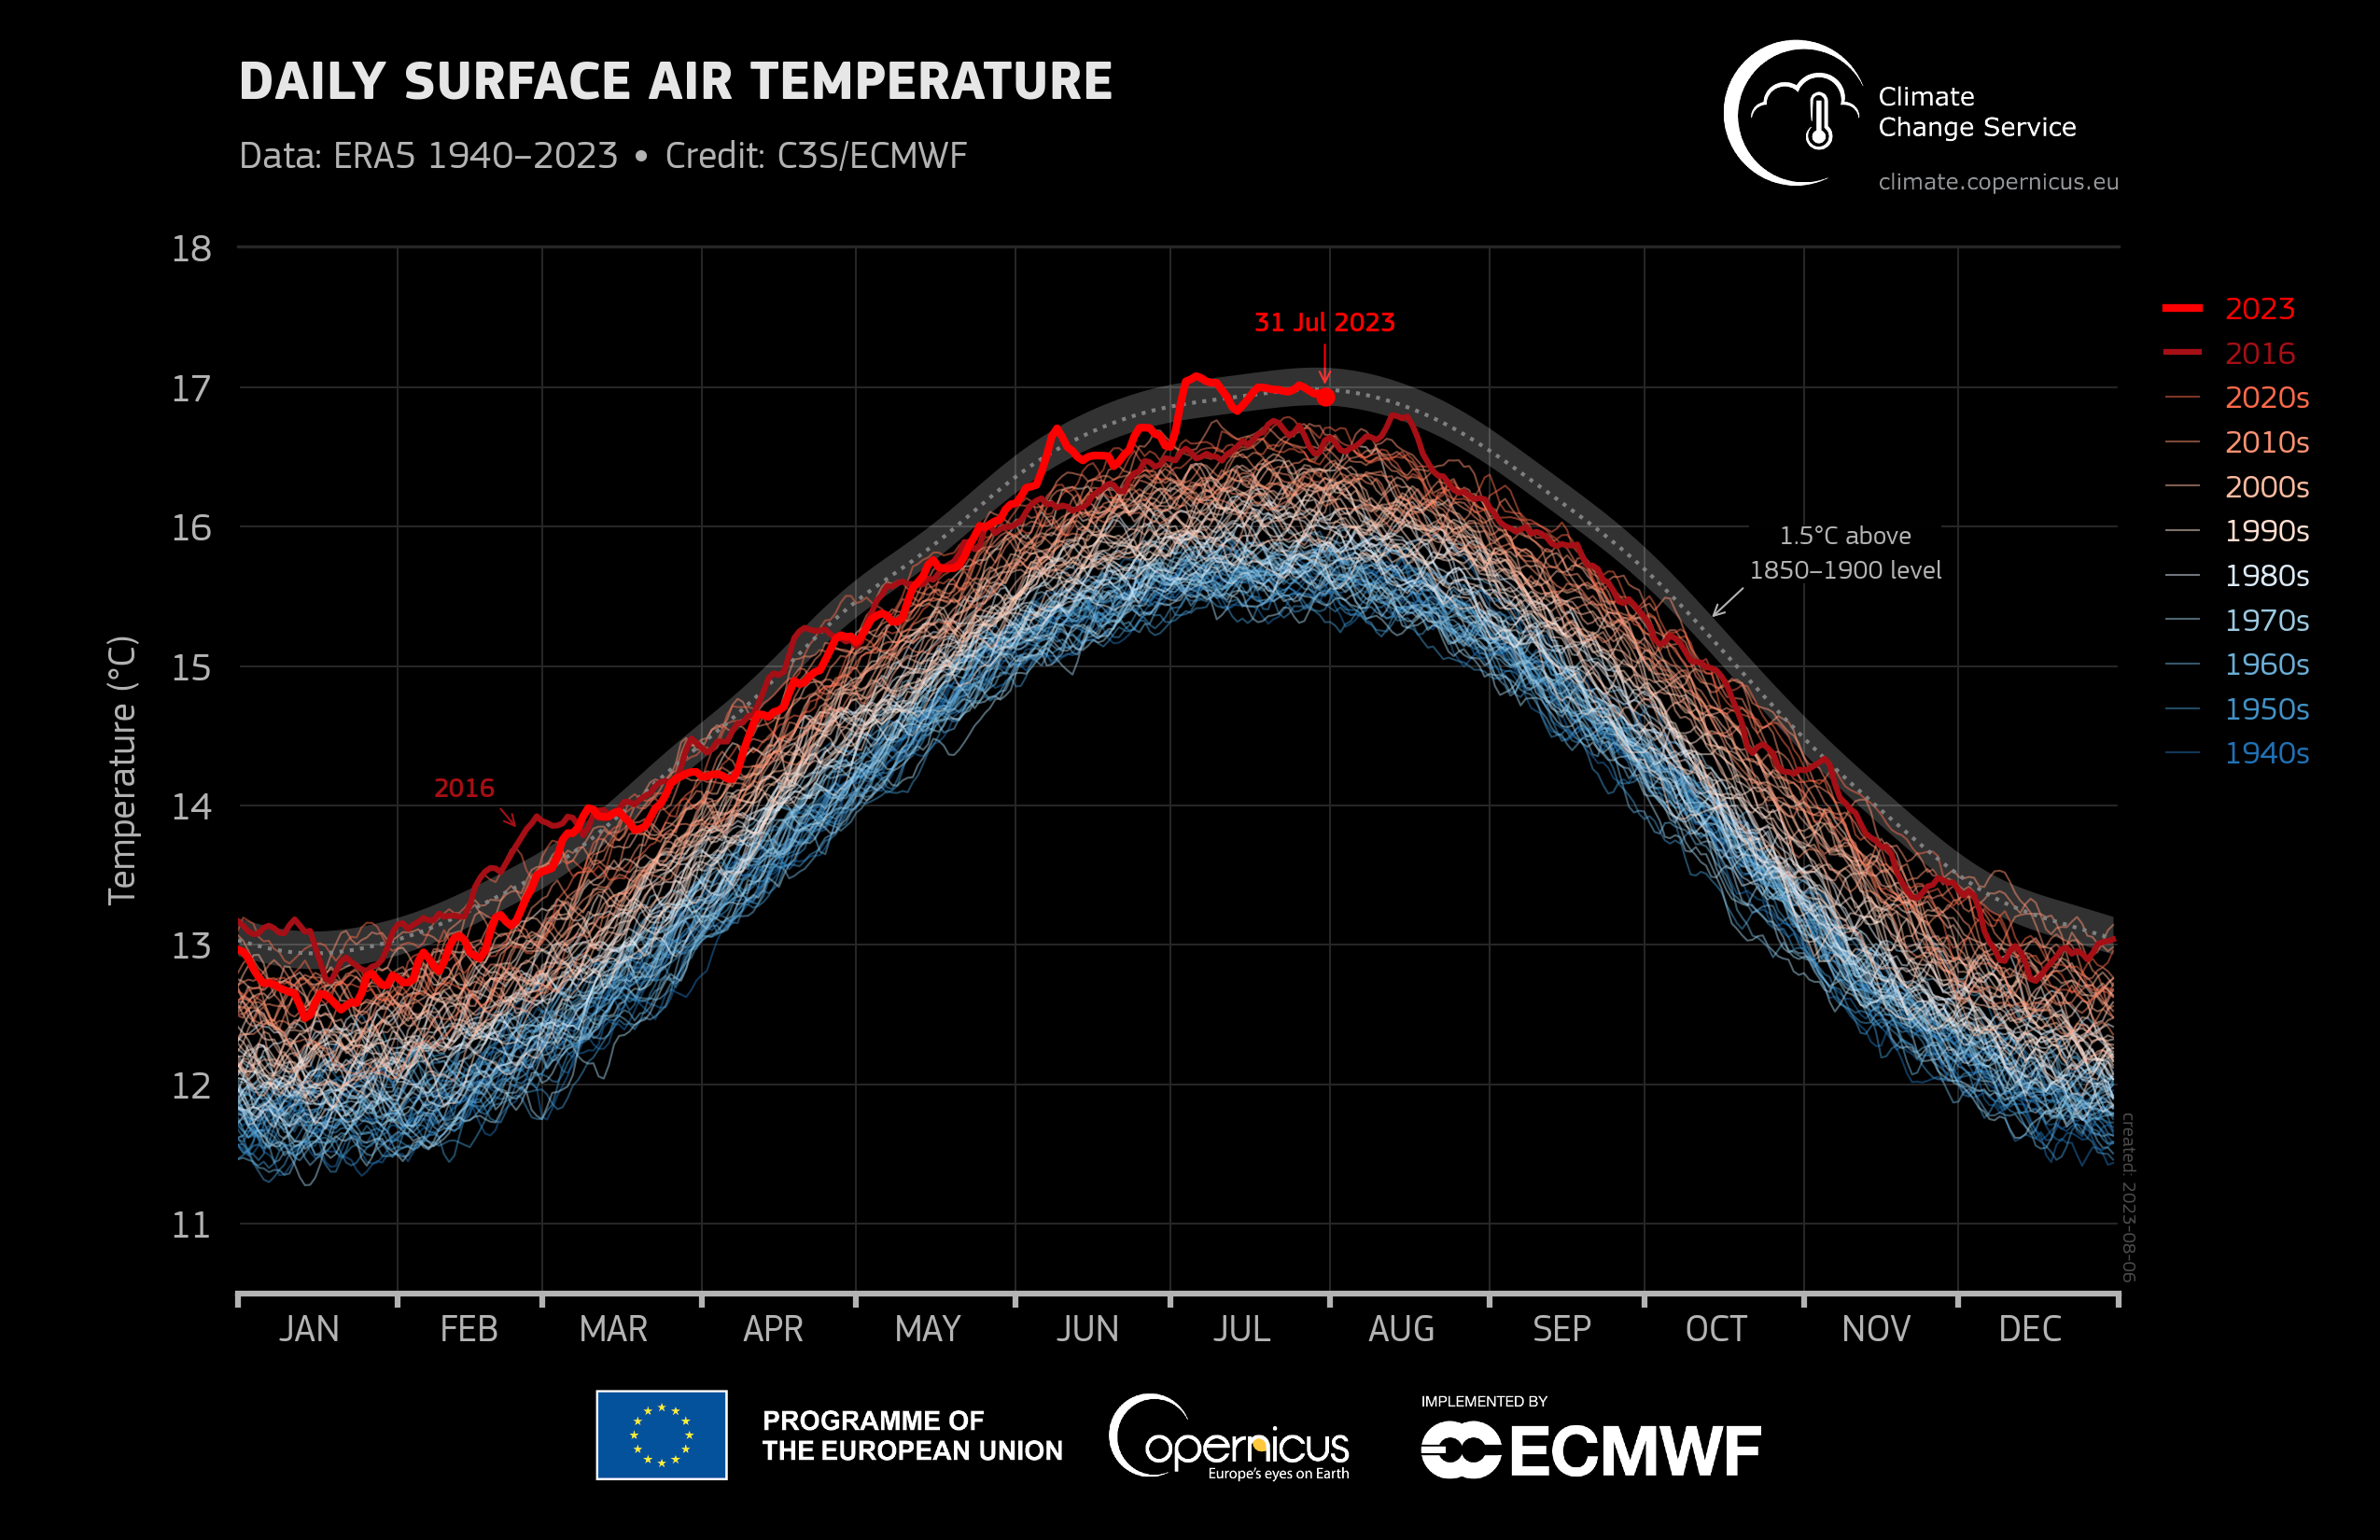
8 August 2023 (C3S) – The month started with the daily global mean surface air temperature record being broken on four days in a row, from 3-6 July. All days throughout the rest of July were hotter than the previous record of 16.80°C, set on 13 August 2016, making the 29 days from 3-31 July the hottest 29 days on record. The hottest day was 6 July, when the global average temperature reached 17.08°C, and the values recorded on 5 and 7 July were within 0.01°C of this. During the first and third weeks of the month, temperatures also temporarily exceeded the 1.5°C threshold above preindustrial level – a limit set in the Paris Agreement, the first time this has happened during July.
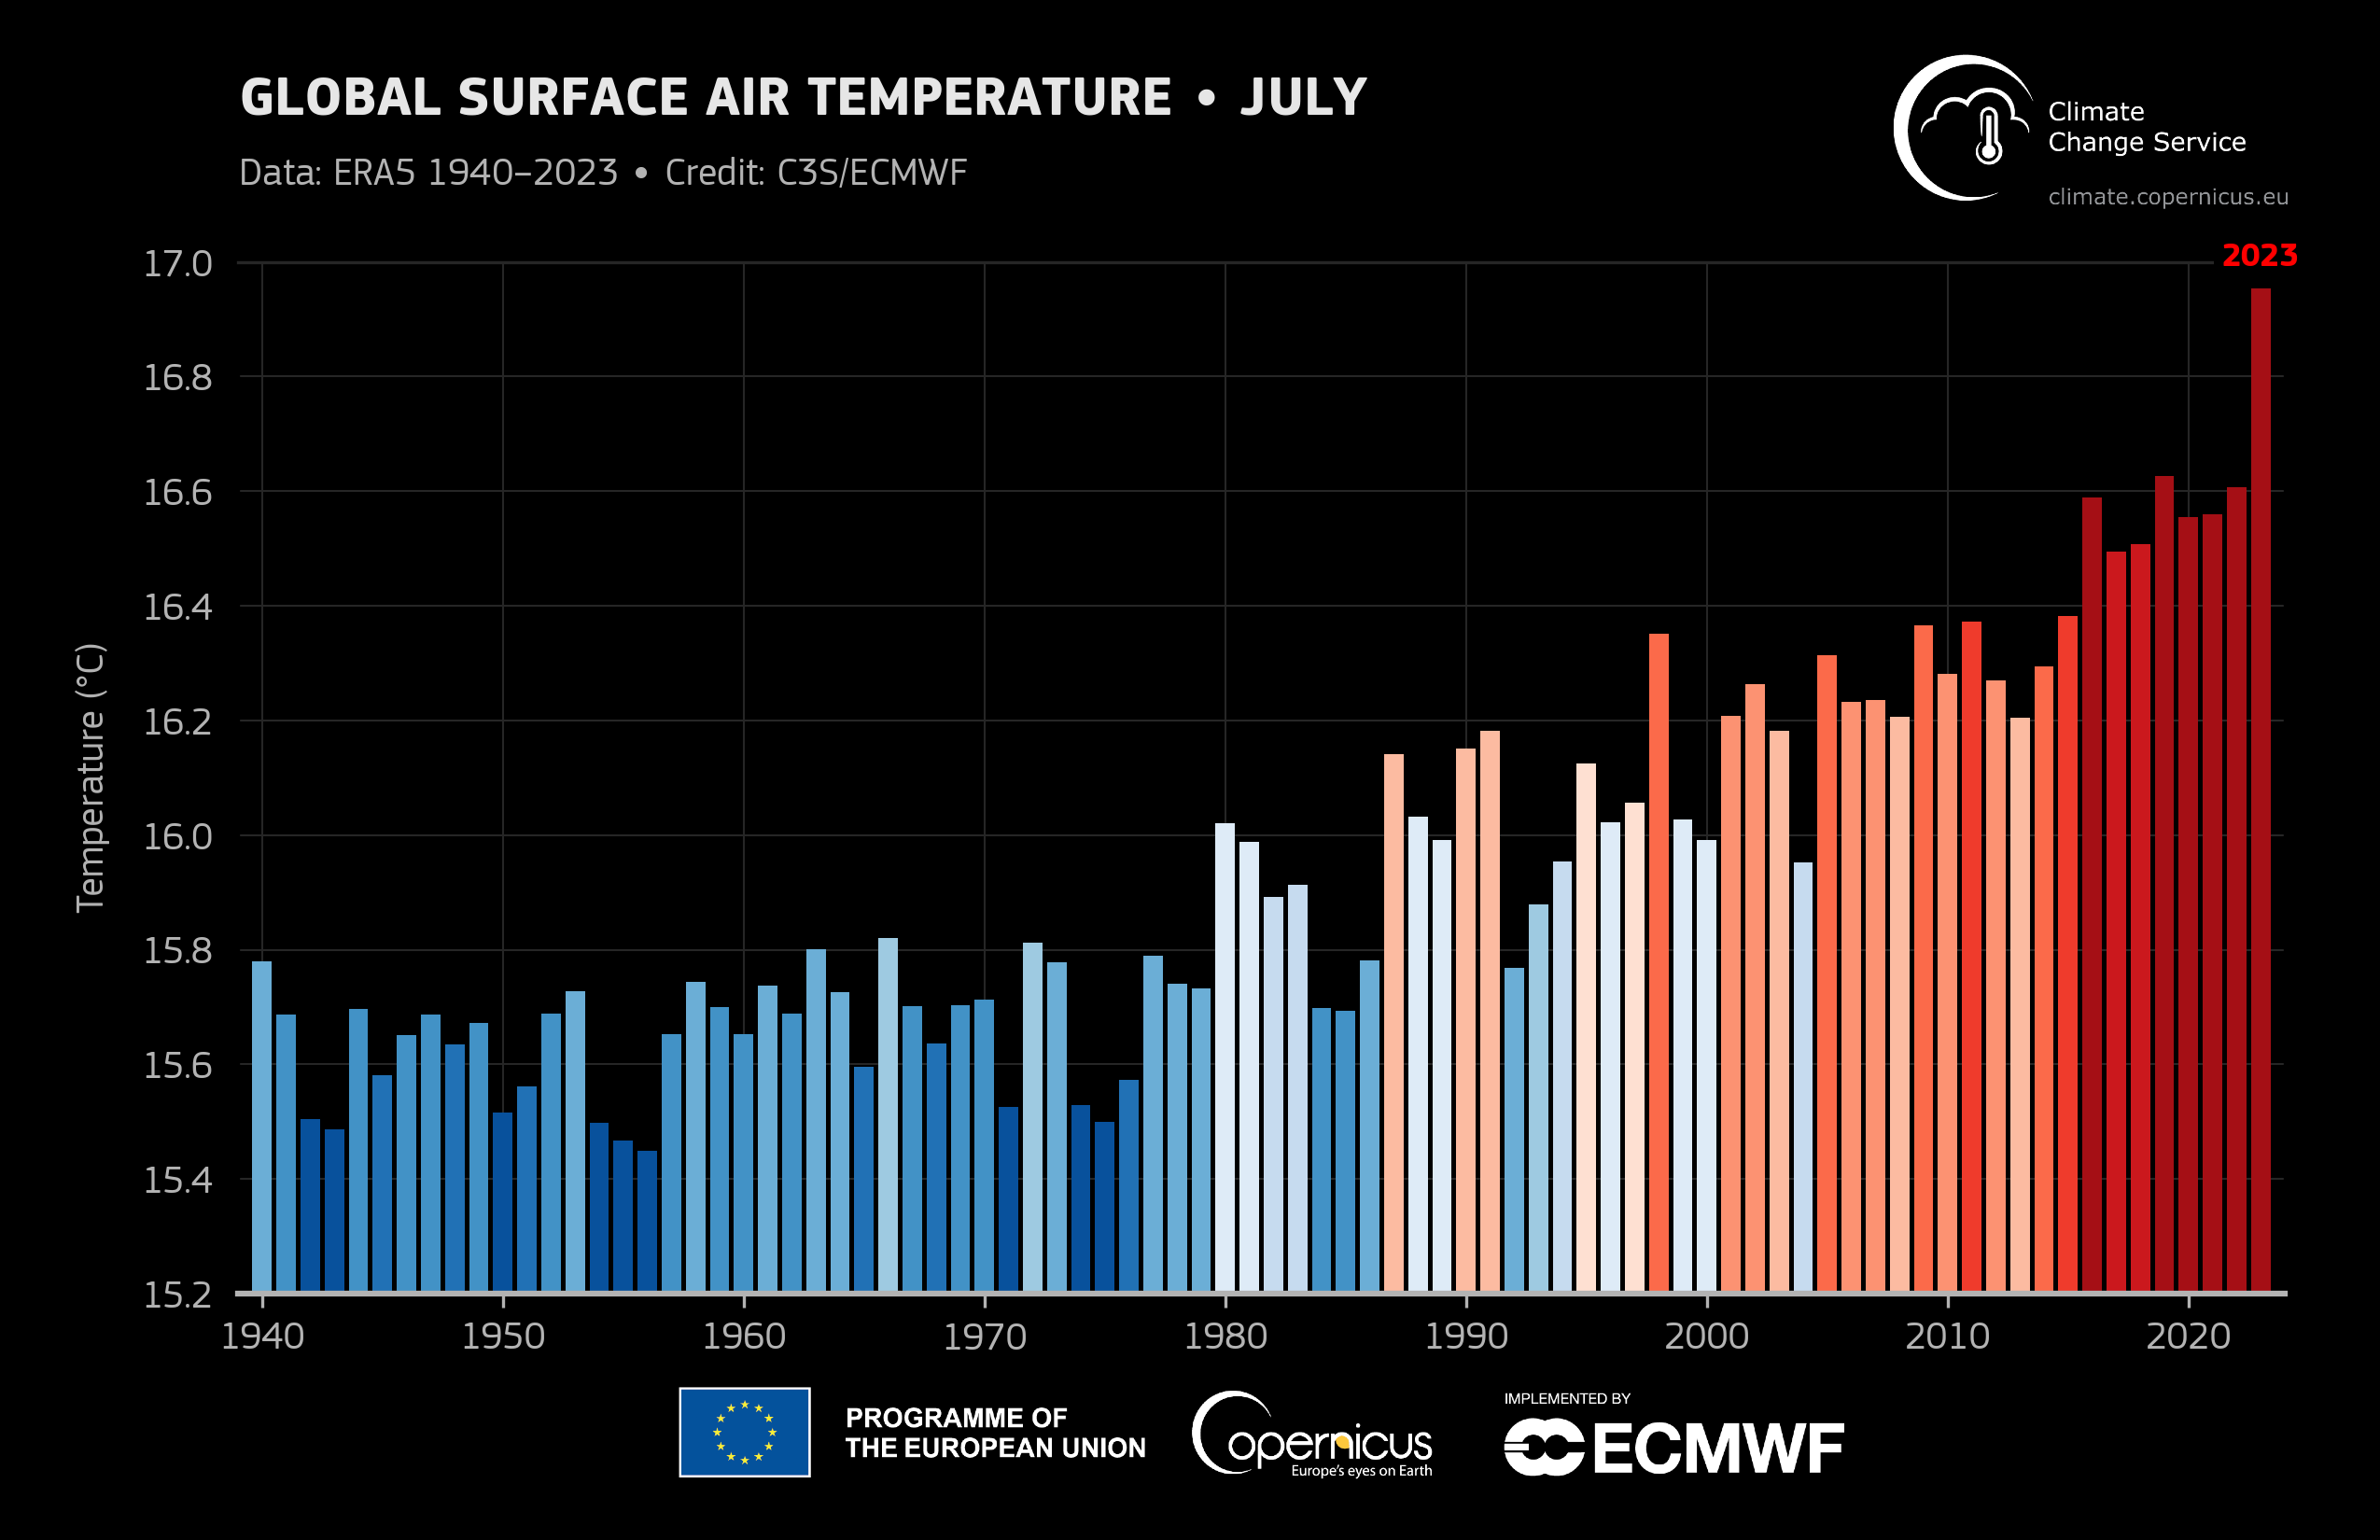
As anticipated in a C3S press release on 27 July, C3S data now confirm that July 2023 has been the hottest July and hottest month in the ERA5 data record, which goes back to 1940 (See Supplementary Information section 2). The monthly average temperature was 16.95°C, well above the previous record of July 2019 (16.63°C) and virtually identical to our best estimate of the 1.5°C warming above preindustrial level for July (16.96°C).
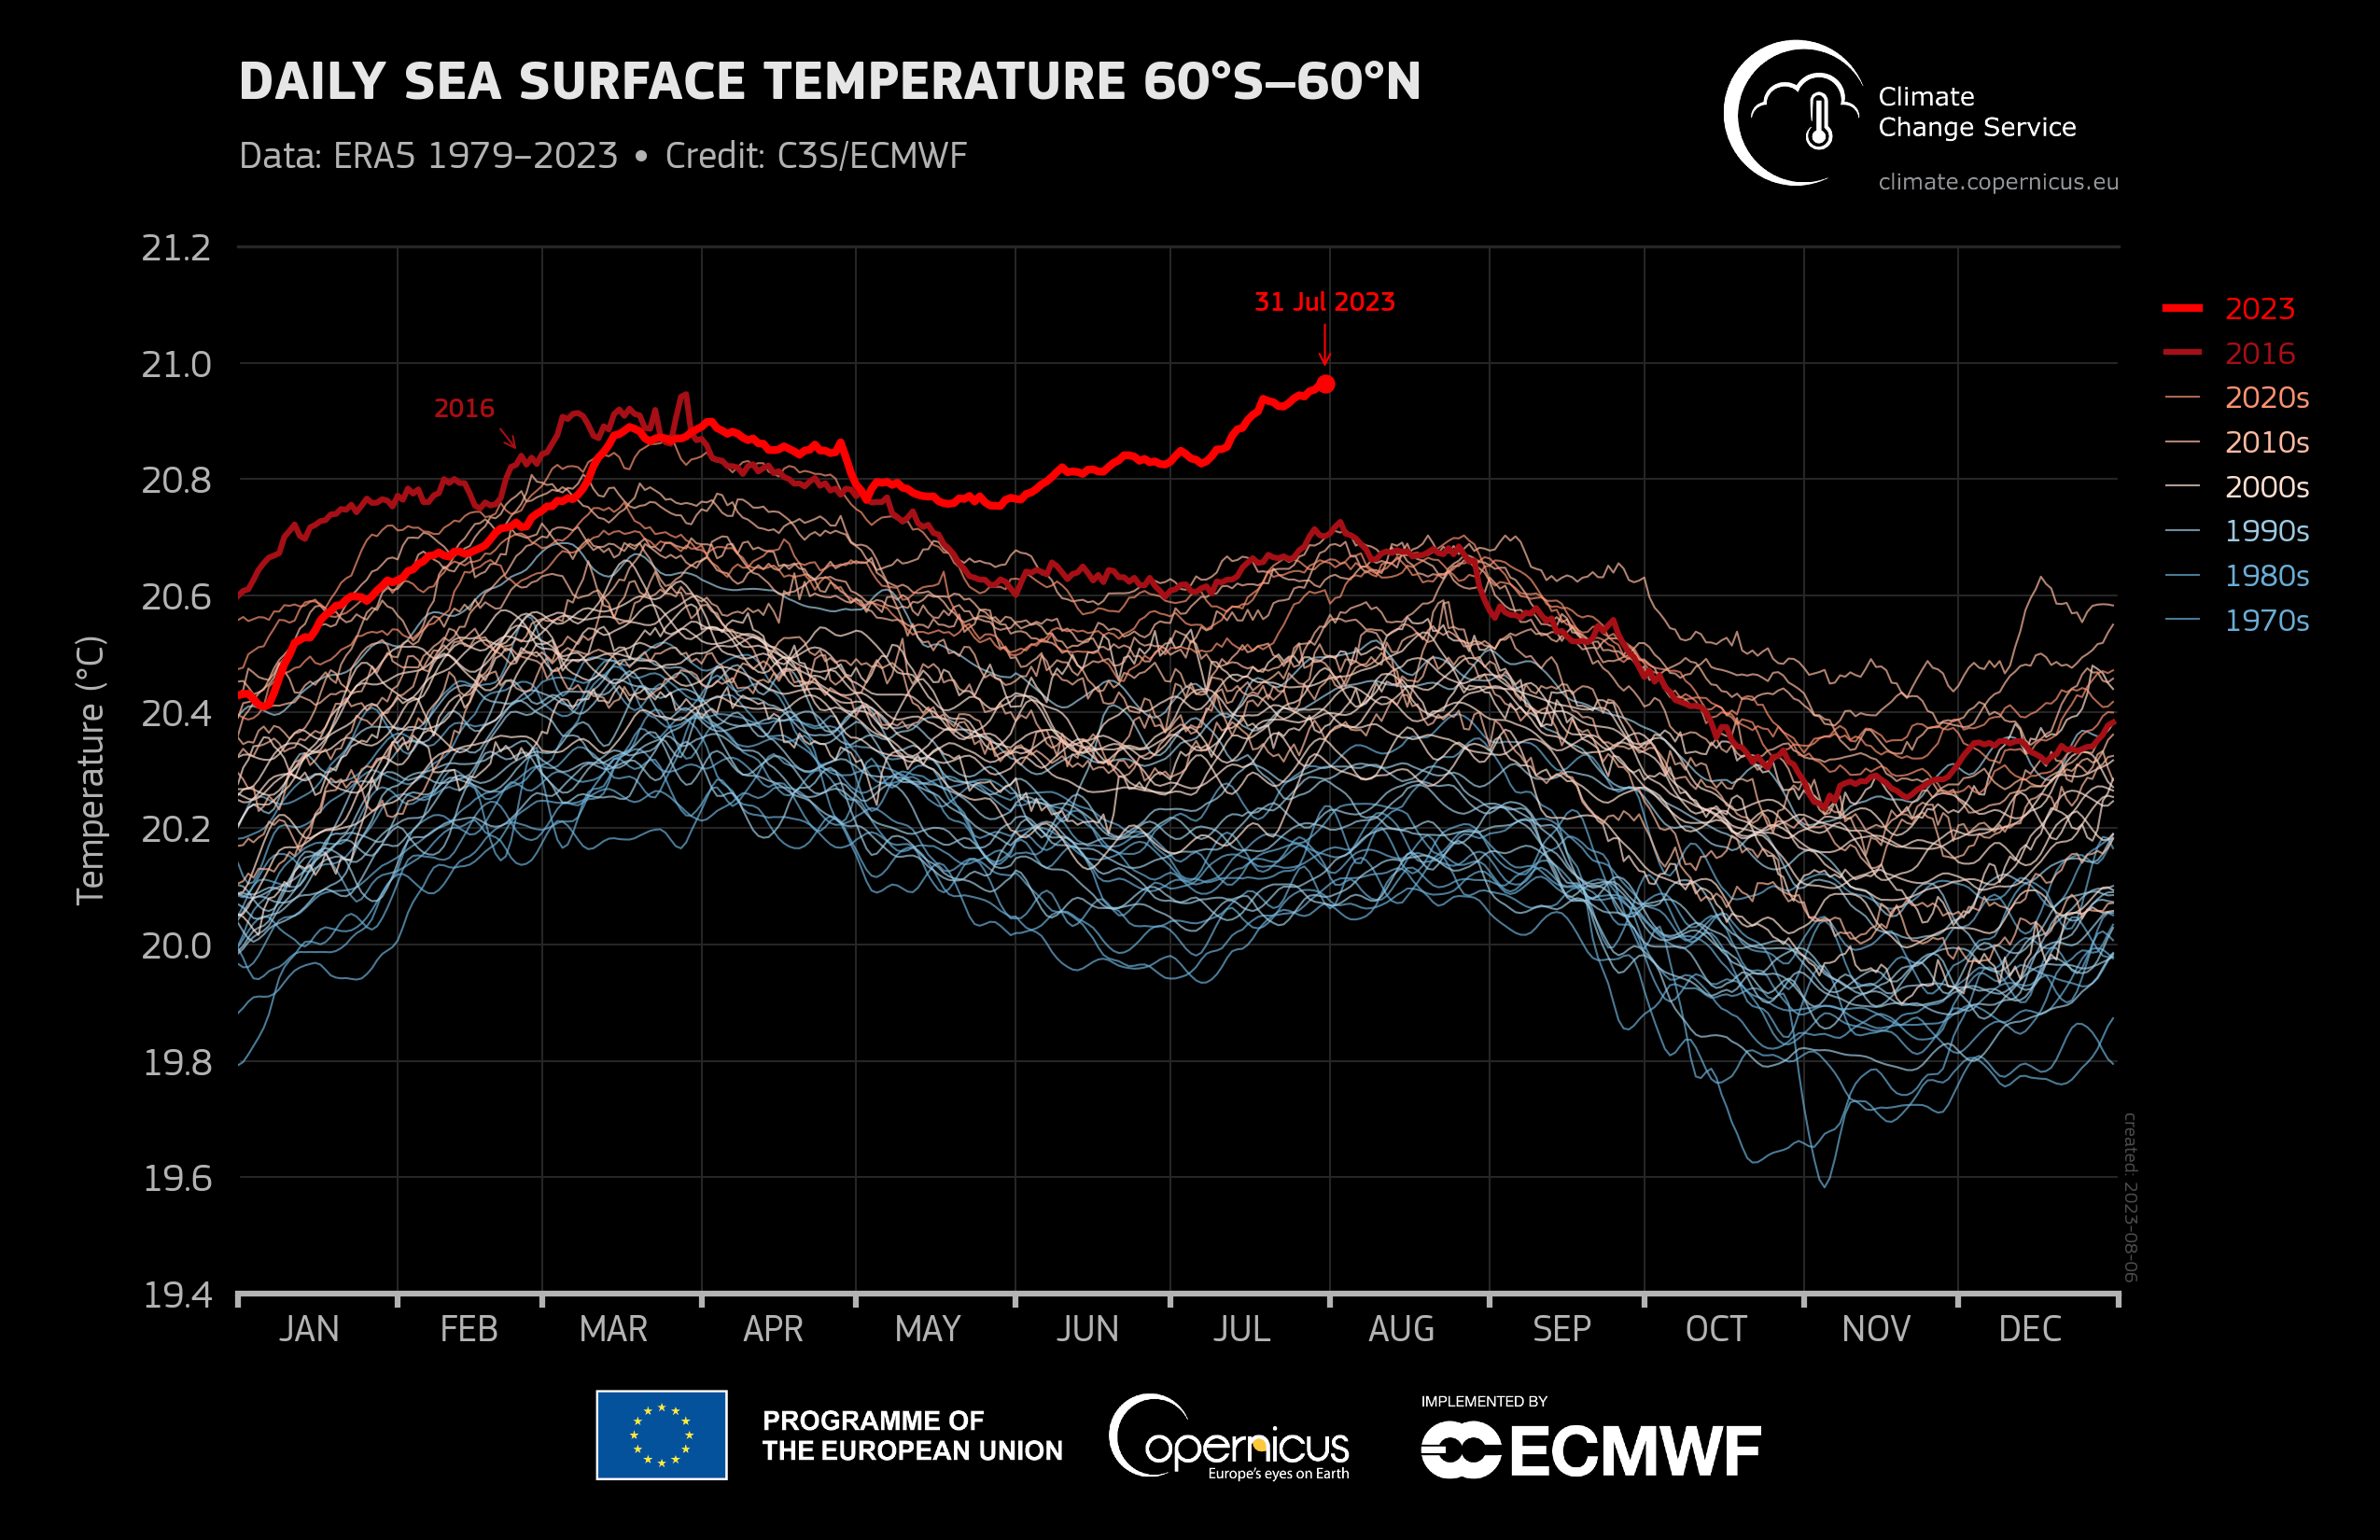
Contributing to the exceptionally warm July for the globe as a whole is a long period of unusually high sea surface temperatures (SSTs). Since April, the global average daily SST has remained at record values for the time of year. From mid-May onwards, global SSTs values have reached unprecedented levels for the time of year. According to ERA5 data, on 31 July, the daily SST value reached a record high of 20.96°C, 0.01°C above the previous highest value ever recorded, of 20.95°C on 29 March 2016. Further analysis of record high SSTs in July 2023 can be found in a C3S web article.
Global mean temperature temporarily exceeded the 1.5° C threshold
The 1.5°C warming threshold above preindustrial level (1850–1900) is shown in the first figure of this article. In this figure, the dashed line represents the best estimate of the threshold while the grey envelope represents the uncertainty range around this estimate. The methodology used to produce daily estimates of the 1.5°C threshold and its uncertainty is outlined in a C3S article and a C3S About the data and analysis webpage.
According to ERA5 data, the daily global mean surface air temperature temporarily surpassed the best-estimate line once from 3 to 12 July and then again from 17 to 22 July. While the threshold had been previously exceeded in other months (most notably during winter 2015-2016 and spring 2016), this was the first time the threshold was exceeded in July. This was also the case in early June 2023 when the daily global temperature rose above the threshold for the first time during that month.
New national temperature records
National meteorological and hydrological services have reported a number of daily and station temperature records and are responsible for verifying any new national temperature records. Thus, China set a new national temperature record of 52.2°C on 16 July (Turpan city in China’s Xinjiang province), according to the China Meteorological Administration. WMO’s provisional State of the Global Climate 2023 report, which will be presented to COP28 in December, will incorporate details of new national temperature records.
The temperature record for continental Europe of 48.8°C (119.8°F), measured in Sicily on 11 August 2021, was not broken during the July heatwaves, according to provisional information.
Temperature records in the United States of America are maintained by the US National Oceanic and Atmospheric Administration’s National Centers for Environmental Information.
Carlo Buontempo, Director of C3S, comments: “Record-breaking temperatures are part of the trend of drastic increases in global temperatures. Anthropogenic emissions are ultimately the main driver of these rising temperatures”. He added, “July’s record is unlikely to remain isolated this year, C3S’ seasonal forecasts indicate that over land areas temperatures are likely to be well above average.”
“The extreme weather which has affected many millions of people in July is unfortunately the harsh reality of climate change and a foretaste of the future,” said World Meteorological Organization’s Secretary-General Prof. Petteri Taalas. “The need to reduce greenhouse gas emissions is more urgent than ever before. Climate action is not a luxury but a must.” Since April, the global average daily sea surface temperature has remained at record values for the time of year. [more]