U.S. Health Care from a Global Perspective, 2022: Accelerating spending, worsening outcomes – “Americans are more likely to die younger, and from avoidable causes, than residents of peer countries”
By Munira Z. Gunja, Evan D. Gumas, and Reginald D. Williams II
31 January 2023
(The Commonwealth Fund) – In the previous edition of U.S. Health Care from a Global Perspective, we reported that people in the United States experience the worst health outcomes overall of any high-income nation.1 Americans are more likely to die younger, and from avoidable causes, than residents of peer countries.
Between January 2020 and December 2021, life expectancy dropped in the U.S. and other countries.2 With the pandemic a continuing threat to global health and well-being, we have updated our 2019 cross-national comparison of health care systems to assess U.S. health spending, outcomes, status, and service use relative to Australia, Canada, France, Germany, Japan, the Netherlands, New Zealand, Norway, South Korea, Sweden, Switzerland, and the United Kingdom. We also compare U.S. health system performance to the OECD average for the 38 high-income countries for which data are available. The data for our analysis come from the Organisation for Economic Co-operation and Development (OECD) and other international sources (see “How We Conducted This Study” for details).
For every metric we examine, we used the latest data available. This means that results for certain countries may reflect the height of the COVID-19 pandemic, when mental health conditions were surging, essential health services were disrupted, and patients may not have received the same level of care.3
Highlights
- Health care spending, both per person and as a share of GDP, continues to be far higher in the United States than in other high-income countries. Yet the U.S. is the only country that doesn’t have universal health coverage.
- The U.S. has the lowest life expectancy at birth, the highest death rates for avoidable or treatable conditions, the highest maternal and infant mortality, and among the highest suicide rates.
- The U.S. has the highest rate of people with multiple chronic conditions and an obesity rate nearly twice the OECD average.
- Americans see physicians less often than people in most other countries and have among the lowest rate of practicing physicians and hospital beds per 1,000 population.
- Screening rates for breast and colorectal cancer and vaccination for flu in the U.S. are among the highest, but COVID-19 vaccination trails many nations.
Findings
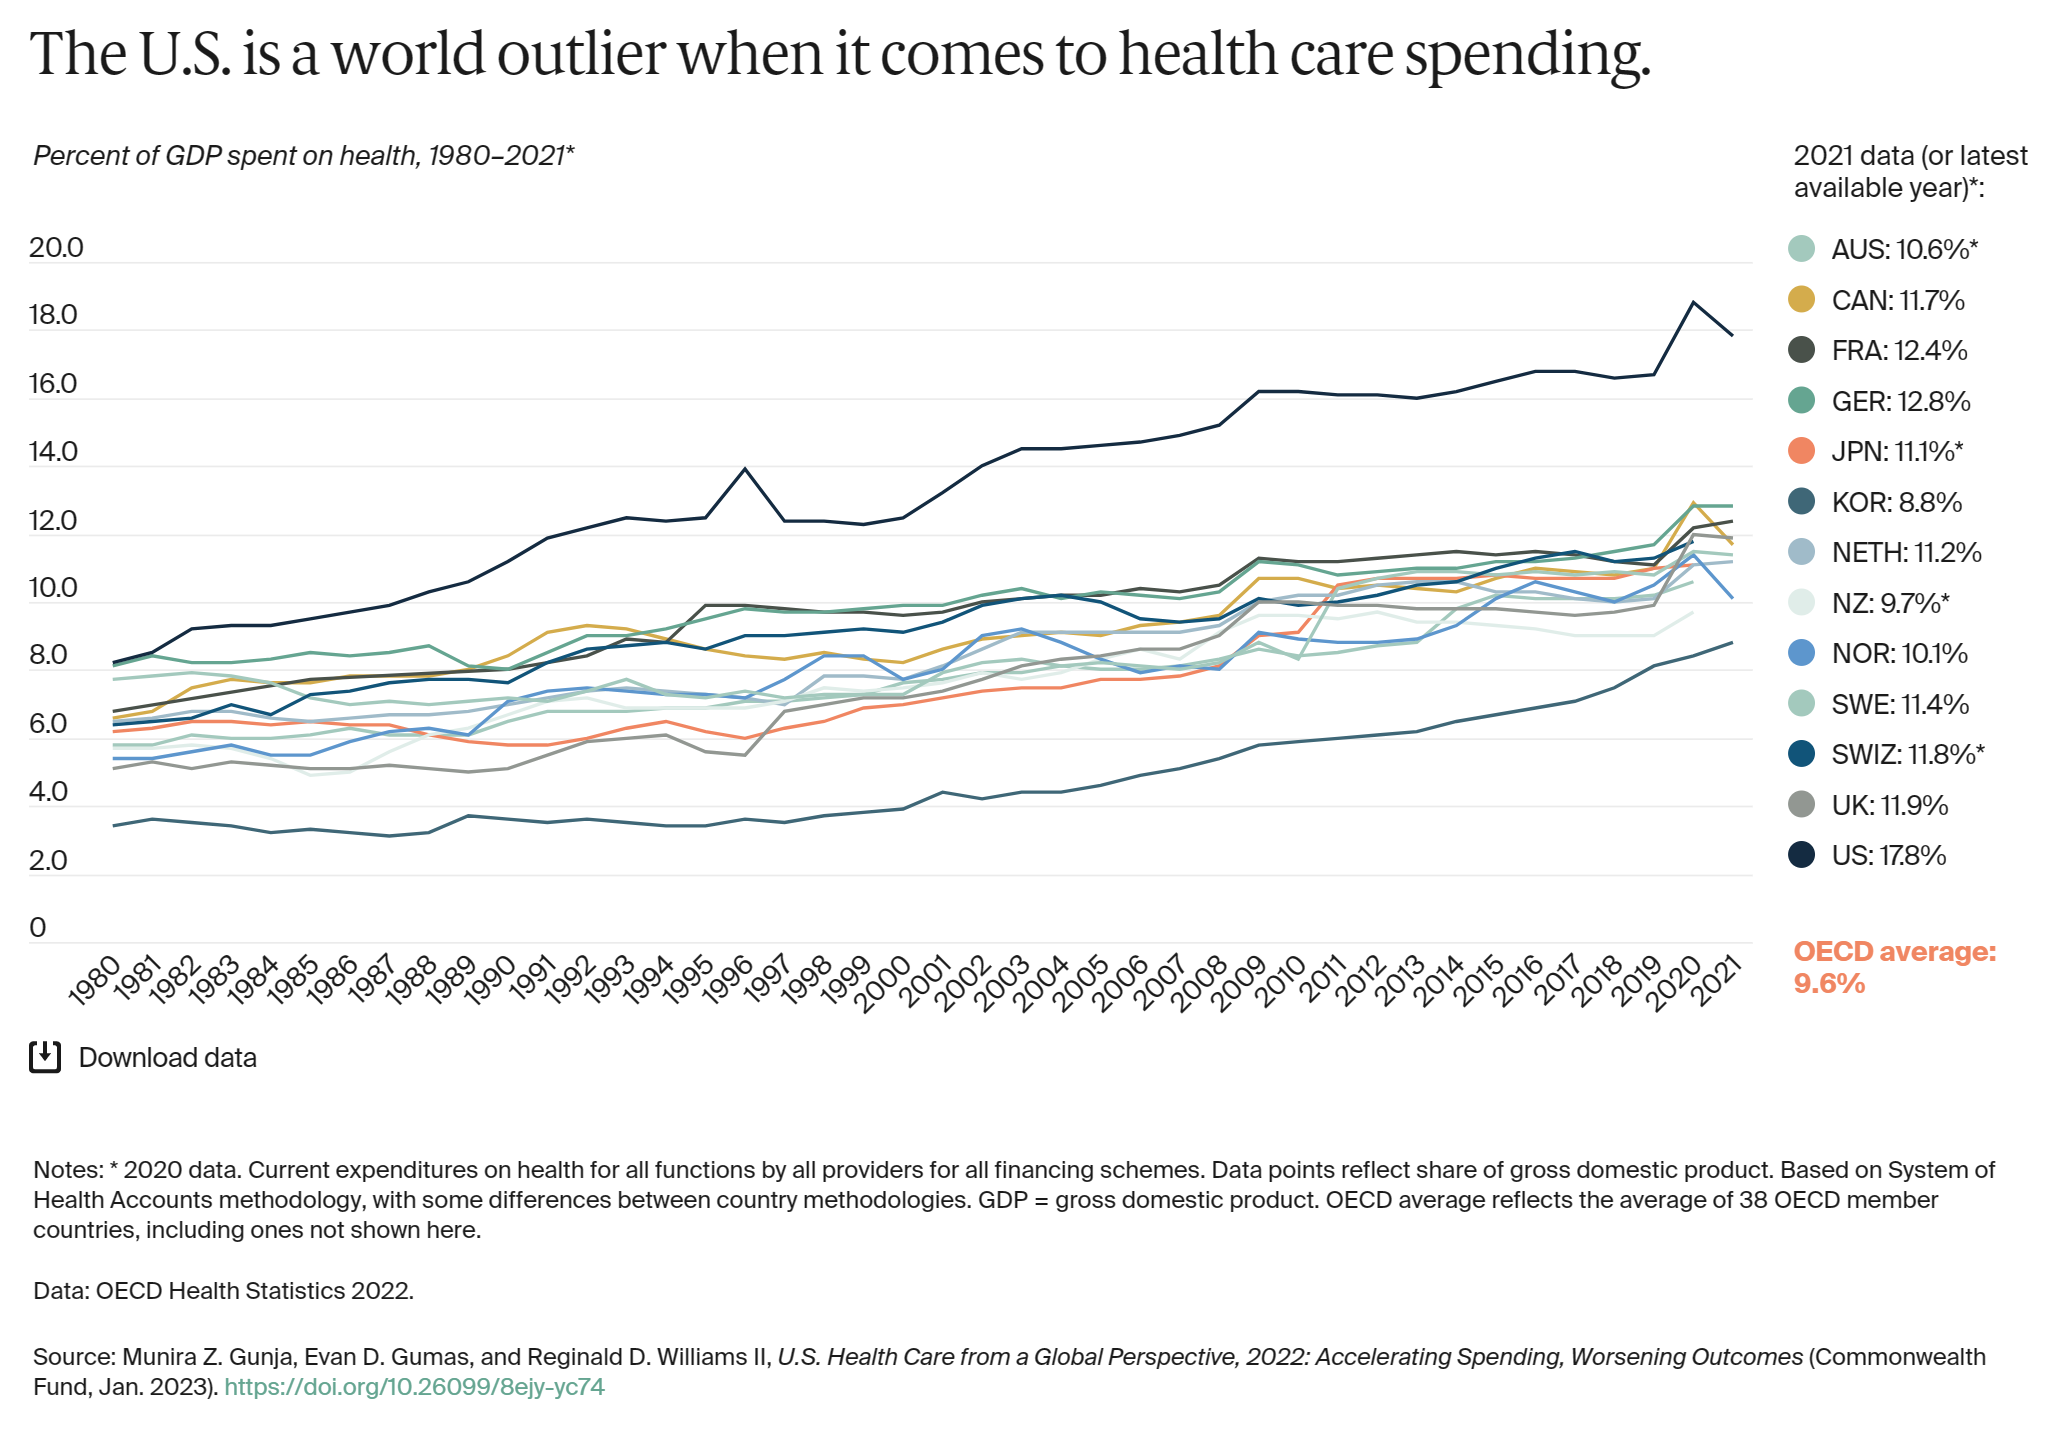
In all countries, health spending as a share of the overall economy has been steadily increasing since the 1980s, as spending growth has outpaced economic growth.4 This growth is in part because of medical technologies, rising prices in the health sector, and higher demand for services.5 In 2020, when the COVID-19 pandemic began, health care spending rose rapidly in nearly all countries, as governments sought to mitigate the spread of the disease through COVID testing, vaccine development, relief funds, and other measures.6 Since then, spending has slowed but still remains higher from years prior.7
In 2021, the U.S. spent 17.8 percent of gross domestic product (GDP) on health care, nearly twice as much as the average OECD country.
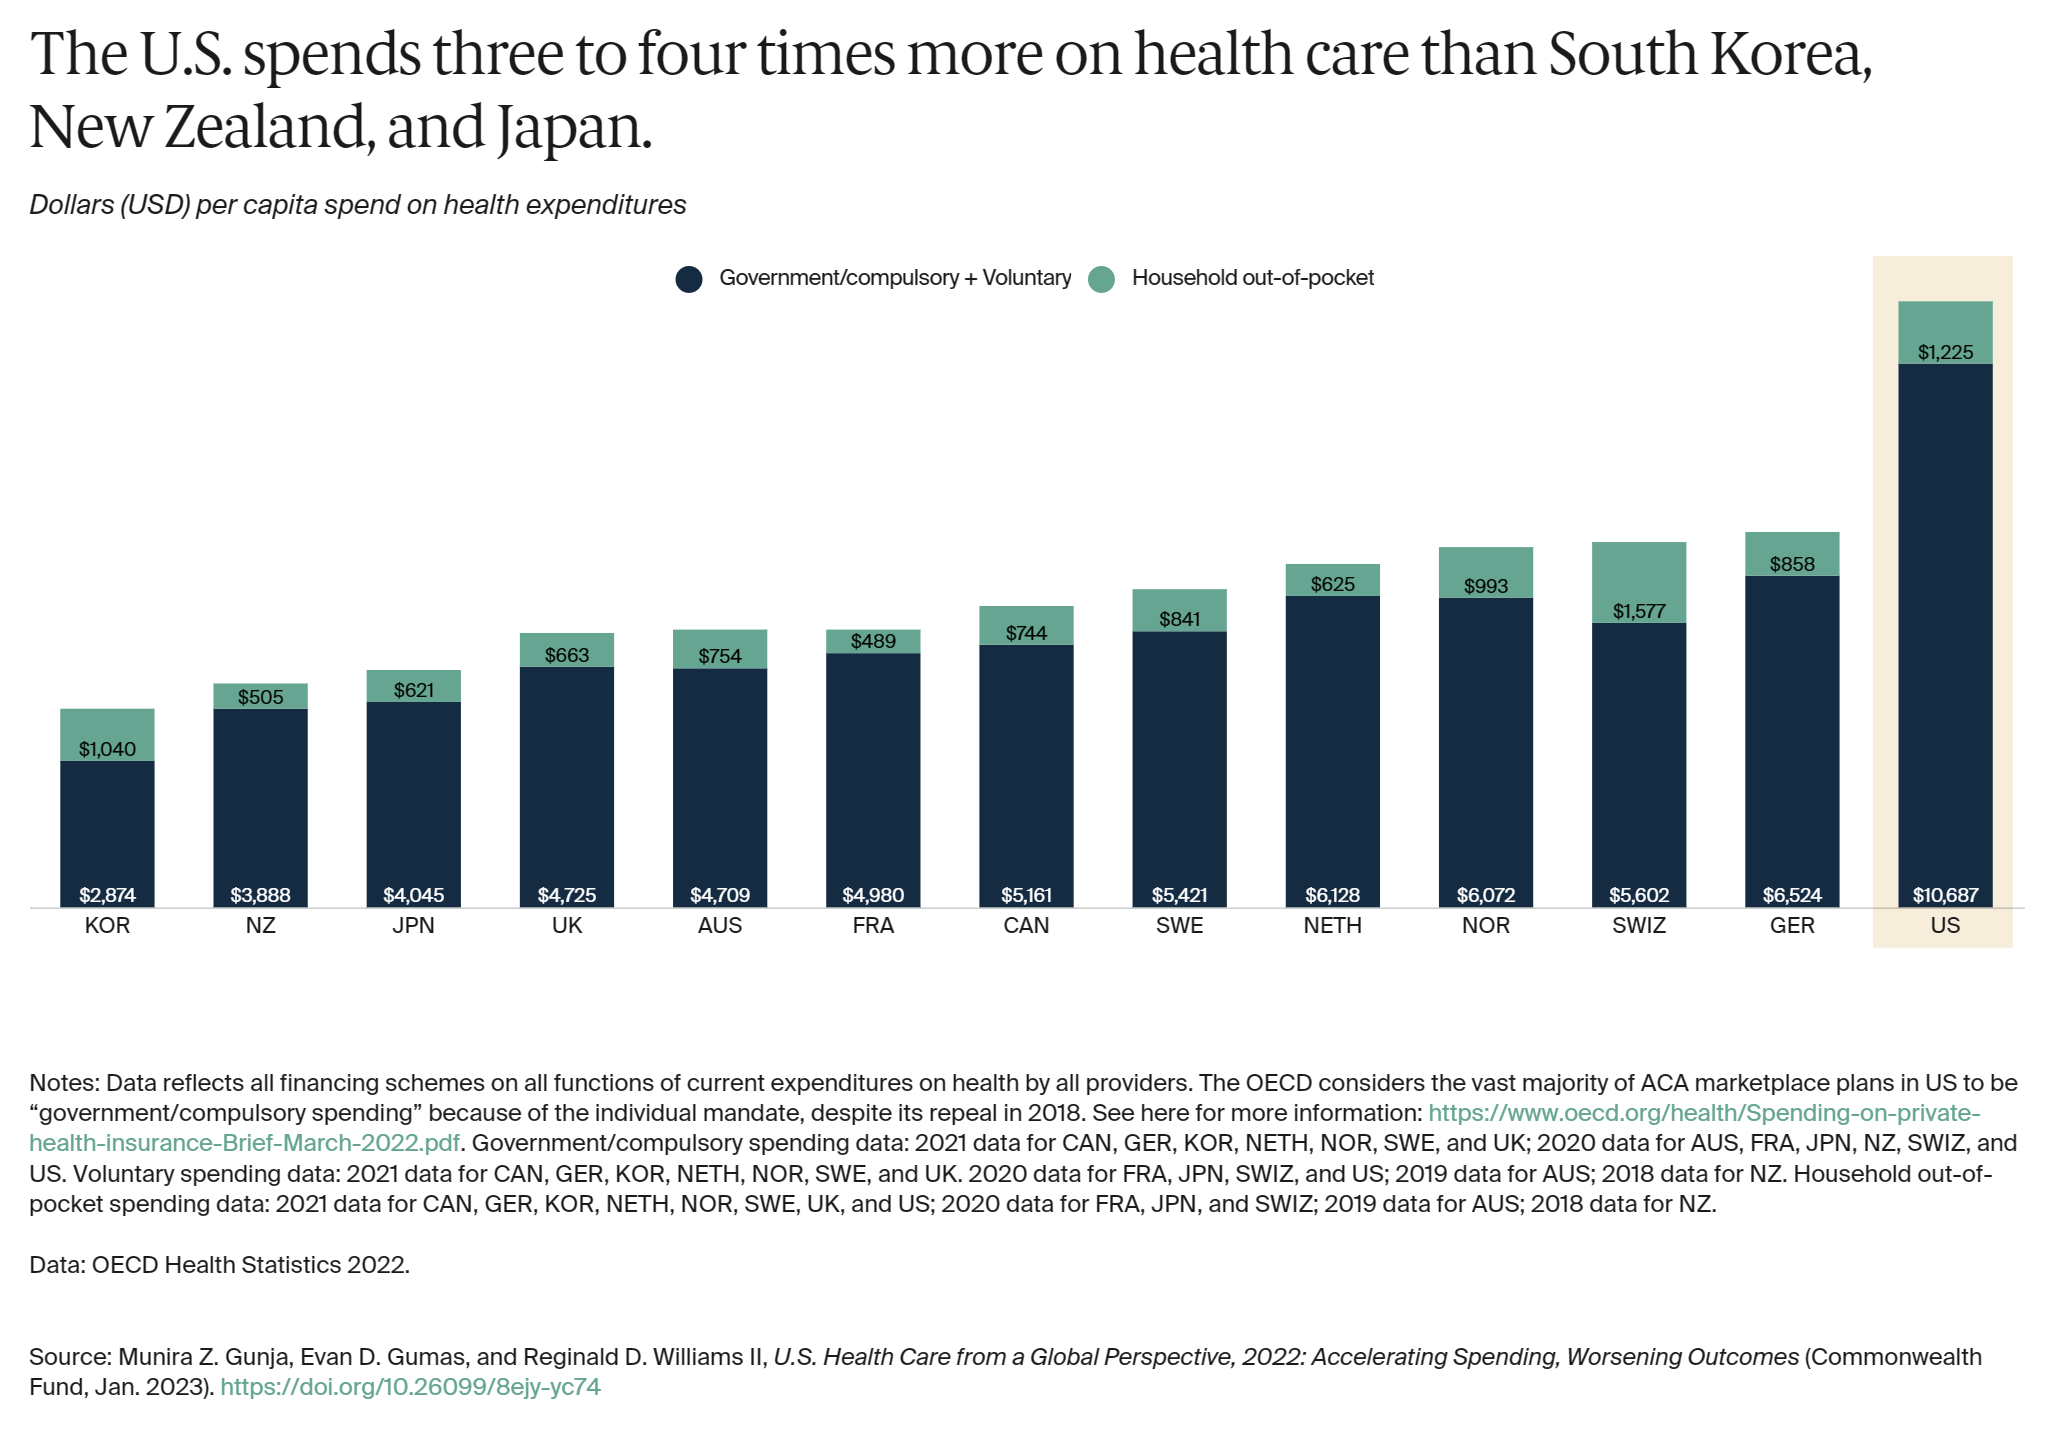
Health spending per person in the U.S. was nearly two times higher than in the closest country, Germany, and four times higher than in South Korea. In the U.S., that includes spending for people in public programs like Medicaid, the Children’s Health Insurance Program, Medicare, and military plans; spending by those with private employer-sponsored coverage or other private insurance; and out-of-pocket health spending.
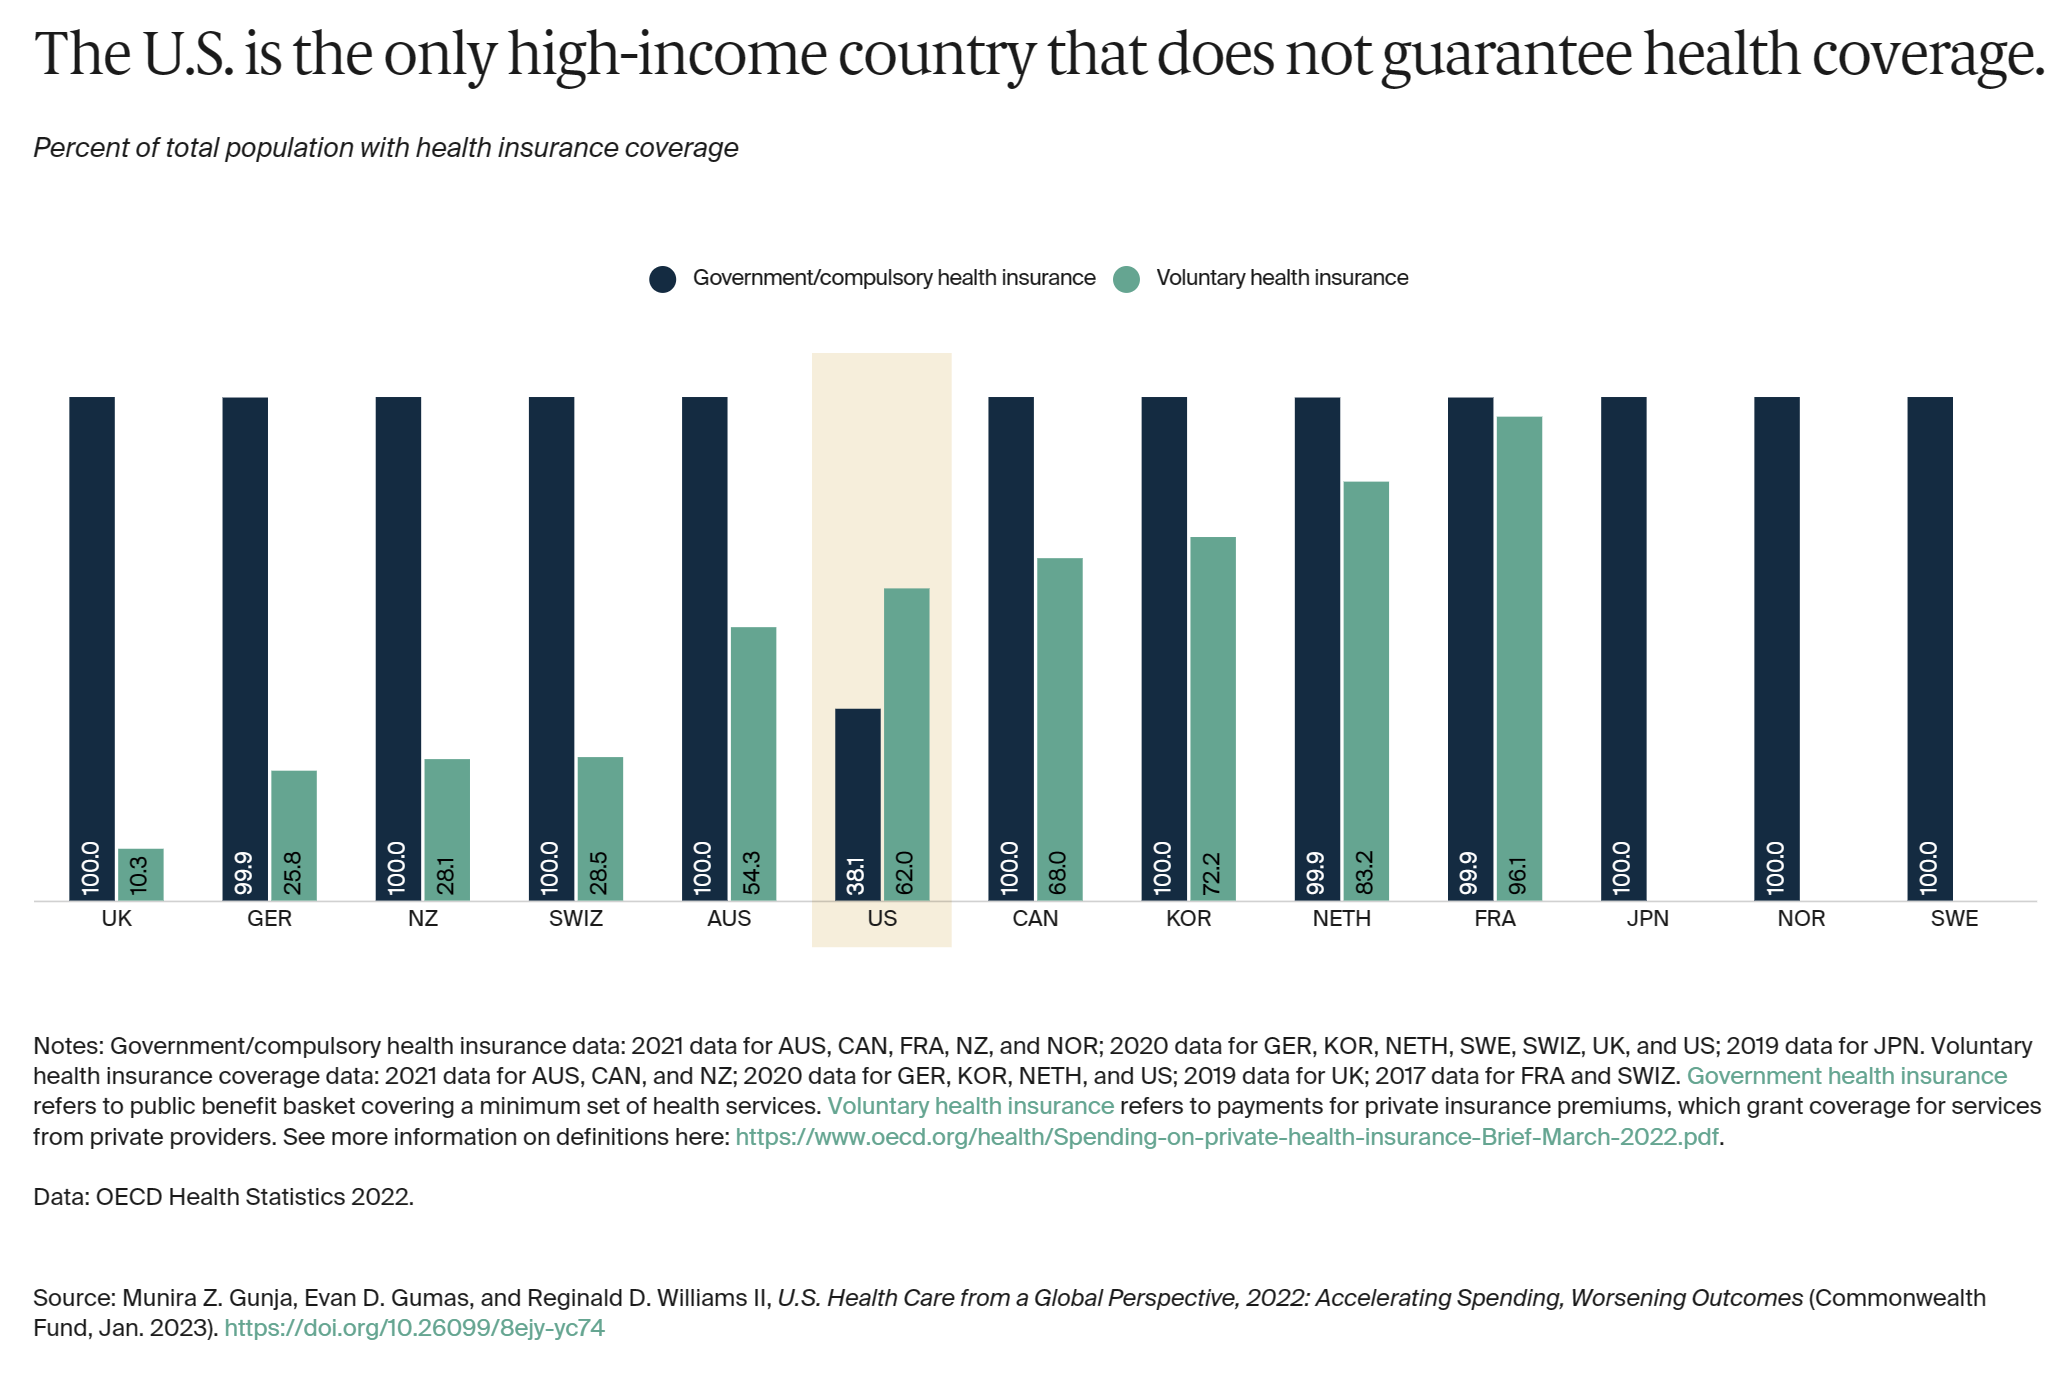
All countries in this analysis, except the U.S., guarantee government, or public, health coverage to all their residents. In addition to public coverage, people in several of the countries have the option to also purchase private coverage. In France, nearly the entire population has both private and public insurance.
In 2021, 8.6 percent of the U.S. population was uninsured.8 The U.S. is the only high-income country where a substantial portion of the population lacks any form of health insurance.
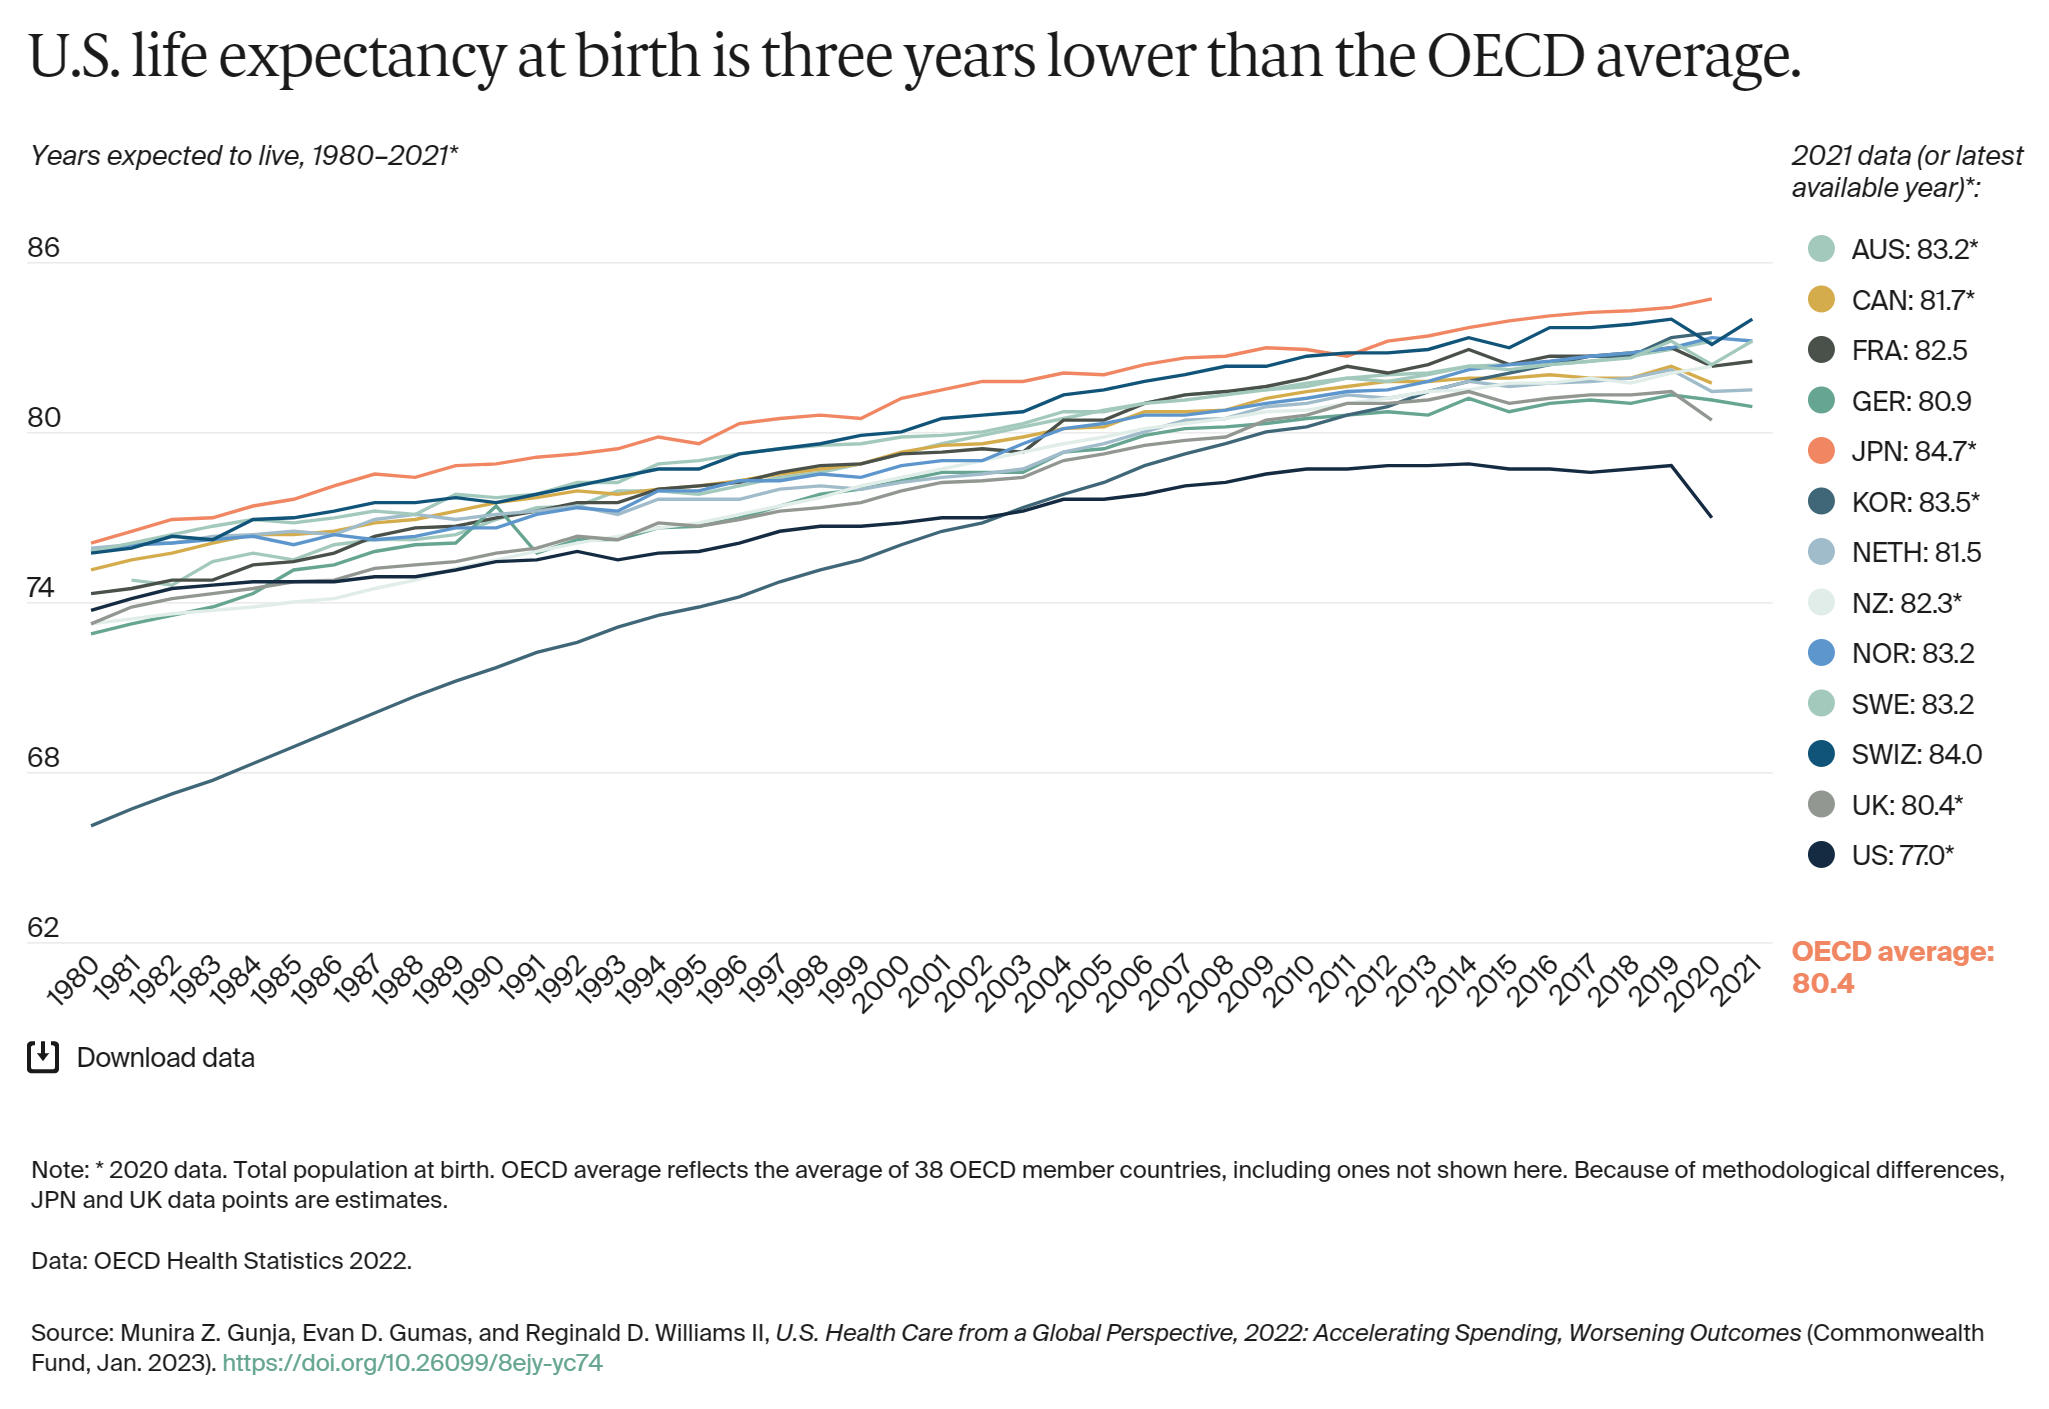
Despite high U.S. spending, Americans experience worse health outcomes than their peers around world. For example, life expectancy at birth in the U.S. was 77 years in 2020 — three years lower than the OECD average. Provisional data shows life expectancy in the U.S. dropped even further in 2021.9
In the U.S., life expectancy masks racial and ethnic disparities.10 Average life expectancy in 2019 for non-Hispanic Black Americans (74.8 years) and non-Hispanic American Indians or Alaska Natives (71.8 years) is four and seven years lower, respectively, than it is for non-Hispanic whites (78.8 years).
Meanwhile, life expectancy for Hispanic Americans (81.9 years) is higher than it is for whites and similar to life expectancy in the Netherlands, New Zealand, and Canada. As a group, Asian Americans have a higher life expectancy (85.6 years) than people in Japan.
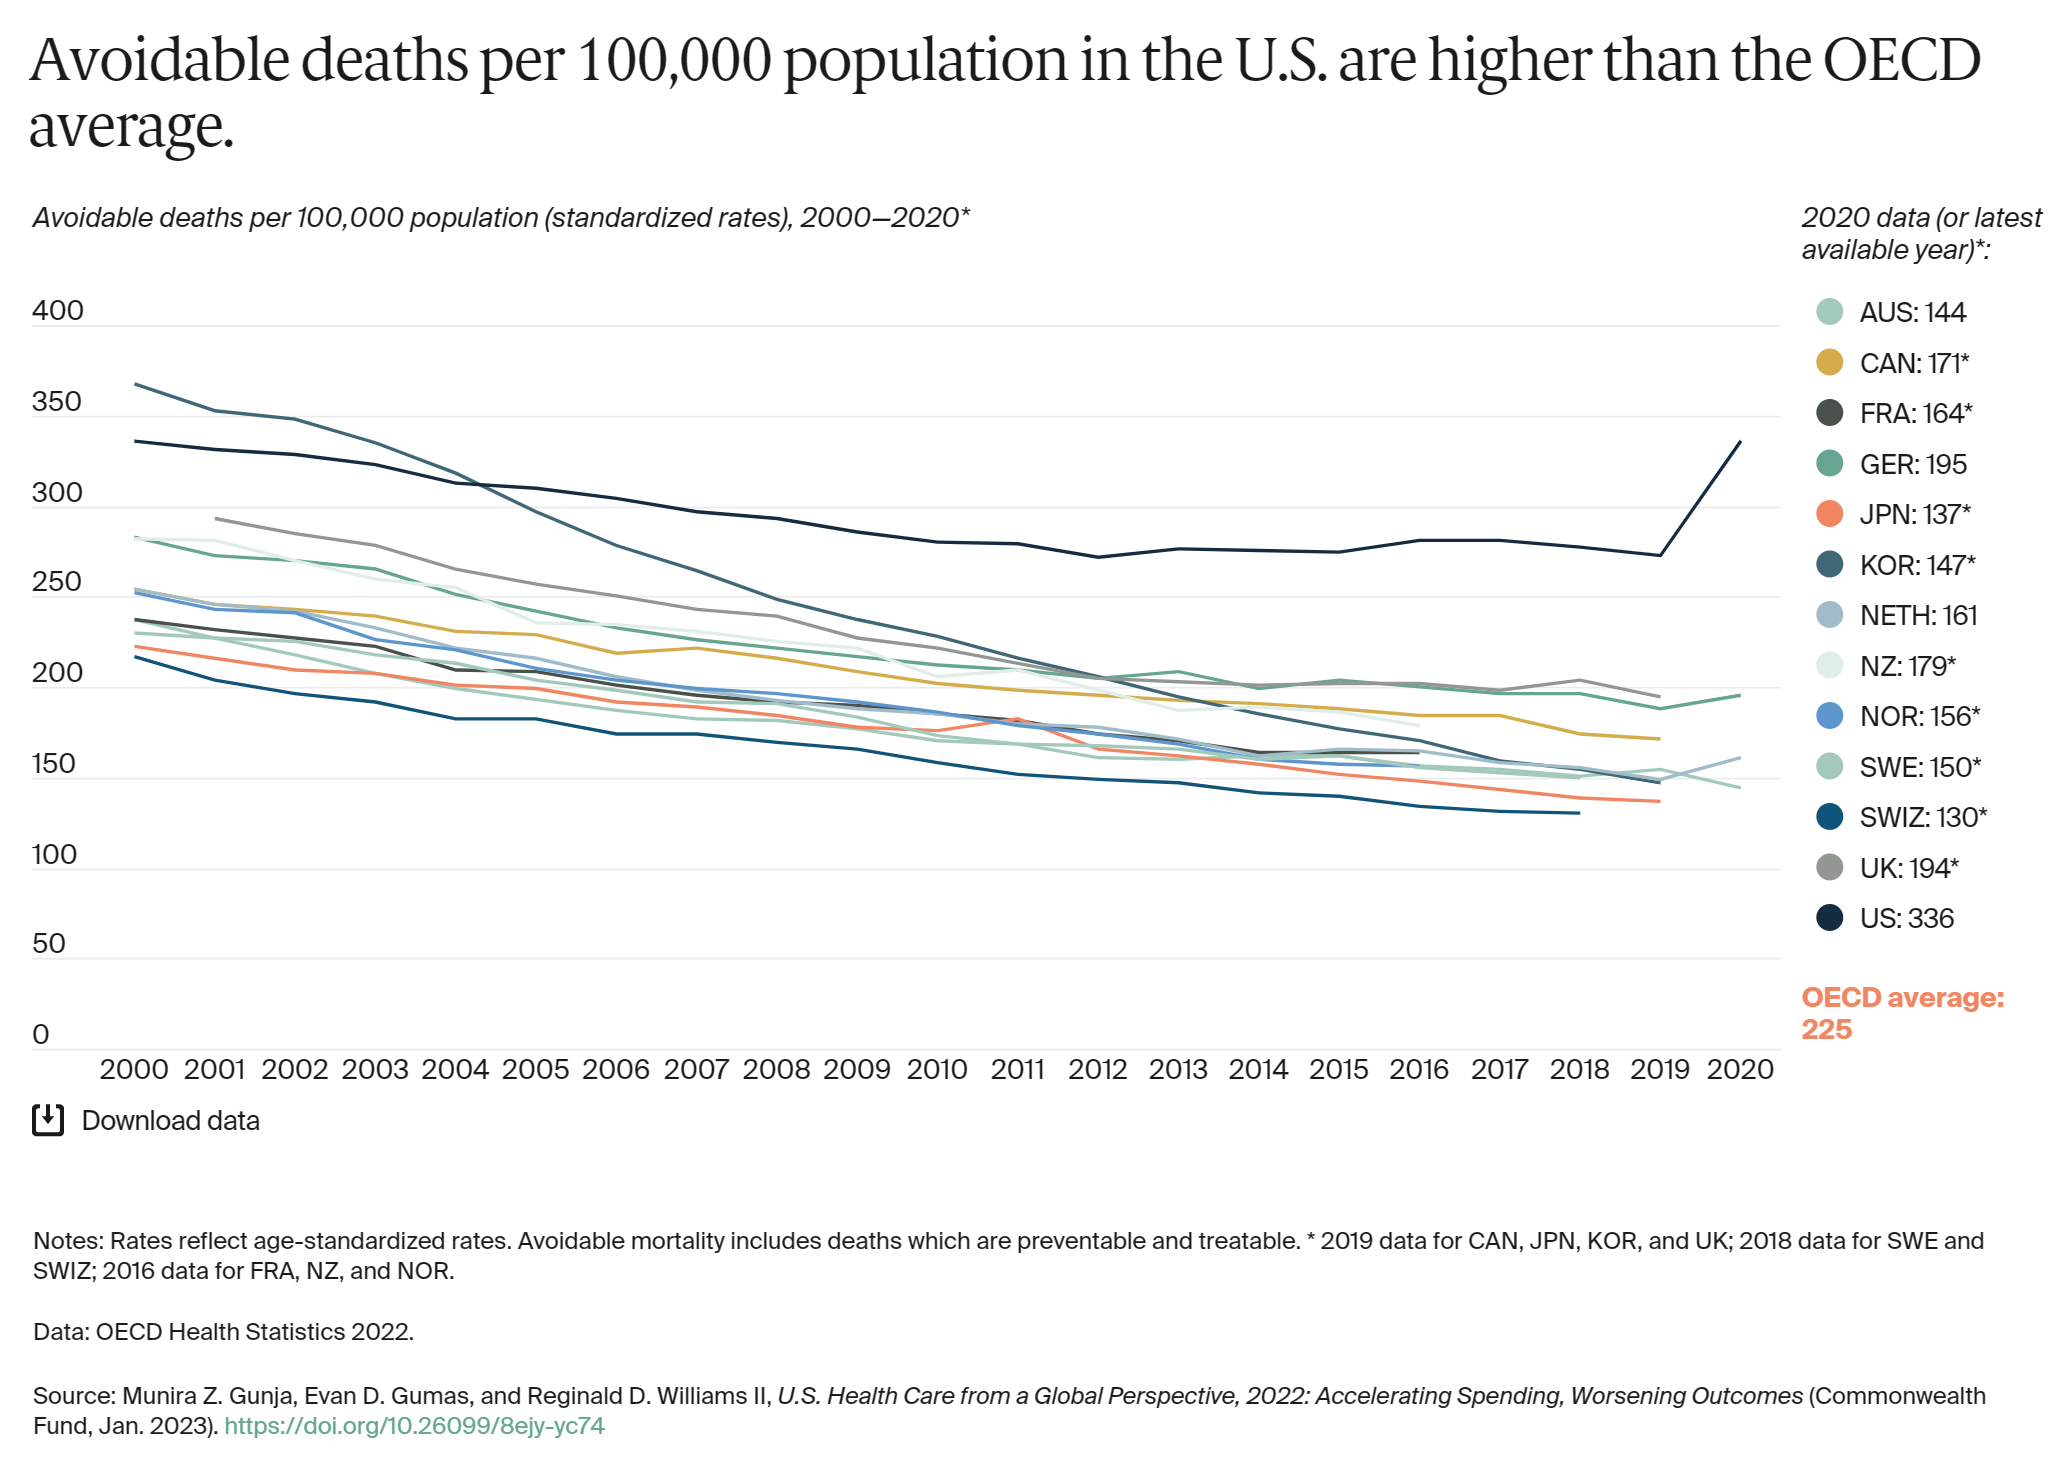
Avoidable mortality refers to deaths that are preventable and treatable. Preventable deaths can be avoided through effective public health measures and through primary prevention, such as nutritional diet and exercise. Treatable mortality can be avoided mainly through timely and effective health care interventions, including regular exams, screenings, and treatment.11 Since 2015, avoidable deaths have been on the rise in the U.S., which had the highest rate in 2020 of all the countries in our analysis.
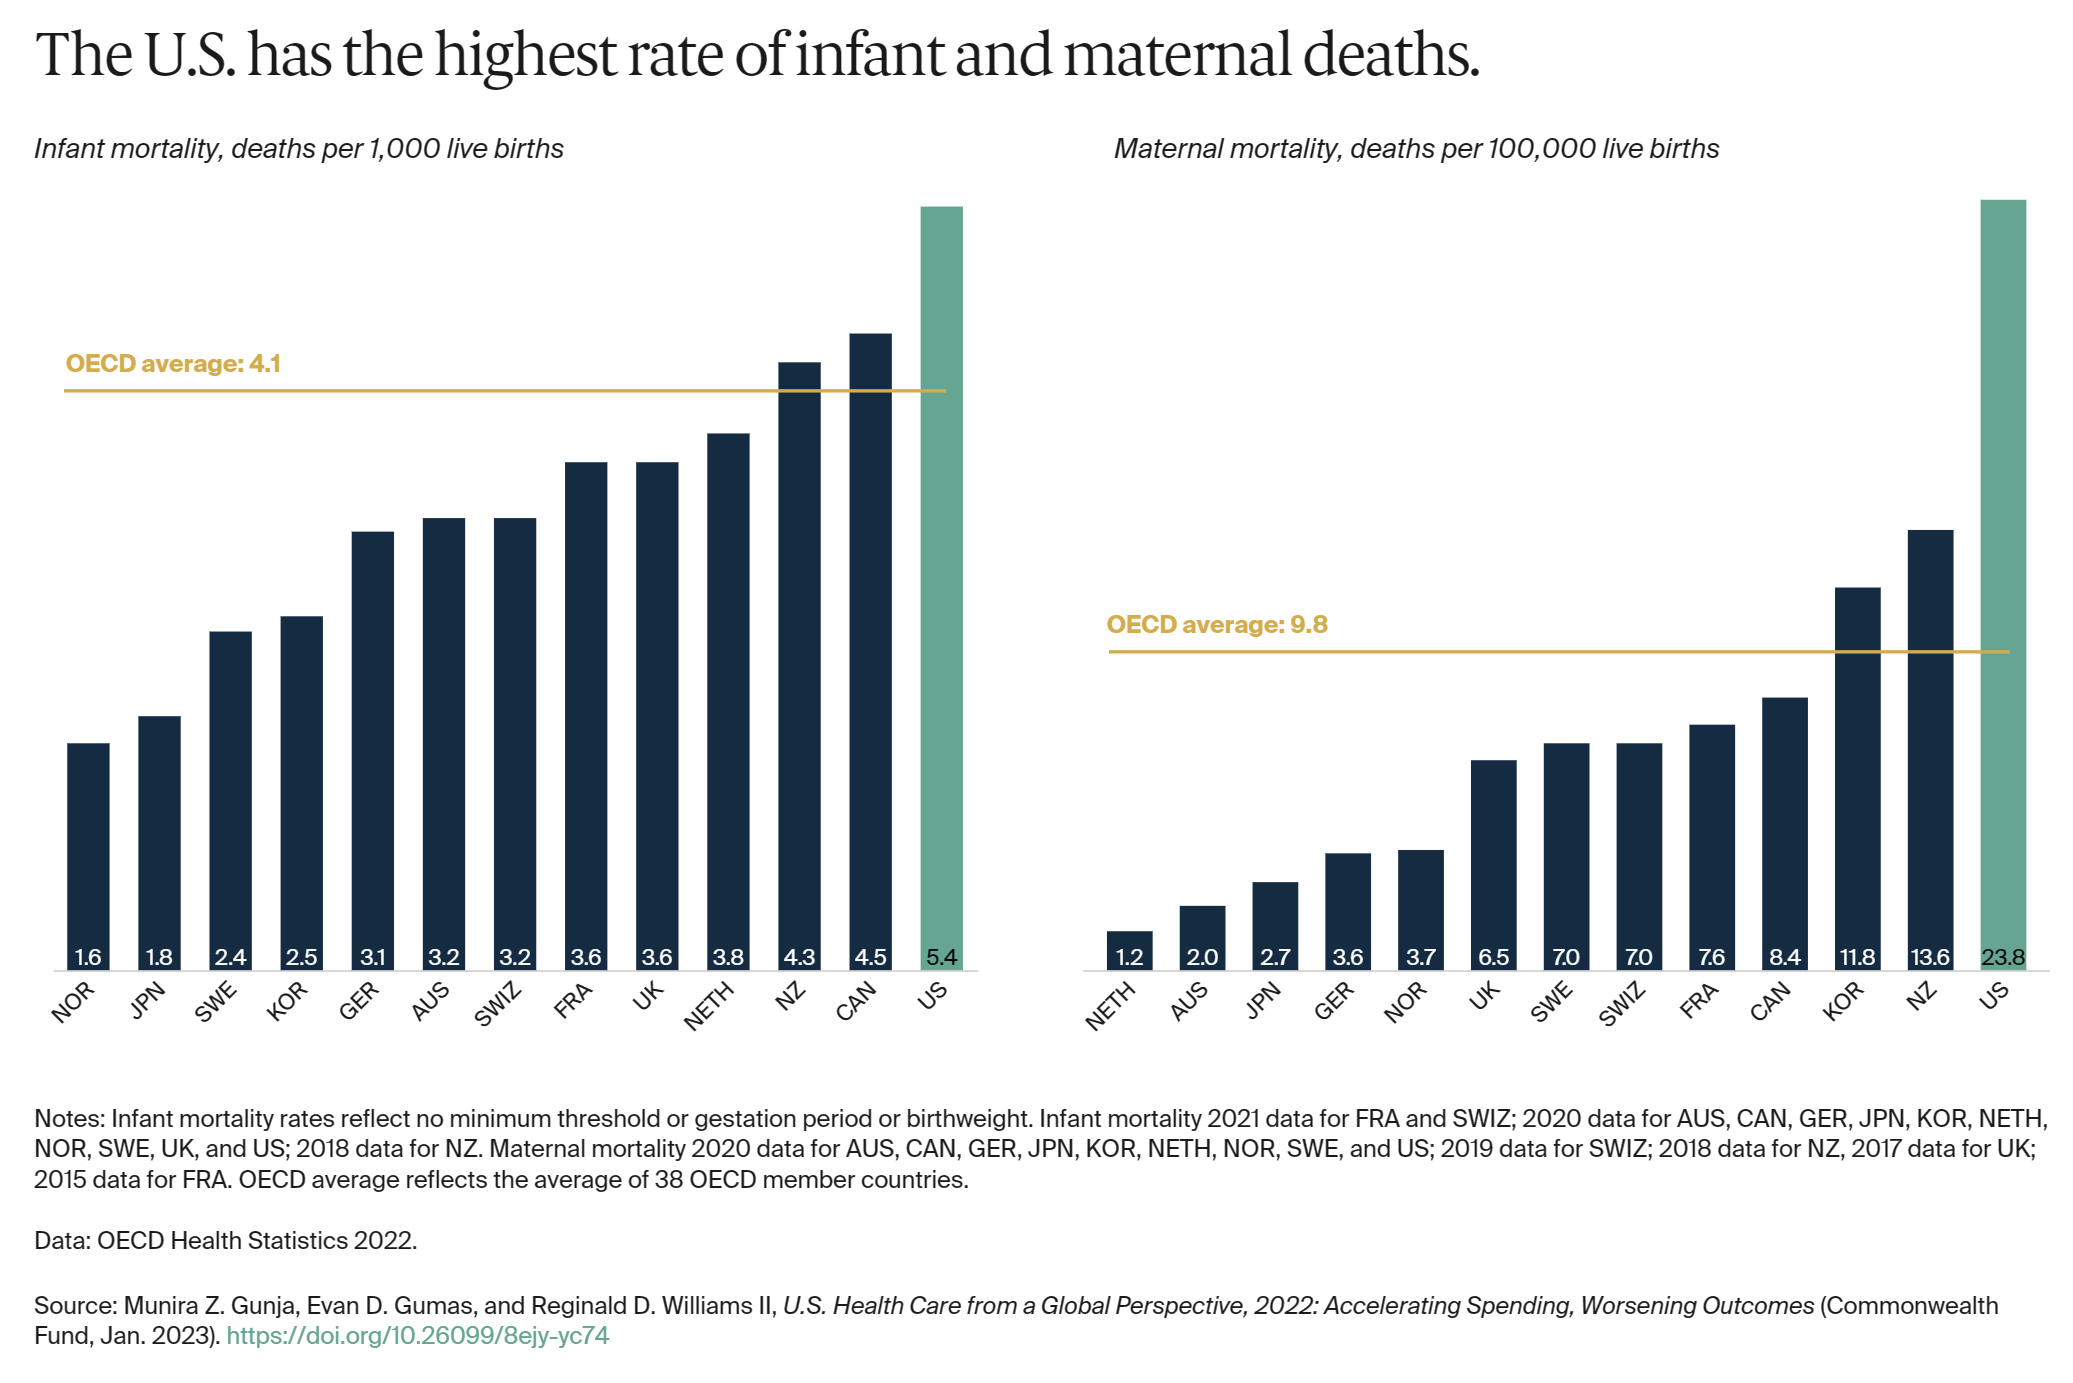
In 2020, the infant mortality rate in the U.S. was 5.4 deaths per 1,000 live births, the highest rate of all the countries in our analysis. In contrast, there were 1.6 deaths per 1,000 live births in Norway.
Women in the U.S. have long had the highest rate of maternal mortality related to complications of pregnancy and childbirth. In 2020, there were nearly 24 maternal deaths for every 100,000 live births in the U.S., more than three times the rate in most of the other high-income countries we studied. A high rate of cesarean section, inadequate prenatal care, and socioeconomic inequalities contributing to chronic illnesses like obesity, diabetes, and heart disease may all help explain high U.S. infant and maternal mortality.12
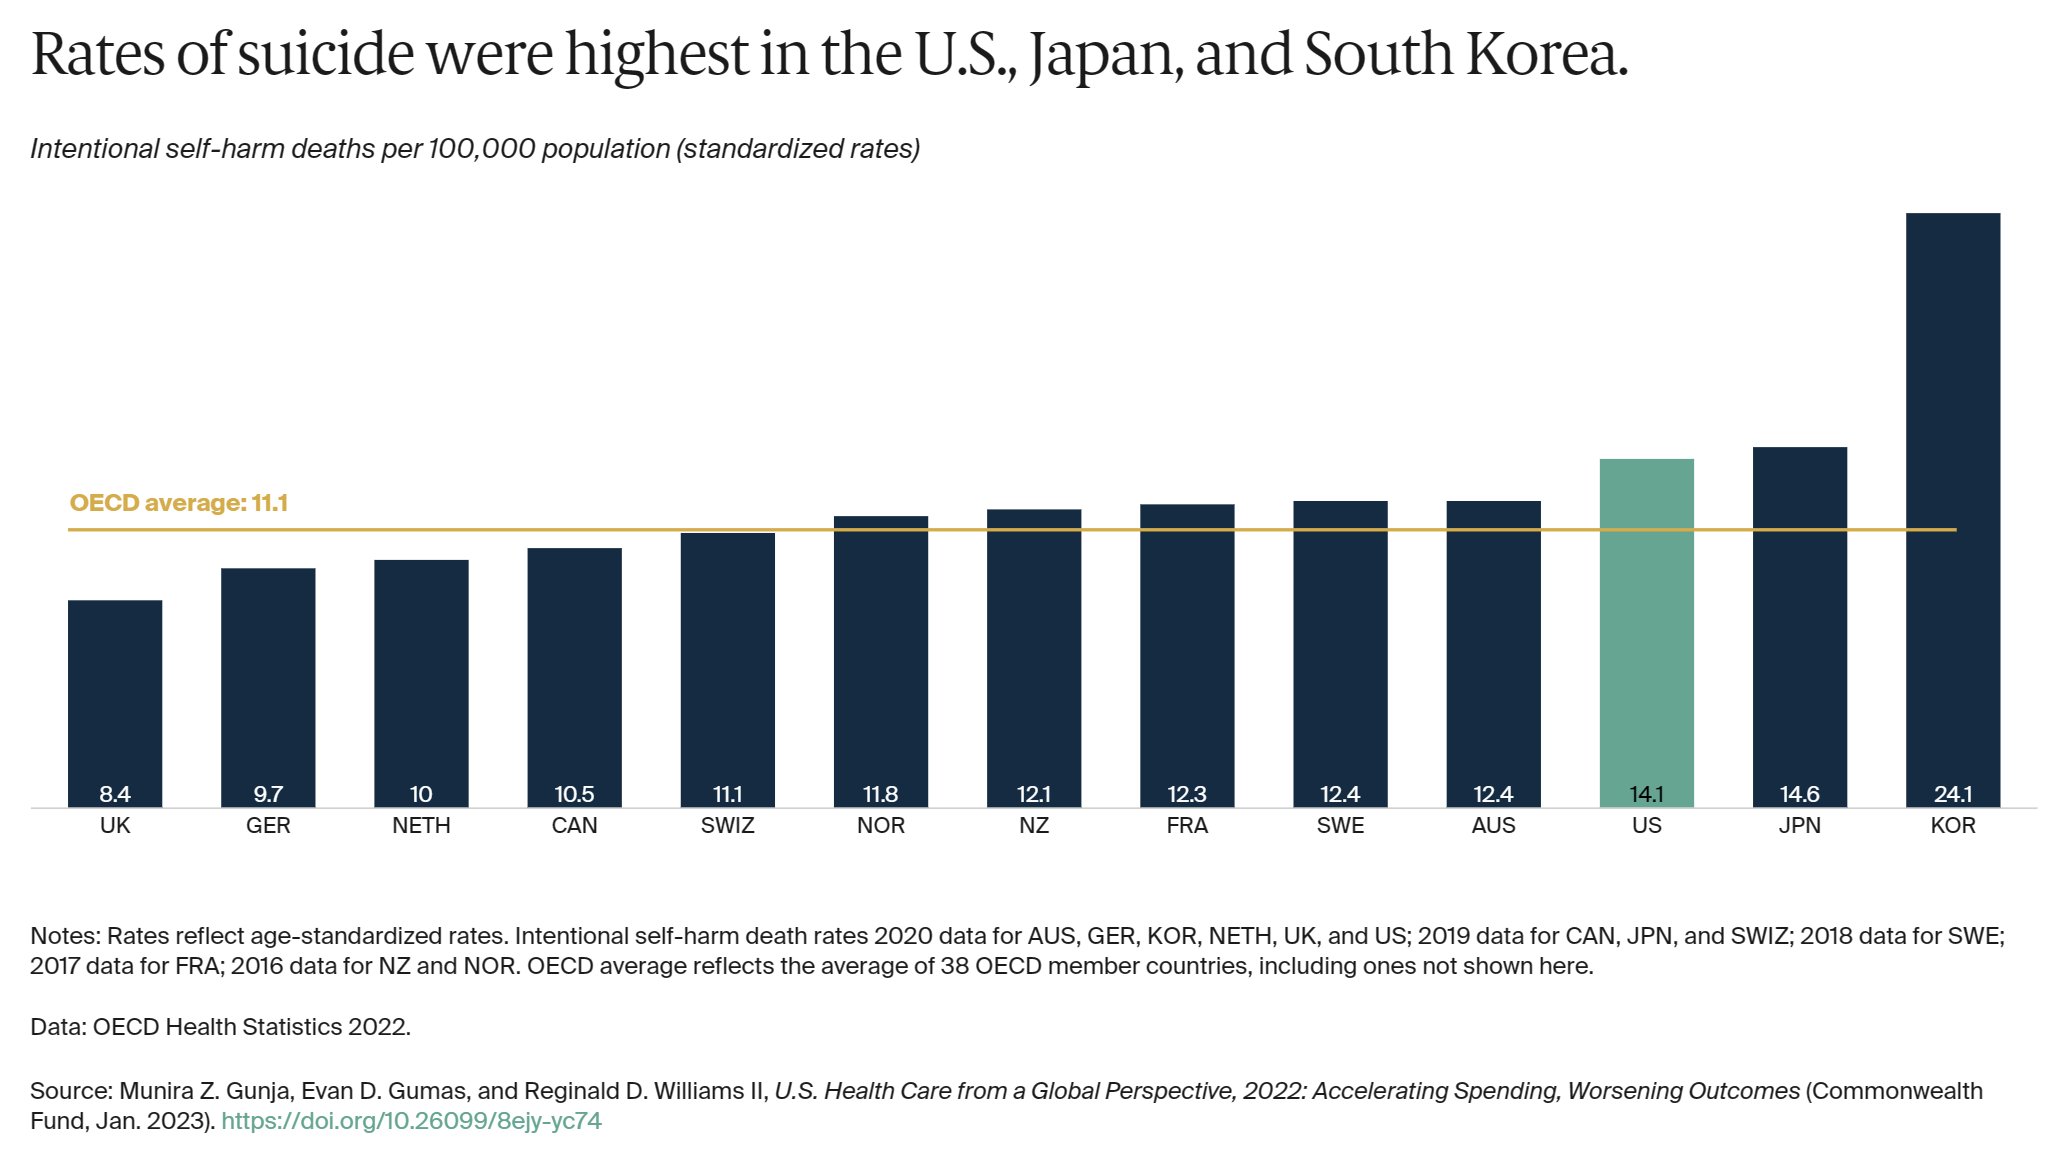
Elevated suicide rates, which have dramatically increased during the COVID-19 pandemic, can indicate a high burden of mental illness.13 The U.S. has the third-highest suicide rate, while the U.K. has the lowest — nearly half the U.S. rate.
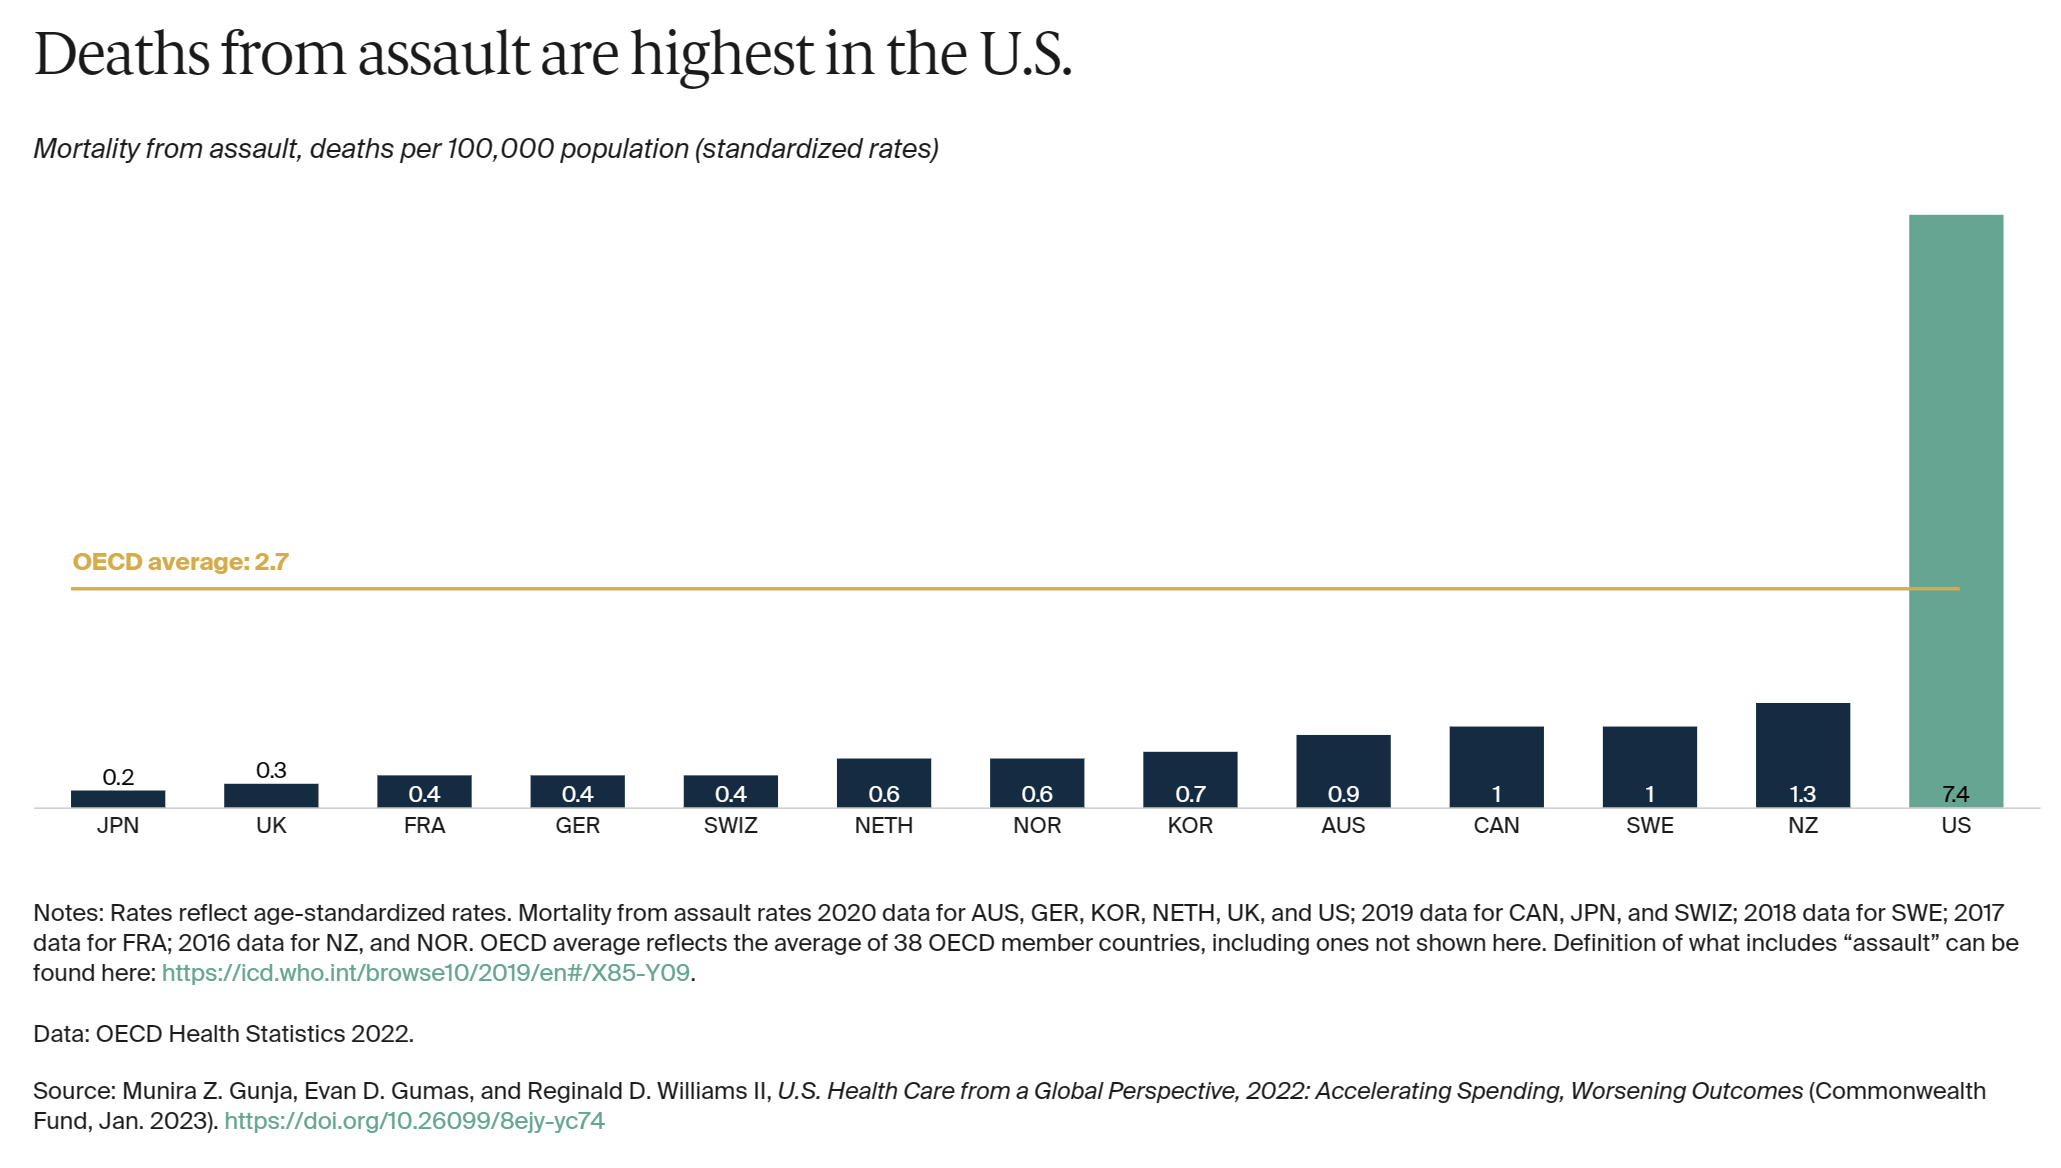
The U.S. is an outlier in deaths from physical assault, which includes gun violence. Its 7.4 deaths per 100,000 people is far above the OECD average of 2.7, and at least seven times higher than all other high-income countries in our study, except New Zealand.
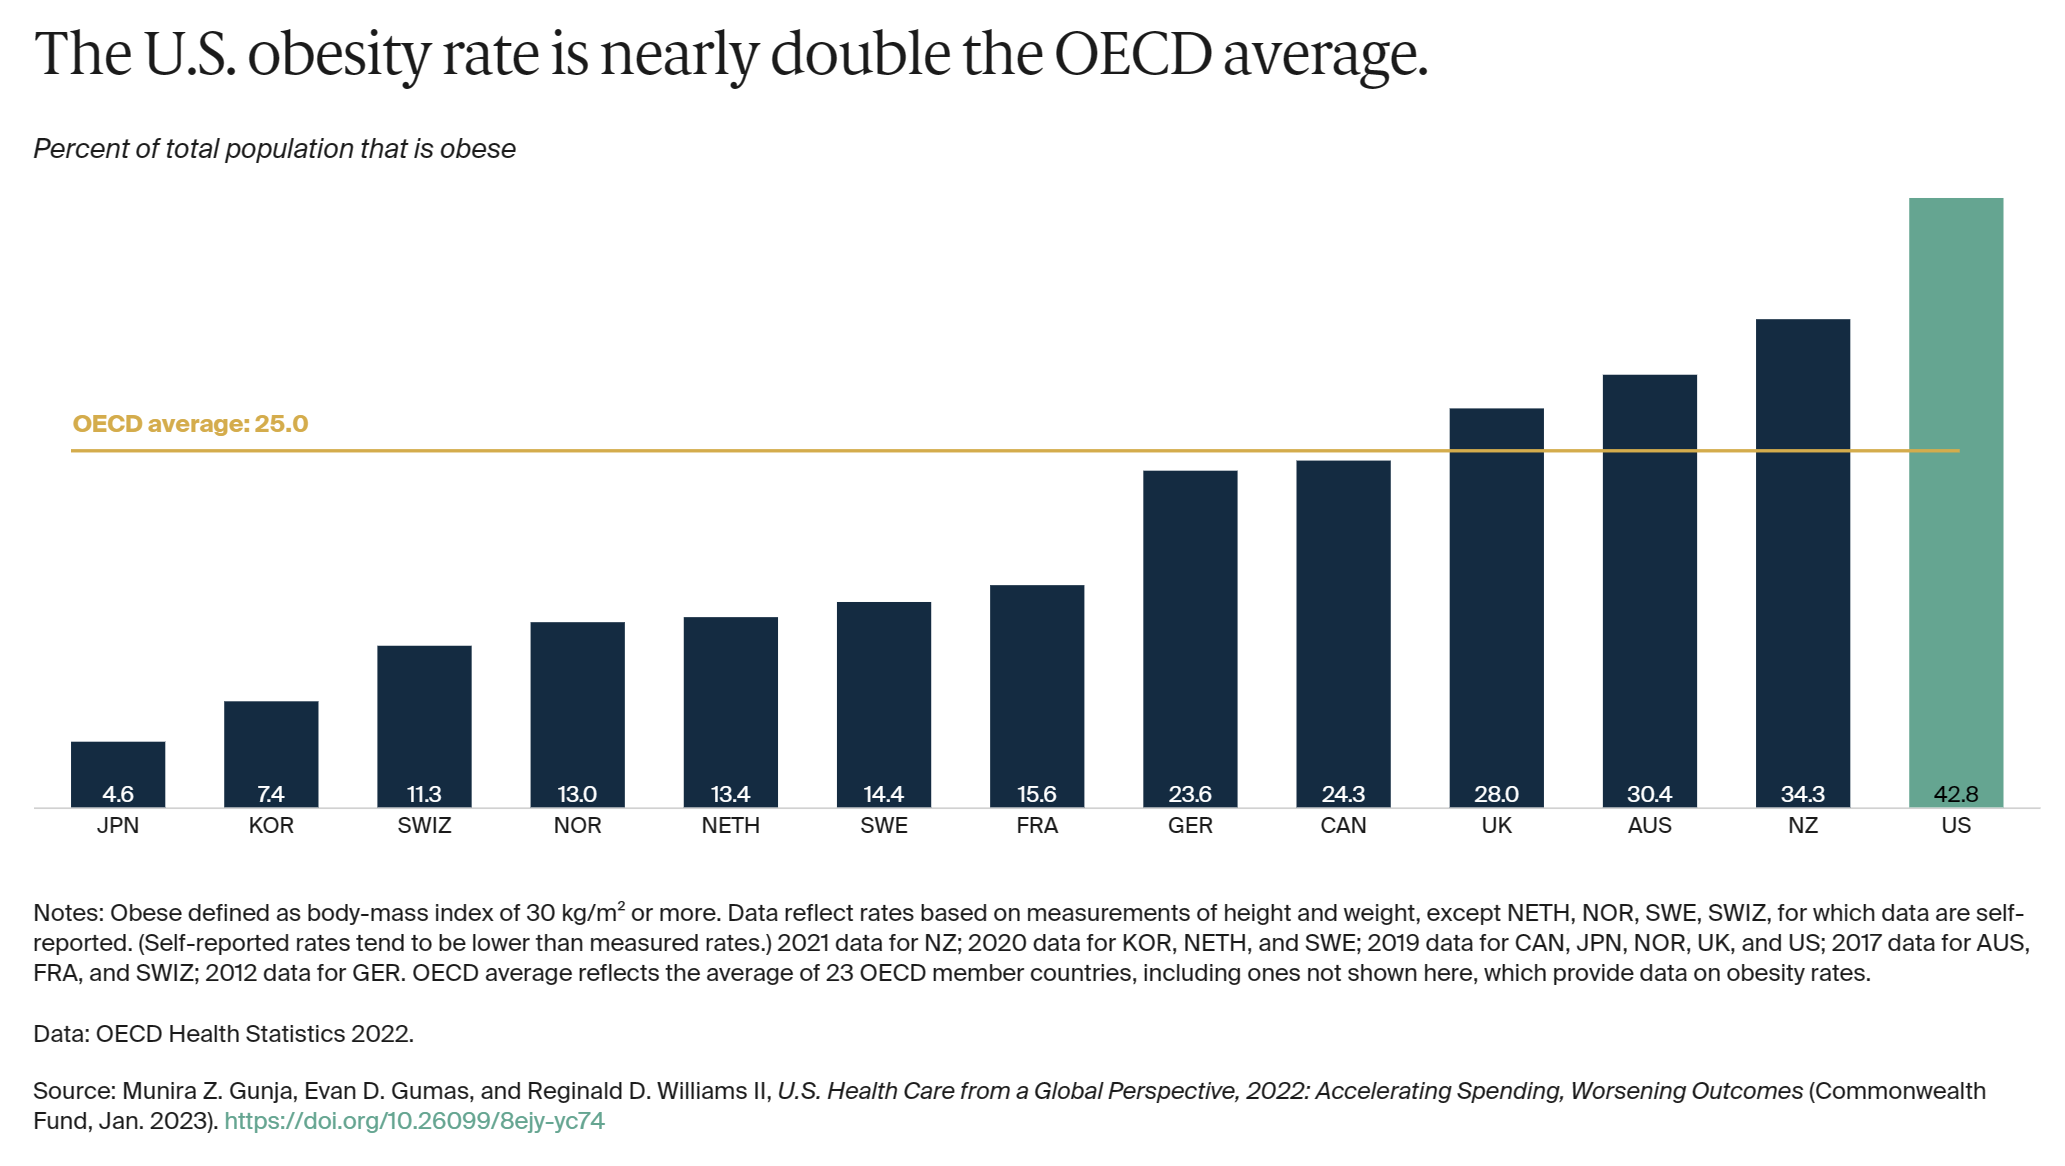
Obesity is a key risk factor for chronic conditions such as diabetes, hypertension and other cardiovascular diseases, and cancer. Issues that contribute to obesity include unhealthy living environments, less-regulated food and agricultural sectors, lower socioeconomic status, and higher rates of behavioral health problems.14
The U.S. has the highest obesity rate among the countries we studied, where data was available — nearly two times higher than the OECD average.
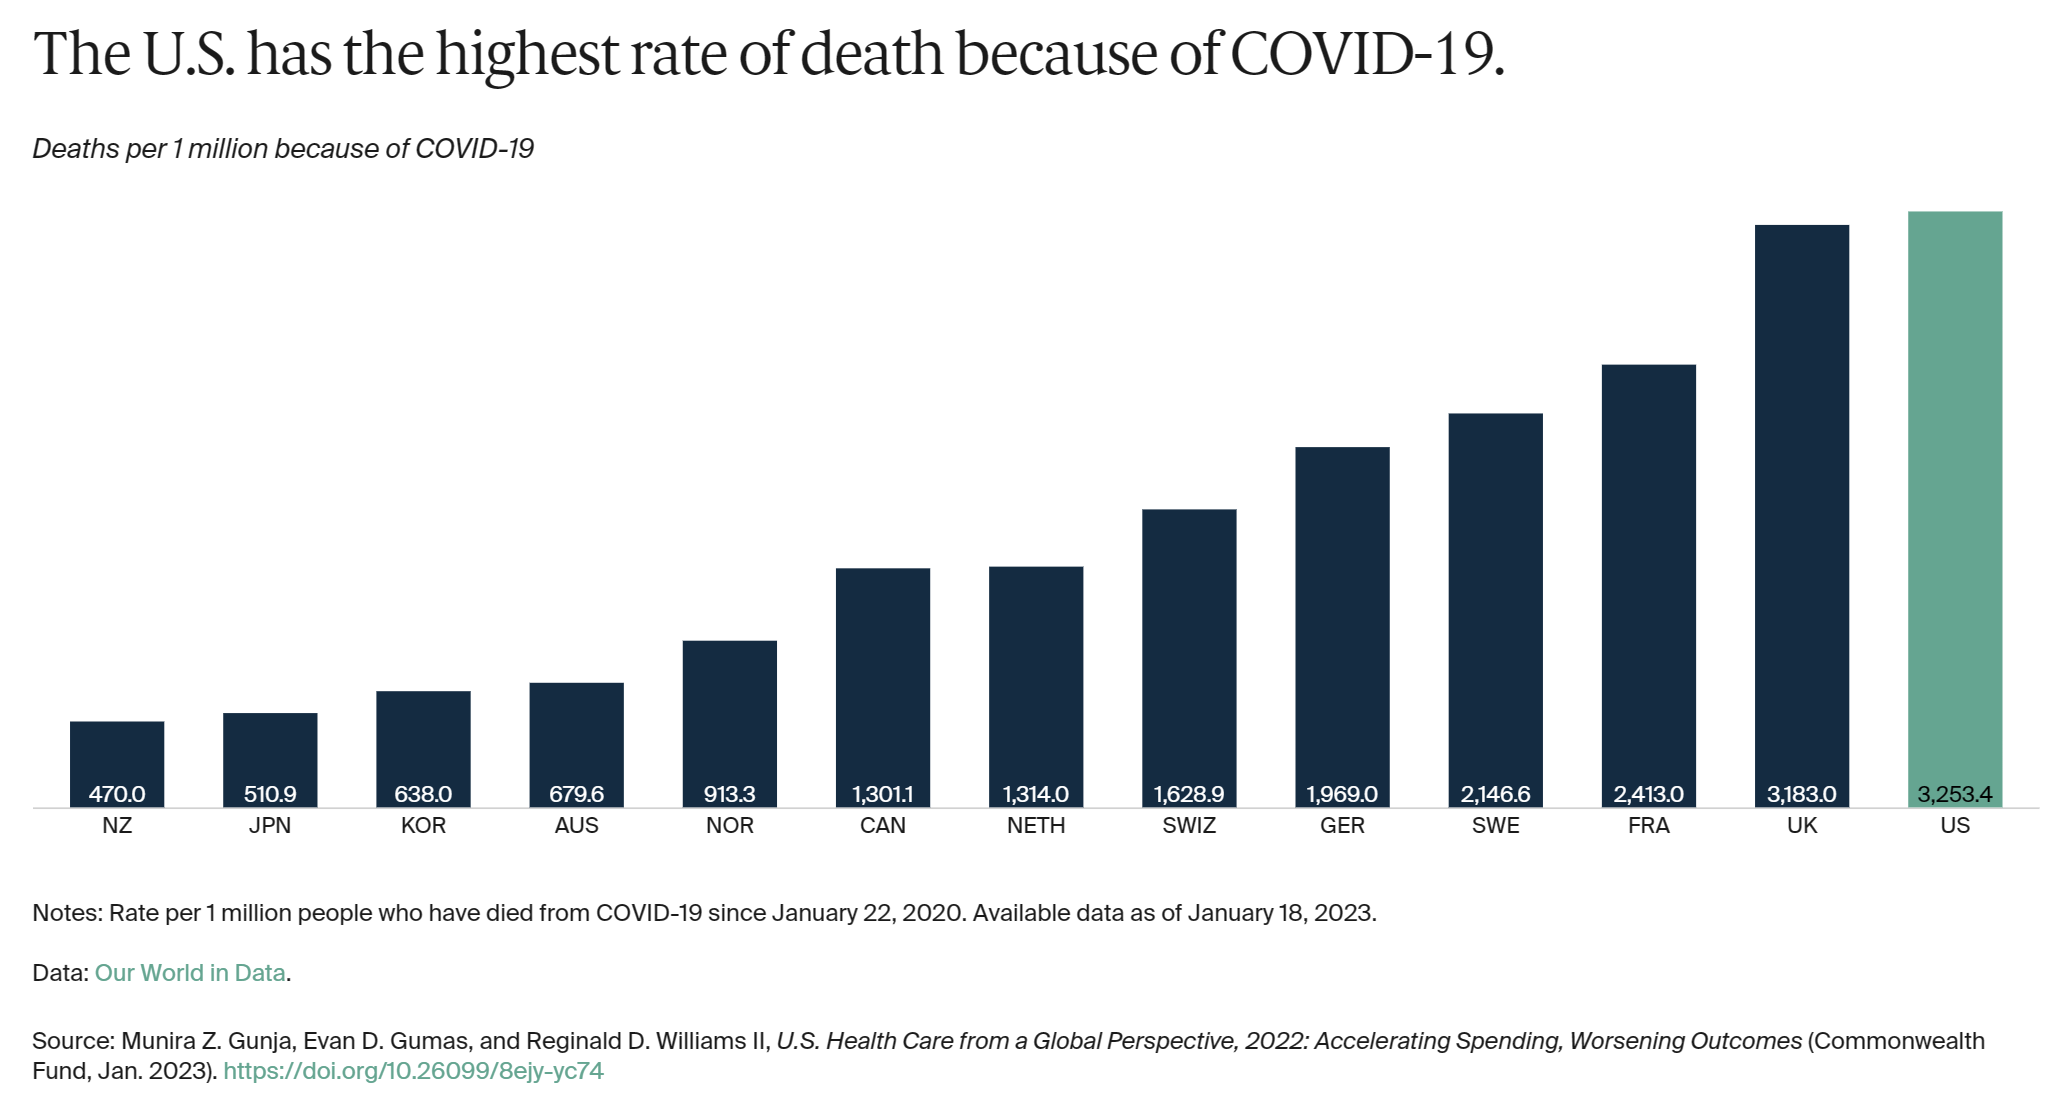
Since the start of the COVID-19 pandemic, more people in the U.S. have died from the coronavirus than any in any other high-income country. For every 1 million cases between January 22, 2020, and January 18, 2023, there were more than 3,000 deaths in the U.S. [more]
U.S. Health Care from a Global Perspective, 2022: Accelerating Spending, Worsening Outcomes