World energy system struggled in face of geopolitical and environmental crises in 2022 – Coal production reached record high – CO2 emissions reached record level – “We are still heading in the opposite direction to that required by the Paris Agreement”
26 June 2023 (EI) – The Energy Institute (EI) and partners KPMG and Kearney today released the 72nd annual edition of the Statistical Review of World Energy, presenting for the first time full global energy data for 2022.
Five key themes emerge from the data
- Post-COVID, transport fuel demand patterns continued to return, but with major variations across geographies and fuel types. China was a major outlier, in particular in terms of jet fuel remaining significantly below its pre-COVID level, due to its ‘zero COVID’ policy.
- The Ukraine conflict and curtailment of Russian supplies to Europe precipitated record international gas prices in Europe (a threefold increase) and Asia (twofold), and unprecedented shifts in global oil and gas trade flows.
- The strong pace of deployment of renewables in the power sector continued, driven by solar and wind. 2022 saw the largest ever increase in wind and solar new build capacity. Together they reached a record 12% share of power generation, with solar up 25% and wind up 13.5%. Renewables (excluding hydro) met 84% of net electricity demand growth in 2022.
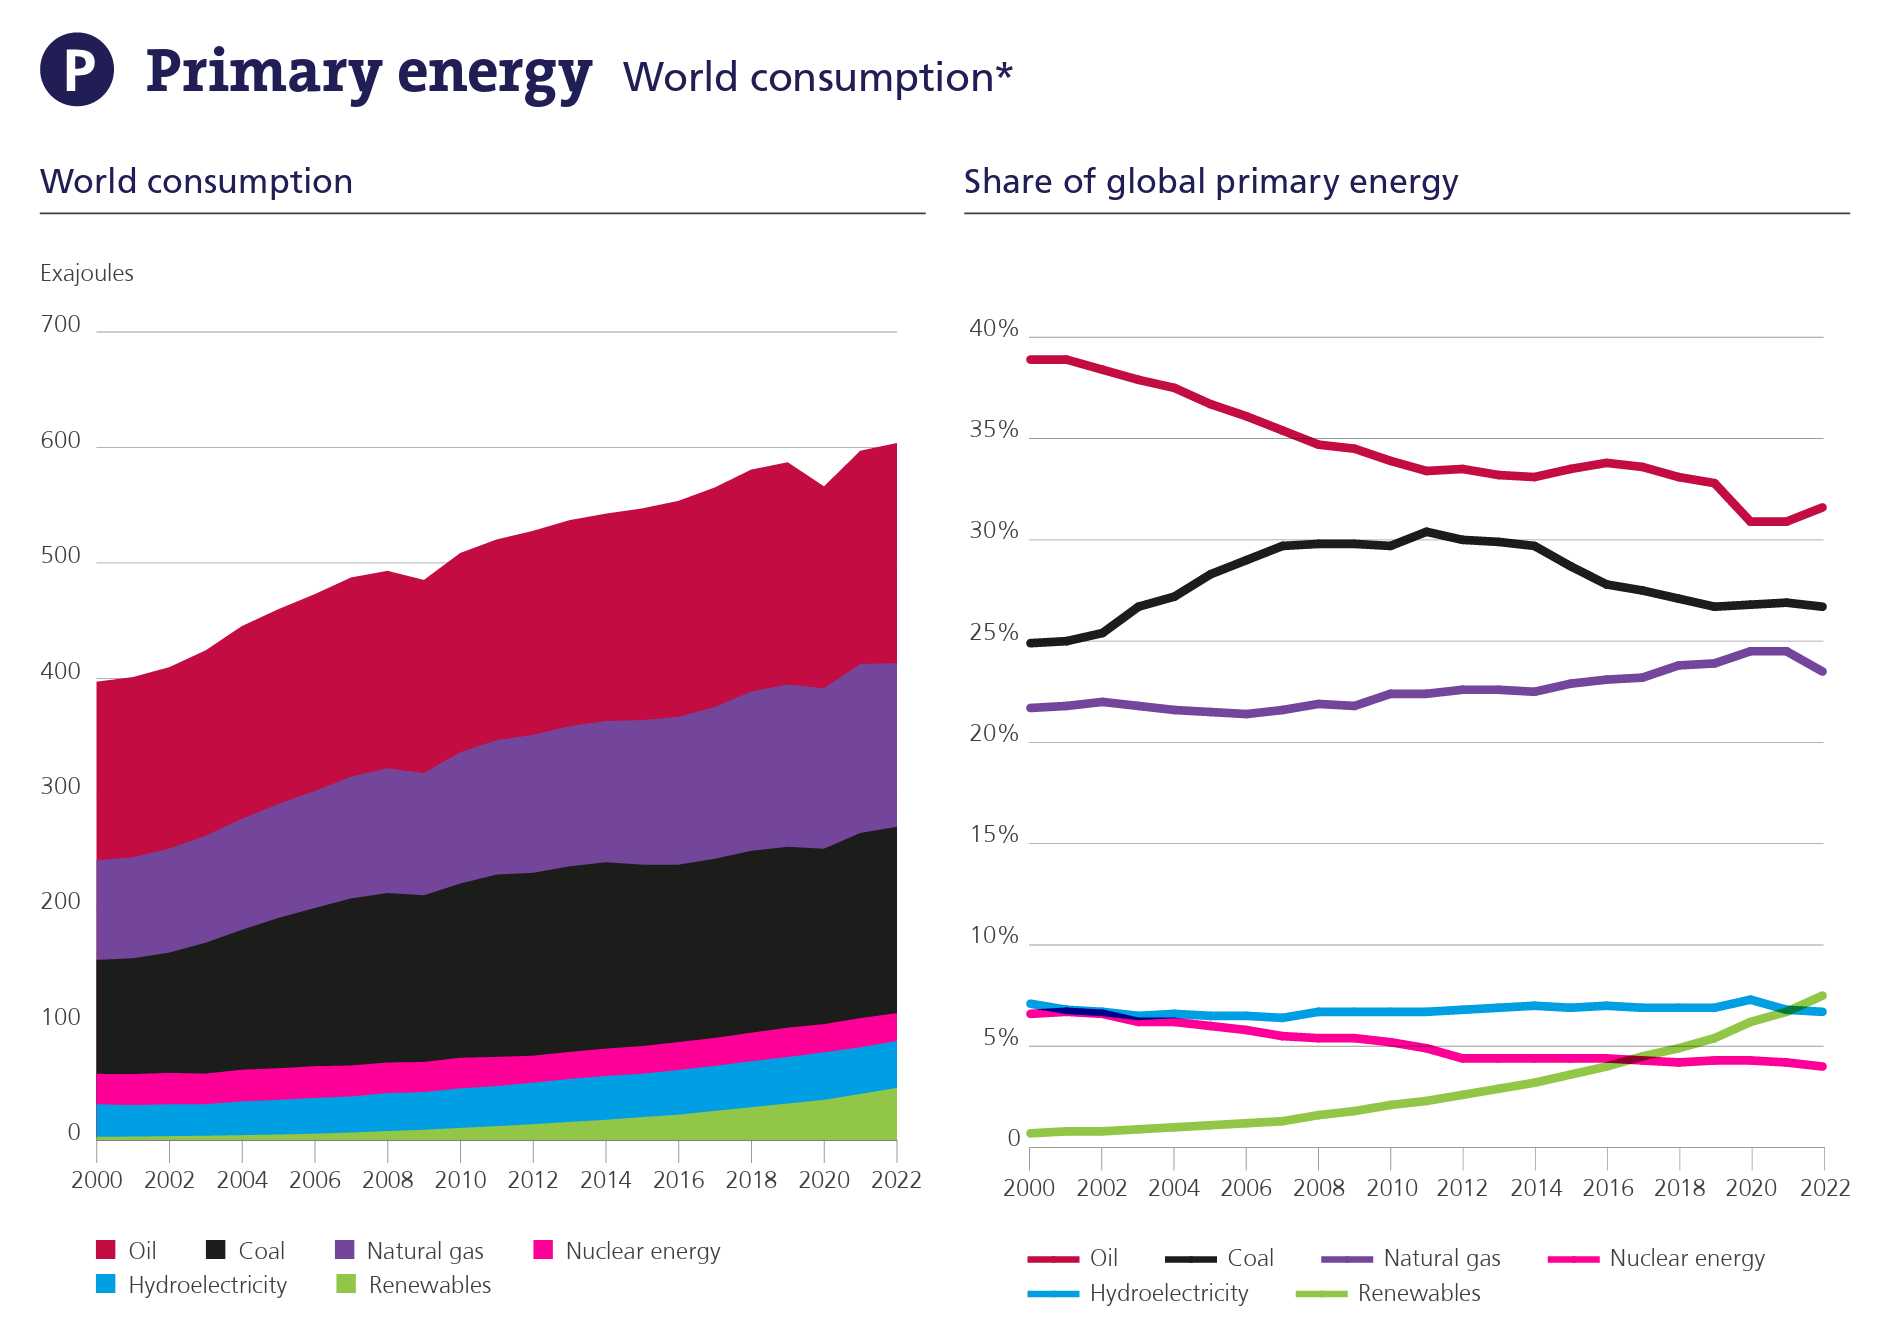
- Global primary energy consumption grew by around 1% in 2022, taking it to nearly 3% above the 2019 pre-COVID level. Within this, gas fell by 3% and renewables (excluding hydro) increased by 13%. The dominance of fossil fuels was largely unchanged at almost 82% of total consumption.
- Global energy-related emissions continued to grow, up 0.8%, despite strong growth in renewables.
EI President Juliet Davenport OBE HonFEI said:
“The EI Statistical Review provides a high-level view of how our energy systems are adapting to escalating geopolitical and environmental crises.
“2022 saw some of the worst ever impacts of climate change – the devastating floods affecting millions in Pakistan, the record heat events across Europe and North America – yet we have to look hard for positive news on the energy transition in this new data.
“Despite further strong growth in wind and solar in the power sector, overall global energy-related greenhouse gas emissions increased again. We are still heading in the opposite direction to that required by the Paris Agreement.”
EI Chief Executive Nick Wayth CEng FEI FIMechE, said:
“As the world emerged from the pandemic and its impact on demand, 2022 witnessed energy markets again in crisis, with the Ukraine conflict upending assumptions about supply around the world. That in turn precipitated a price crisis and profound cost-of-living pressures across many economies.
“The EI Statistical Review shows how the world’s energy markets struggled to respond to the crisis, how the trade and flow of energy contorted, and how vulnerable our economies are to supply and price shocks.”
Simon Virley CB FEI, Vice Chair and Head of Energy and Natural Resources, KPMG in the UK said:
“The EI Statistical Review is essential reading for policymakers around the world trying to balance the energy trilemma. All aspects of the trilemma were put under severe strain in 2022. Despite record growth in renewables, the share of world energy still coming from fossil fuels remains stubbornly stuck at 82%, which should act as a clarion call for governments to inject more urgency into the energy transition.”
Richard Forrest FEI, Global Sustainability Lead Partner and Chair Energy Transition Institute, Kearney said:
“2022 was a turbulent year for the energy industry, with the Ukraine conflict and the tail end of the pandemic driving energy cost and security concerns to the top of the priority list in many regions. The global energy consumption increased 1.1% over the year, with a 0.8% increase in greenhouse gas emissions reinforcing the need for urgent action to get the world on track to meet the Paris targets. The need to drive the energy transition at pace to deliver clean, affordable and secure energy has never been greater.”
Primary energy
- Primary energy demand growth slowed in 2022, increasing 1.1%, compared to 5.5% in 2021, and taking it to around 3% above the 2019 pre-COVID level.
- Consumption increased in all regions apart from Europe (-3.8%) and CIS (-5.8%).
- Renewables’ (excluding hydro) share of primary energy consumption reached 7.5%, an increase of nearly 1% over the previous year.
- Fossil fuel consumption as a percentage of primary energy remained steady at 82%.
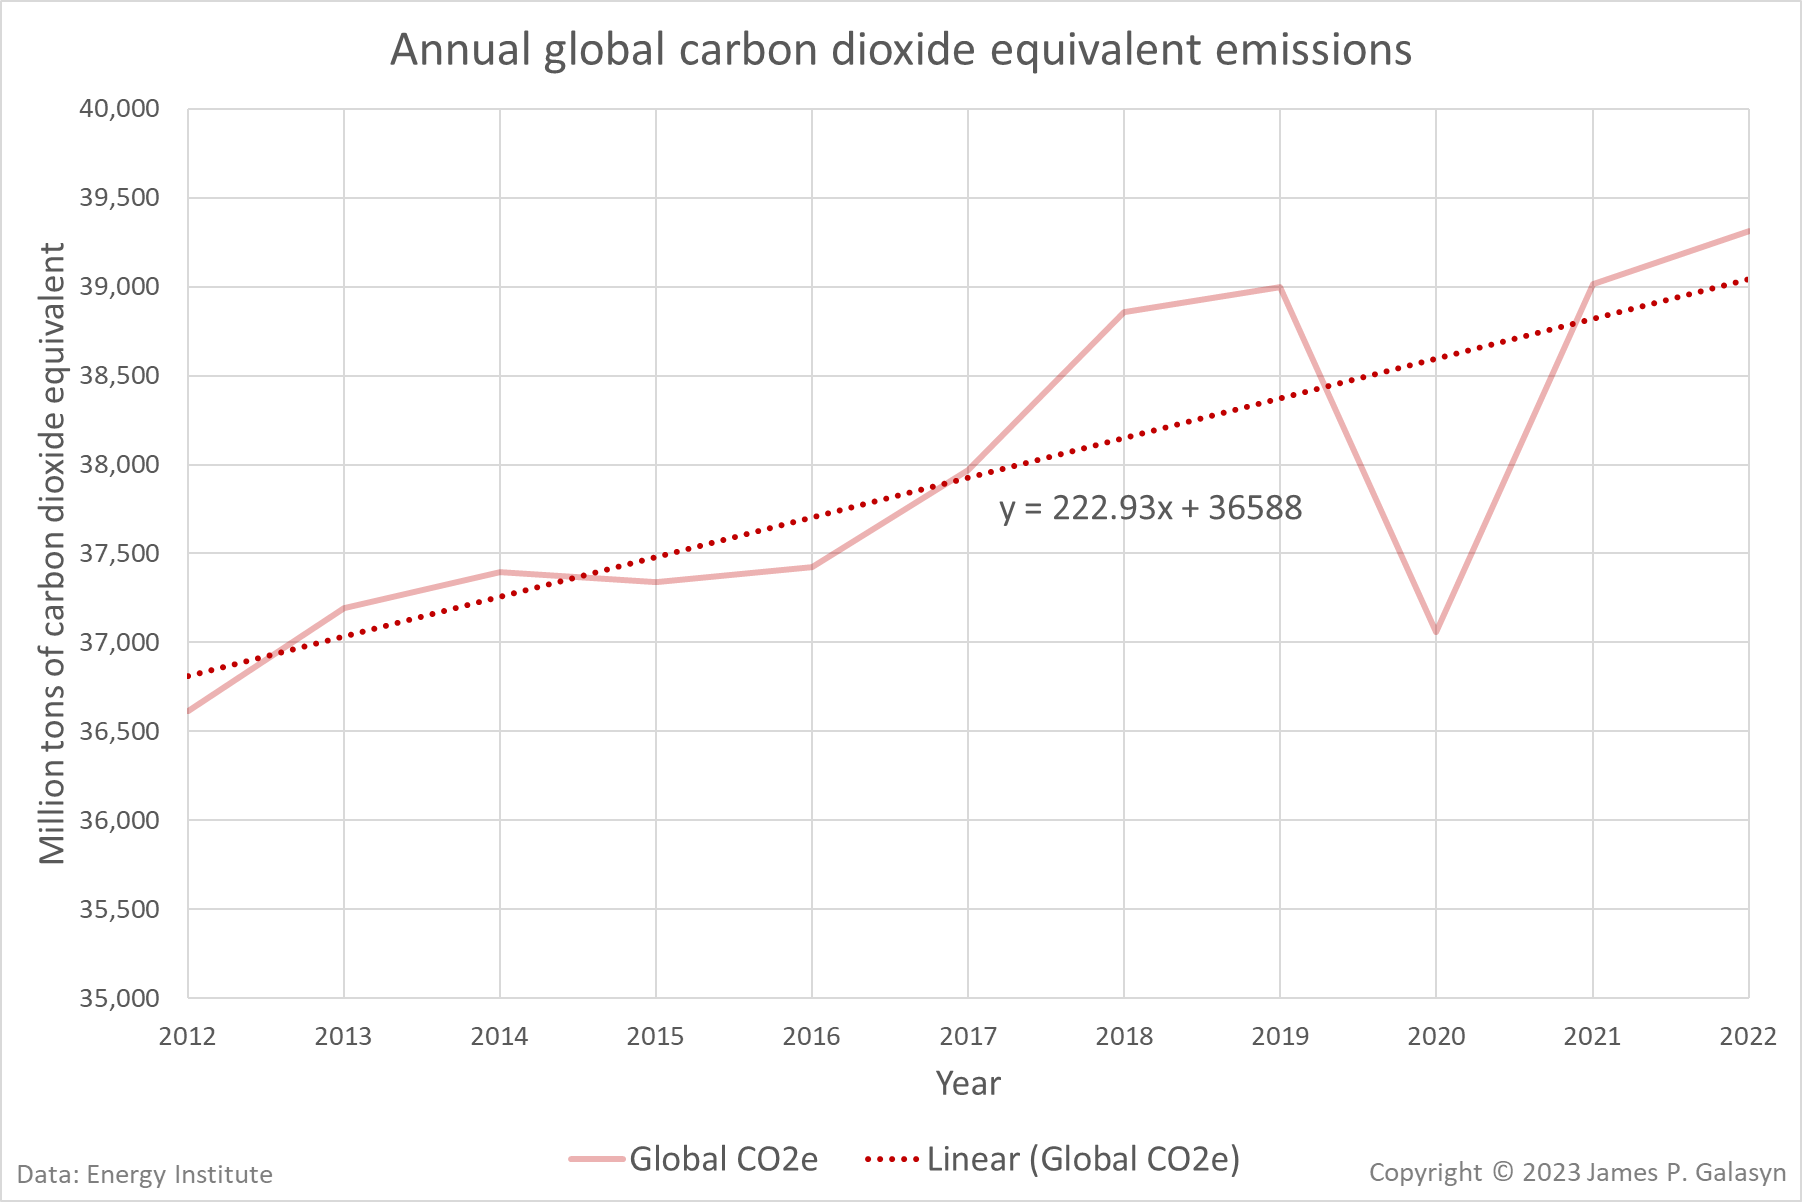
Carbon emissions
- Carbon dioxide emissions from energy use, industrial processes, flaring and methane (in carbon dioxide equivalent terms) continued to rise to a new high growing 0.8% in 2022 to 39.3 GtCO2e, with emissions from energy use rising 0.9% to 34.4 GtCO2.
- In contrast, carbon dioxide emissions from flaring decreased by 3.8% and emissions from methane and industrial processes decreased by 0.2%.
Oil
- Brent crude oil prices averaged $101/bbl in 2022, its highest level since 2013.
- Oil consumption continued to increase, rising by 2.9 million barrels per day (b/d) to 97.3 million barrels per day (b/d), a smaller increase than was seen between 2020 and 2021. Consumption remained 0.7% below 2019 levels.
- Regionally, OECD consumption increased by 1.4 million b/d and non-OECD by 1.5 million b/d. Most of the growth came from jet/kerosene (0.9 million b/d) and diesel/gasoil (0.7 million b/d).
- Global oil production increased by 3.8 million b/d in 2022, with OPEC+ accounting for more than 60% of the increase. Among all countries, Saudi Arabia (1,182,000 b/d) and the U.S. (1,091,000 b/d), saw the largest increases. Nigeria reported the largest decline in production (184,000 b/d) with production in Libya declining by 181,000 b/d.
- Refining capacity increased slightly by around 534,000 b/d last year driven by an increase in capacity in non-OECD countries.
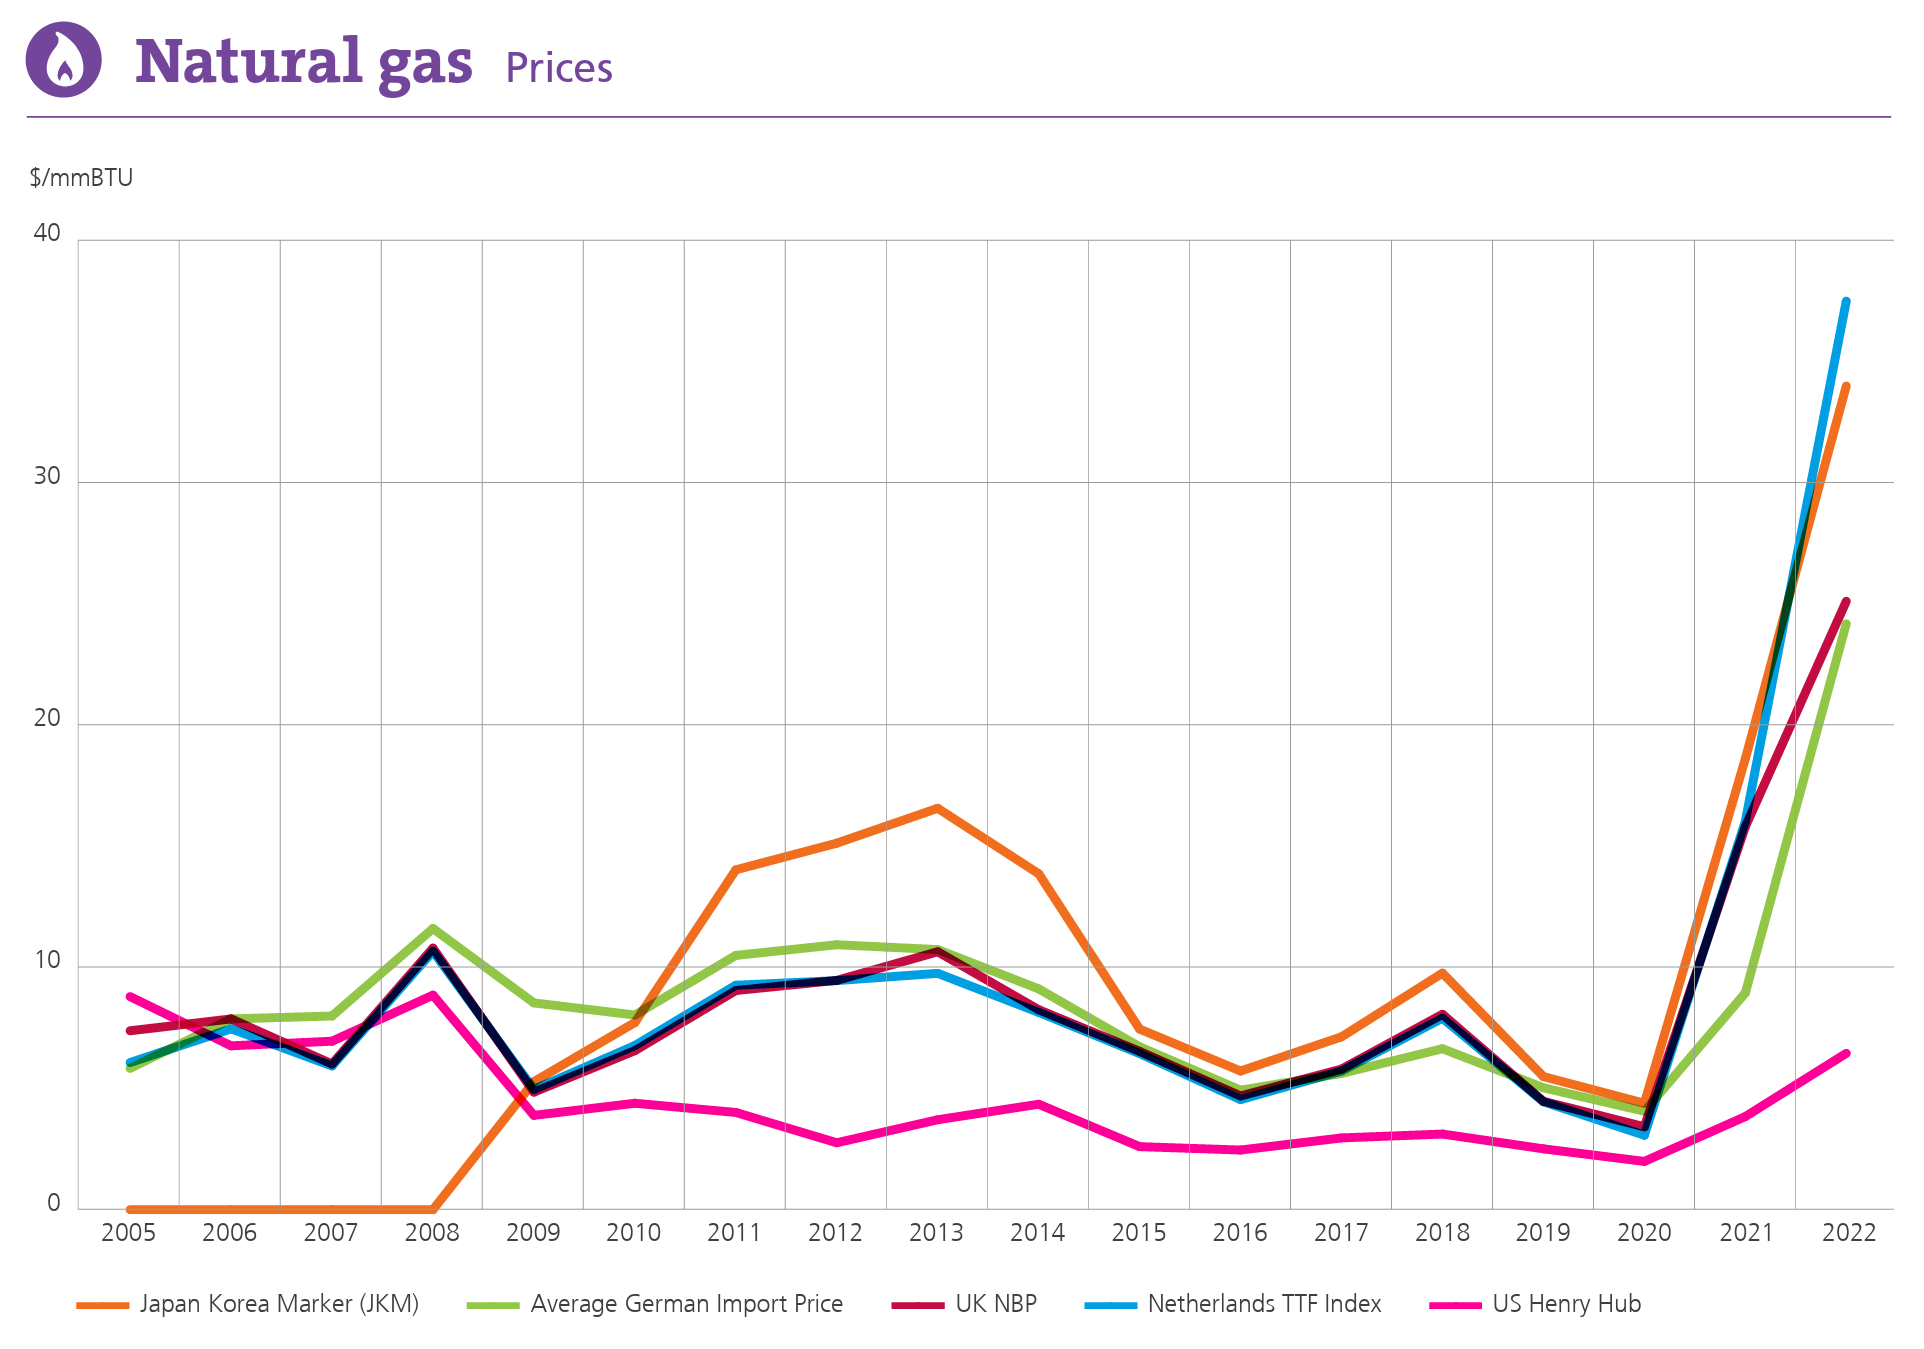
Natural gas
- Natural gas prices reached record levels in Europe and Asia in 2022, rising nearly threefold in Europe (TTF averaging $37/mmBtu) and doubling in the Asian LNG spot market (JKM averaging $34/mmBtu). US Henry Hub prices rose over 50% to average $6.5/mmBtu in 2022 – their highest annual level since 2008.
- Global natural gas demand declined by 3% in 2022 dropping just below the 4 Tcm mark achieved for the first time in 2021. Its share in primary energy in 2022 decreased slightly to 24% (from 25% in 2021).
- Global gas production remained relatively constant compared to 2021.
- LNG supply grew 5% (26 Bcm) to 542 Bcm in 2022, similar to 2021. LNG supply increases came mostly from North America (10 Bcm) and APAC (8 Bcm). All other regions made a positive contribution to LNG supply growth in 2022 (8 Bcm).
- The increase in global LNG demand was triggered by Europe (62 Bcm) in 2022. Countries in the Asia Pacific region reduced their LNG imports by 24 Bcm and those in South & Central America by 11 Bcm.
- Japan replaced China as the world’s largest LNG importer and accounted for close to 60% of global LNG demand growth in 2022. The Asia Pacific region accounted for around 65% of global LNG demand but fell 6.5% compared to 2021 whilst Europe increased its LNG imports by 57%.
- Overall natural gas pipeline net trade fell ~15% globally in 2022 (78 Bcm). European pipeline imports fell by 35% (82 Bcm), almost entirely attributable to supplies from Russia. Overall, Russian total pipeline exports fell 38%. The Middle East increased its pipeline exports by 12%. China increased its pipeline imports by 5 Bcm.
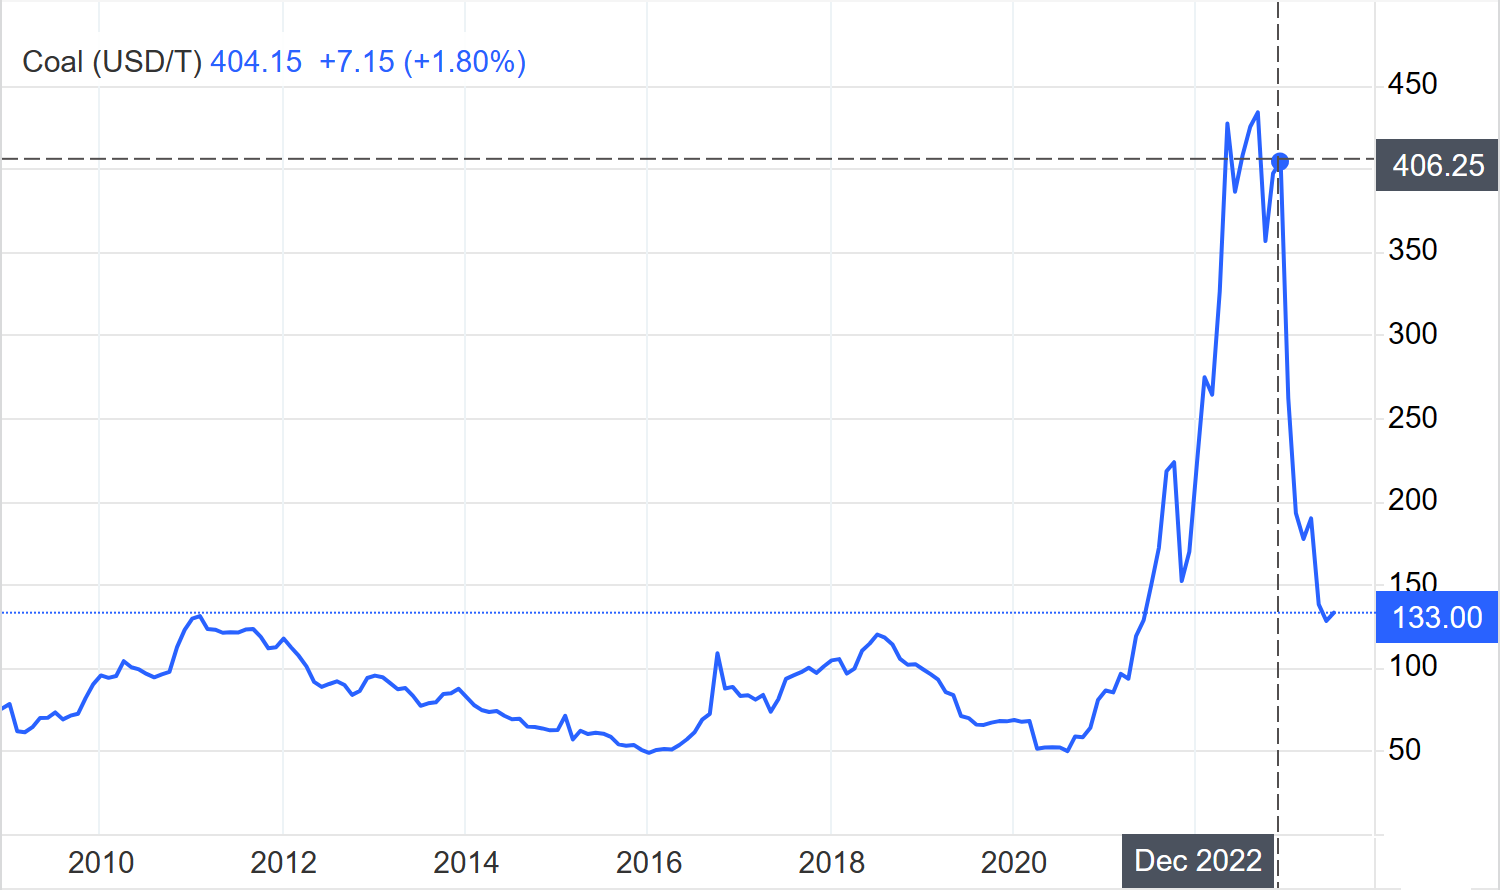
Coal
- Coal prices reached record levels in 2022, with European prices averaging $294/tonne and the Japan CIF spot price averaging $225/tonne (increases of 145% and 45% over 2021 respectively).
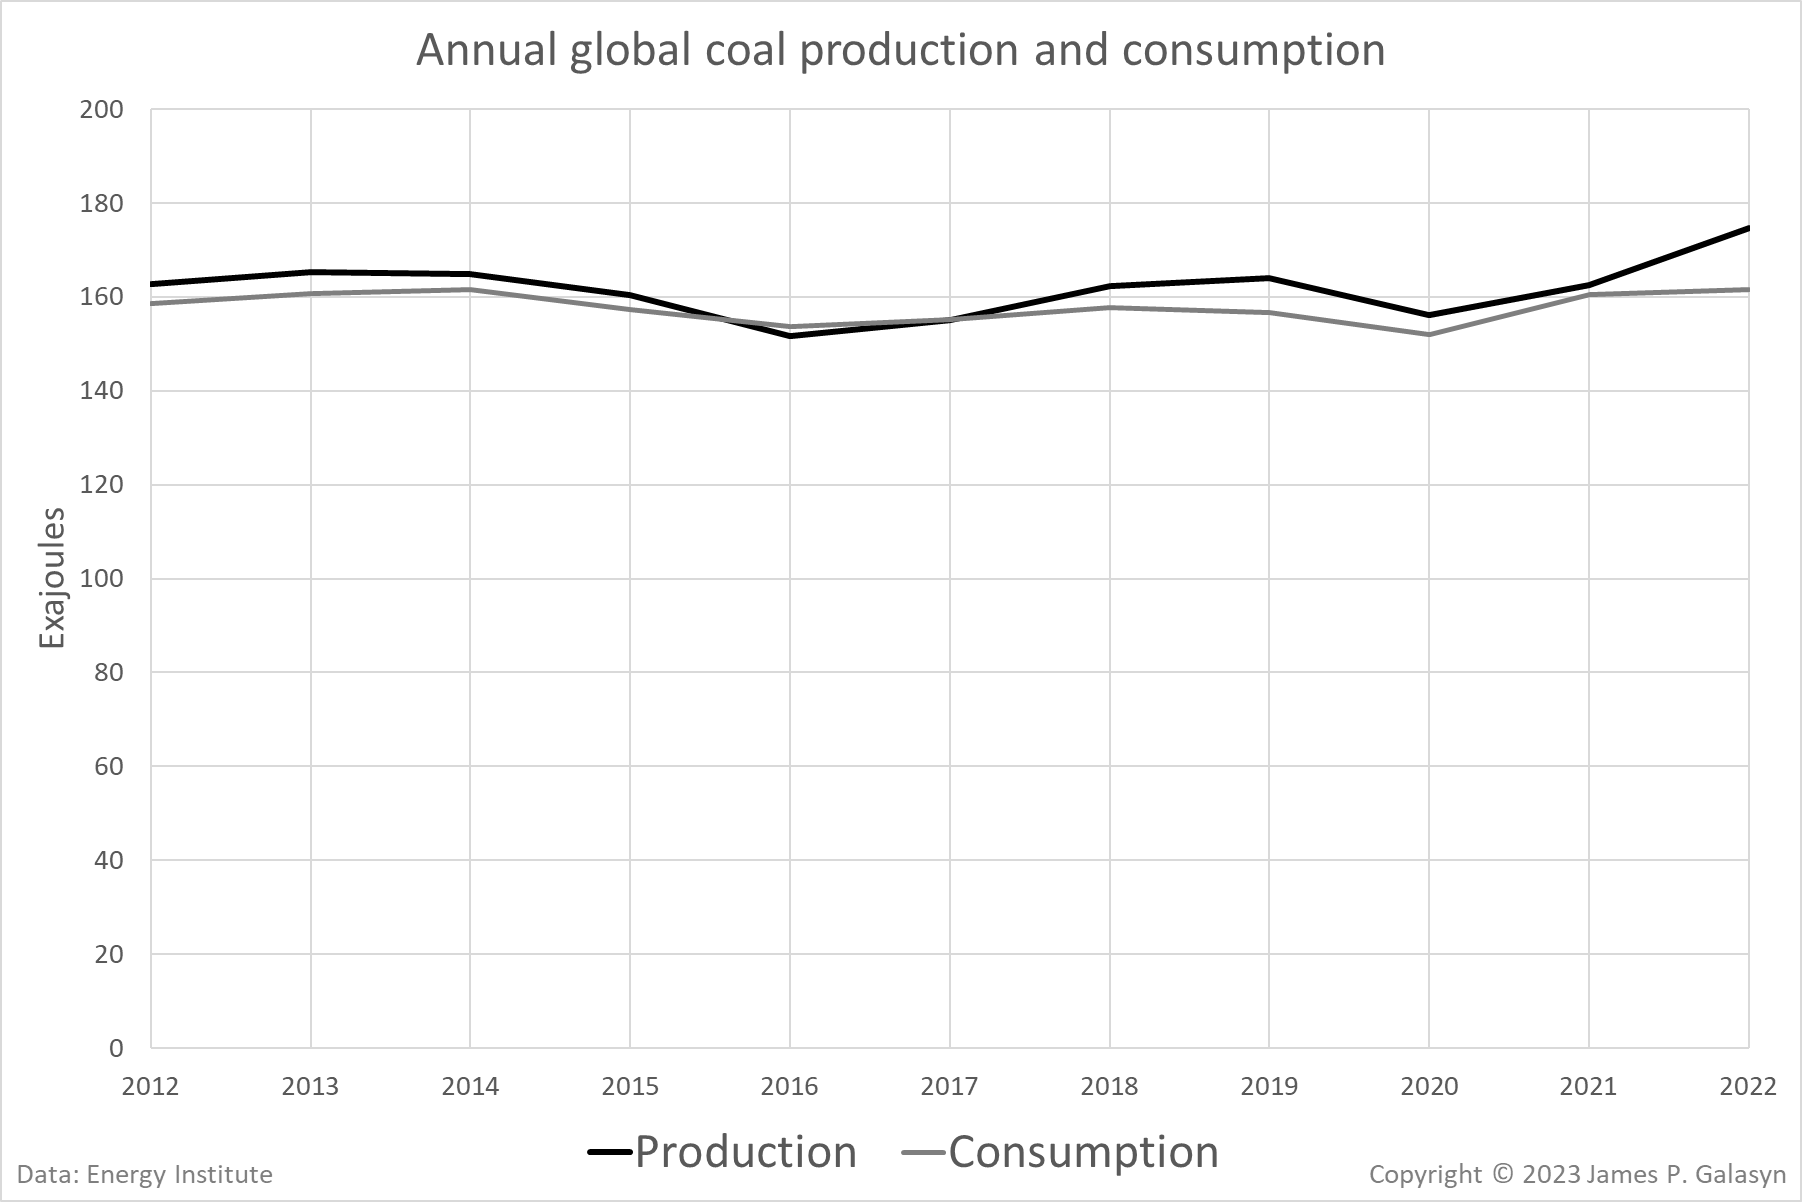
- Coal consumption continued to increase, rising 0.6% on 2021 to 161 EJ; the highest level of coal consumption since 2014.
- The growth in demand was largely driven by China (1%) and India (4%). Their combined growth of 1.7 EJ was sufficient to offset declines in other regions by 0.6 EJ.
- Coal consumption in both North America and Europe declined by 6.8% and 3.1% respectively. In 2022, OECD consumption was around 10% less than its 2019 pre-COVID level and non-OECD coal consumption over 6% higher.
- Global coal production increased by over 7% compared to 2021, reaching a record high of 175 EJ. China, India, and Indonesia accounted for over 95% of the increase in global production.
Renewables, hydro and nuclear
- Renewable power (excluding hydro) rose 14% in 2022 to reach 40.9 EJ. This was slightly below the previous year’s growth rate of 16%.
- Solar and wind capacity continued to grow rapidly in 2022 recording a record increase of 266 GW. Solar accounted for 72% (192 GW) of the capacity additions.
- The largest portion of solar and wind growth was in China accounting for about 37% and 41% of global capacity additions respectively.
- Hydroelectricity generation increased by 1.1% in 2022 whilst output from nuclear fell by 4.4%.
Electricity
- Global electricity generation increased by 2.3% in 2022 which was lower than the previous year’s growth rate of 6.2%.
- Wind and solar reached a record high of 12% share of power generation with solar recording 25% and wind power 13.5% growth in output. The combined generation from wind and solar once again surpassed that of nuclear energy.
- Coal remained the dominant fuel for power generation in 2022, with a stable share around 35.4%, marginally down from 35.8% in 2021.
- Natural gas-fired power generation remained stable in 2022 with a share of around 23%.
- Renewables (excluding hydro) met 84% of net electricity demand growth in 2022.
Key minerals
- Lithium carbonate prices rose 335% to average a record high of $47,000/tonne. Similarly, the price of cobalt increased 24% in 2021 to average $64,000/tonne.
- Lithium and cobalt production rose sharply by 21%.
Energy system struggles in face of geopolitical and environmental crises