NOAA Annual Greenhouse Gas Index reached another record high in 2019 – Total direct radiative forcing has increased 45 percent since 1990
14 May 2020 (NOAA) – […] The NOAA monitoring program provides high-precision measurements of the global abundance and distribution of long-lived greenhouse gases that are used to calculate changes in radiative climate forcing.
Air samples are collected through the NOAA/GML global air sampling network, including a cooperative program for the carbon gases which provides samples from ~80 global background air sites, including measurements at 5 degree latitude intervals from ship routes.
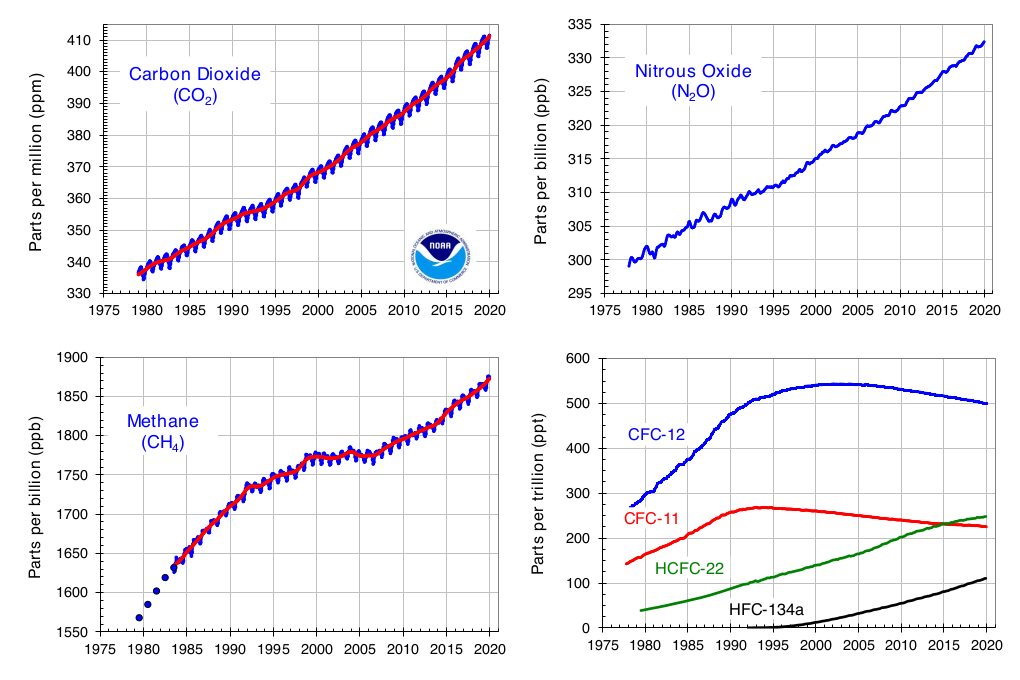
Weekly data are used from a subset of these sites to create a smoothed north-south latitude profile from which a global average is calculated (Figure 2). The atmospheric abundance of CO2 has increased by an average of 1.84 ppm per year over the past 40 years (1979-2019). The CO2 increase is accelerating — while it averaged about 1.6 ppm per year in the 1980s and 1.5 ppm per year in the 1990s, the growth rate increased to 2.4 ppm per year during the last decade (2009-2019). The annual CO2 increase from 1 Jan 2019 to 1 Jan 2020 was 2.64 ± 0.08 ppm (see Trends in Atmospheric Carbon Dioxide), which is slightly higher than the average of the previous decade, and much higher than the two decades before that. […]
2019 Results
The following graph shows radiative forcing for the major gases and a set of 15 minor long-lived halogenated gases (CFC-113, CCl4, CH3CCl3, HCFCs 22, 141b and 142b, HFCs 134a, 152a, 23, 143a, and 125, SF6, and halons 1211, 1301 and 2402). Except for the HFCs and SF6, which do not contain chlorine or bromine, these are also ozone-depleting gases and are regulated by the Montreal Protocol. As expected, CO2 dominates the total forcing with methane and the CFCs becoming relatively smaller contributors to the total forcing over time. The five major greenhouse gases account for about 96% of the direct radiative forcing by long-lived greenhouse gas increases since 1750. The 15 minor halogenated gases contribute The remaining 4%.
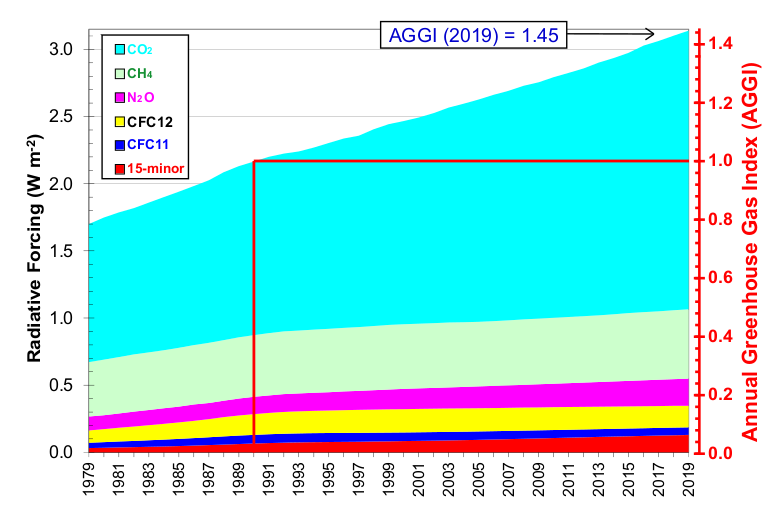
Of the five long-lived greenhouse gases, CO2 and N2O are the only ones that continue to increase at regular rates over decades. Radiative forcing from CH4 increased since 2007 after remaining nearly constant from 1999 to 2006. While the radiative forcing of the long-lived, well-mixed greenhouse gases increased 45% from 1990 to 2019 (by ~0.98 watts m-2), CO2 has accounted for about 80% of this increase (~0.78 watts m-2). Had the ozone-depleting gases not been regulated by the Montreal Protocol and its amendments, it is estimated that climate forcing would have been as much as 0.3 watt m-2 greater in 2010 (Velders, et al., 2007), or more than half of the increase in radiative forcing due to CO2 alone since 1990. The recent Kigali Amendment to the Montreal Protocol controls future production of HFCs, which are substitutes for CFCs and other ozone-depleting gases, to ensure that radiative forcing for these substitute chemicals does not increase substantially in the future. Of the ozone-depleting gases and their substitutes, the largest contributors to direct warming in 2019 were CFC-12, followed by CFC-11, HCFC-22, CFC-113 and HCFC-134a. Although the concentration of HCFC-22 in the remote atmosphere surpassed that of CFC-11 by the end of 2015 (Figure 2), the radiative forcing arising from HCFC-22 is still only 87% of that from CFC-11 because CFC-11 is more efficient at trapping infrared radiation on a per molecule basis.
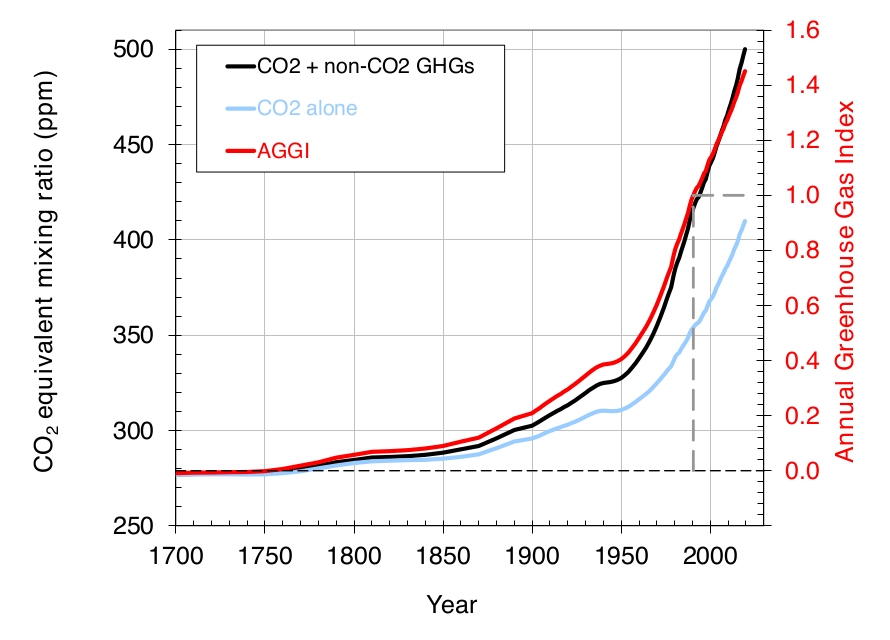
The Annual Greenhouse Gas Index (AGGI) is defined as the ratio of total direct radiative forcing due to long-lived greenhouse gases for any year for which adequate global measurements exist, to that which was present in 1990. 1990 was chosen because it is the baseline year for the Kyoto Protocol (and the publication year of the first IPCC Scientific Assessment of Climate Change). This index, shown with the direct radiative forcing values in Table 2 and on the right-hand axis of Figure 4, is a measure of the interannual changes in conditions that affect carbon dioxide emission and uptake, methane and nitrous oxide sources and sinks, the decline in the atmospheric abundance of ozone-depleting chemicals related to the Montreal Protocol, and the increase in their substitutes (HCFCs and HFCs). Most of this increase is related to CO2. For 2019, the AGGI was 1.45 (representing an increase in total direct radiative forcing of 45% since 1990). The increase in radiative forcing from CO2 alone since 1990 was 60.6% (see Fig. 3). The decline in the CFCs has tempered the increase in net radiative forcing. The AGGI is updated each spring when air samples from all over the globe for the previous year have been obtained and analyzed.
Changes in radiative forcing before 1978 are derived from atmospheric measurements of CO2, started by C.D. Keeling (Keeling, et al., 1958), and from measurements of CO2 and other greenhouse gases in air trapped in snow and ice in Antarctica and Greenland (Etheridge, et al., 1996; Butler, et al., 1999). These results define atmospheric composition changes going back to 1750 and radiative forcing changes since preindustrial times (Figure 4). This longer-term view shows how increases in greenhouse gas concentrations over the past ~70 years (since 1950) have accounted for three-fourths (72%) of the total increase in the AGGI over the past 260 years. [more]