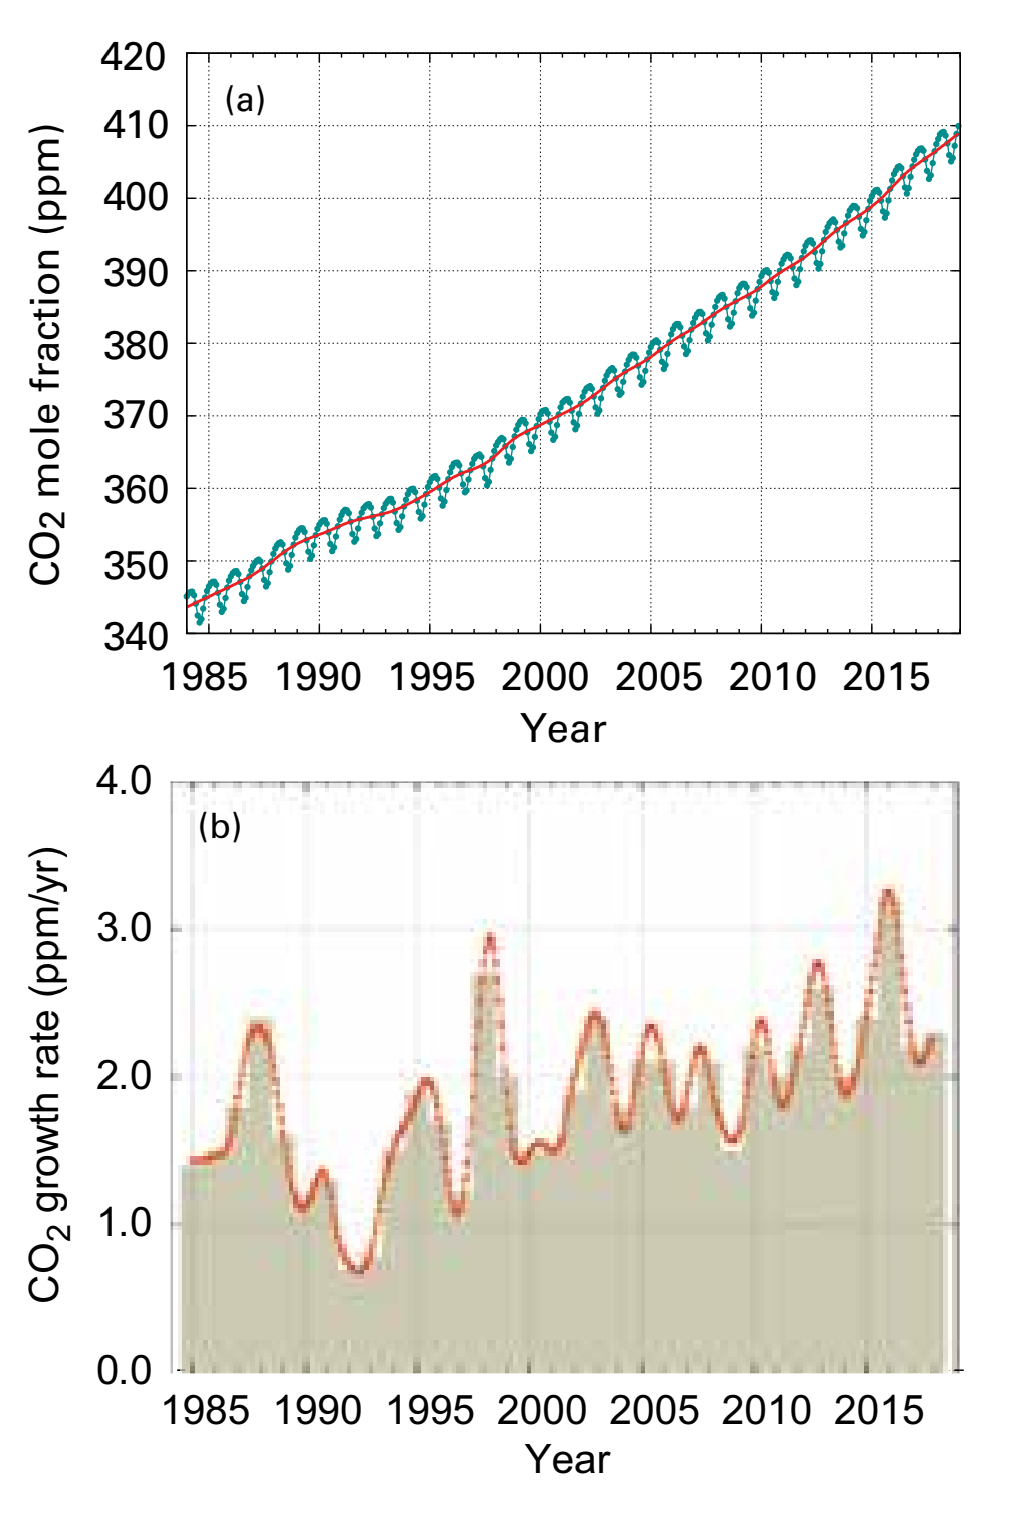
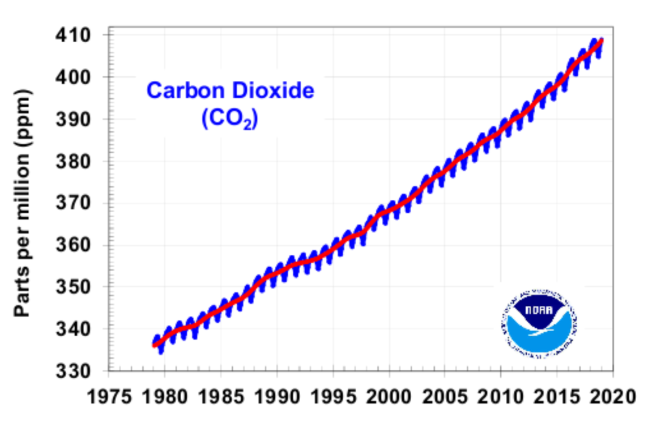
GENEVA, 25 November 2019 (WMO) – Levels of heat-trapping greenhouse gases in the atmosphere have reached another new record high, according to the World Meteorological Organization. This continuing long-term trend means that future generations will be confronted with increasingly severe impacts of climate change, including rising temperatures, more extreme weather, water stress, sea level rise […]

By Hannah Pitt, Kate Larsen, Hannah Kolus, Shashank Mohan, John Larsen, Whitney Herndon, and Trevor Houser 8 July 2019 (Rhodium Group) – For the past five years, Rhodium has provided an independent annual assessment of US greenhouse gas (GHG) emissions and progress towards achieving the country’s climate goals. Given the current state and federal policy […]
30 May 2019 (Desdemona Despair) – Last week, the NOAA Earth System Research Laboratory posted its annual update to the NOAA Annual Greenhouse Gas Index (AGGI), which measures the climate-warming influence of long-lived trace gases, including carbon dioxide and methane. To nobody’s surprise, the AGGI continued its inexorable rise in 2018 because, for another year, […]