Graph of the Day: NOAA Annual Greenhouse Gas Index, 1700-2018
30 May 2019 (Desdemona Despair) – Last week, the NOAA Earth System Research Laboratory posted its annual update to the NOAA Annual Greenhouse Gas Index (AGGI), which measures the climate-warming influence of long-lived trace gases, including carbon dioxide and methane.
To nobody’s surprise, the AGGI continued its inexorable rise in 2018 because, for another year, humans did essentially nothing to curtail fossil carbon emissions.
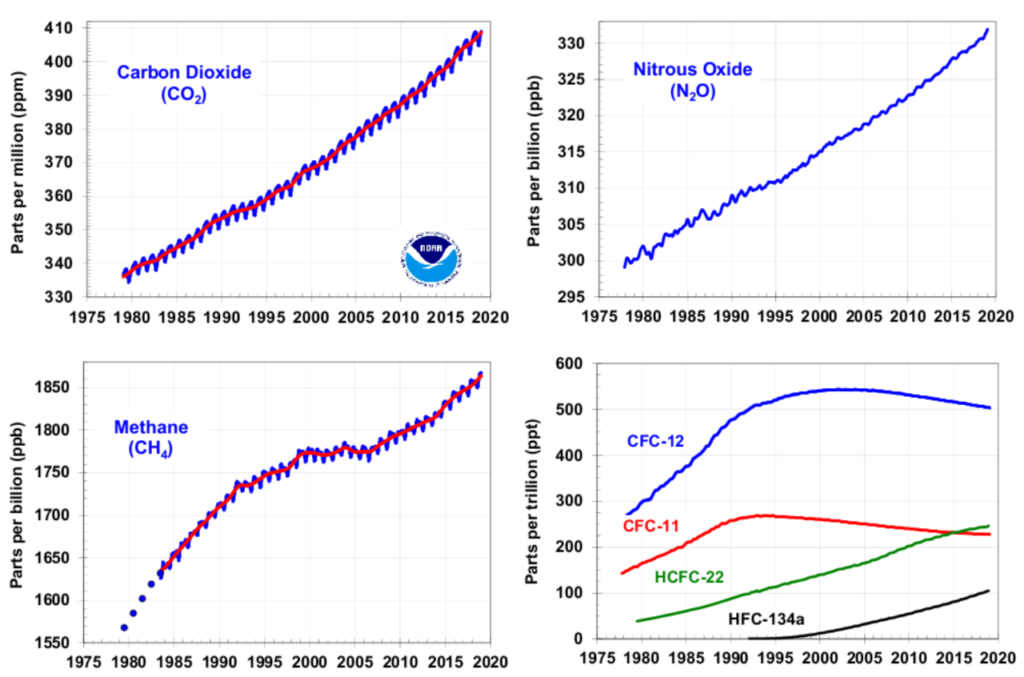
The major contributors to global warming, carbon dioxide, methane, and nitrous oxide, all continued their upward trends, without the slightest hint of a slowdown.
We may be thankful that some of halogenated gases (CFC-11 and CFC-12) are declining slowly, but others are increasing more rapidly. In any case, the 15 minor halogenated gases contribute only 4 percent of the total direct radiative forcing by long-lived greenhouse gases.
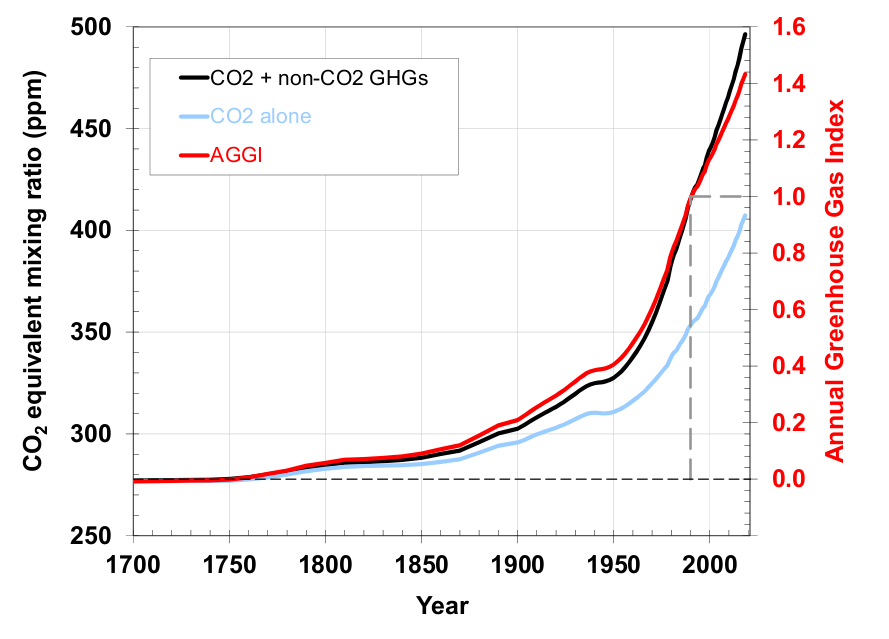
The NOAA Annual Greenhouse Gas Index (AGGI)
Rising emissions drive greenhouse gas index increase
21 May 2019 (NOAA) – Record levels of greenhouse gas pollution continued to increase humanity’s impact on the atmosphere’s heat-trapping capacity during 2018, according to a yearly analysis released by NOAA scientists today.
NOAA’s Annual Greenhouse Gas Index tracks the relative climate-forcing influence exerted by carbon dioxide, methane and other greenhouse gases since the start of the industrial revolution. This year it rose to a value of 1.43, meaning that the increase in the atmosphere’s heat-trapping capacity attributable to human activity has risen 43 percent since 1990.
The index, known as the AGGI, is based on hundreds of air samples collected from sites around the world each year from NOAA’s Global Greenhouse Gas Reference Network, and carefully analyzed at NOAA’s Earth System Research Laboratory in Boulder, Colorado.
“Greenhouse gas pollution traps heat in the atmosphere, which has consequences,” said James Butler, director of NOAA’s Global Monitoring Division. “There’s no getting around it — burning fossil fuels is changing the course of our planet’s future. How society deals with that will be a major challenge in coming decades.”
The 2018 report was released on the first day of the 47th Global Monitoring Annual Conference in Boulder.
The AGGI – one number to track our cumulative impact on climate
NOAA scientists released the first AGGI in 2006 as a way to help policymakers, educators, and the public understand the cumulative impact of greenhouse gases on climate over time. The AGGI is updated each spring when air samples from the previous year have been obtained and analyzed. An AGGI value of 1.0 was assigned to the warming influence being supplied by these gases in 1990 – the baseline year of the Kyoto Protocol, an international treaty for the reduction in greenhouse gas pollution.
Five greenhouse gases account for about 96 percent of the increased climate-warming influence since 1750, the onset of the industrial revolution. They are carbon dioxide, methane, nitrous oxide, and two chlorofluorocarbons that are strictly controlled by the Montreal Protocol because they damage Earth’s protective ozone layer. The AGGI also tracks 15 secondary greenhouse gases responsible for the remaining 4 percent.
By far the most important anthropogenic greenhouse gas is carbon dioxide, or CO2, which is responsible for 81 percent of the increased warming influence on the atmosphere tracked by the AGGI. A preliminary estimate from the Global Carbon Project is that 37 billion tons of CO2 were emitted in 2018. That would be the highest level of CO2 emissions on record.
NOAA measurements show the rate of increase of atmospheric CO2 is accelerating. While it averaged about 1.6 ppm per year in the 1980s and 1.5 ppm per year in the 1990s, the mean growth rate increased to 2.3 ppm per year on average from 2009-2018. In 2018, carbon dioxide increased by 2.5 parts per million.
The rate of methane increase has also accelerated over the past five years, jumping 50 percent since 2007-2013. Methane is 28 times more potent than carbon dioxide in trapping heat in the atmosphere over 100 years and exerts the second largest influence on global warming behind carbon dioxide.
Not surprisingly, the AGGI shows how humans’ cumulative impact on climate is also accelerating. Increases in greenhouse gas concentrations since 1950 are responsible for 75 percent of humanity’s impact on the climate over the past 260 years.
Contact
- Theo Stein, NOAA Communications, (303) 497-6288, theo.stein@noaa.gov.
Hubbout this:
https://youtu.be/UatUDnFmNTY
Hi Robin, that’s gorgeous, thank you for sending!