Another record high for NOAA Annual Greenhouse Gas Index in 2020 – CO2 increase continues accelerating – No slowdown from Covid pandemic seen
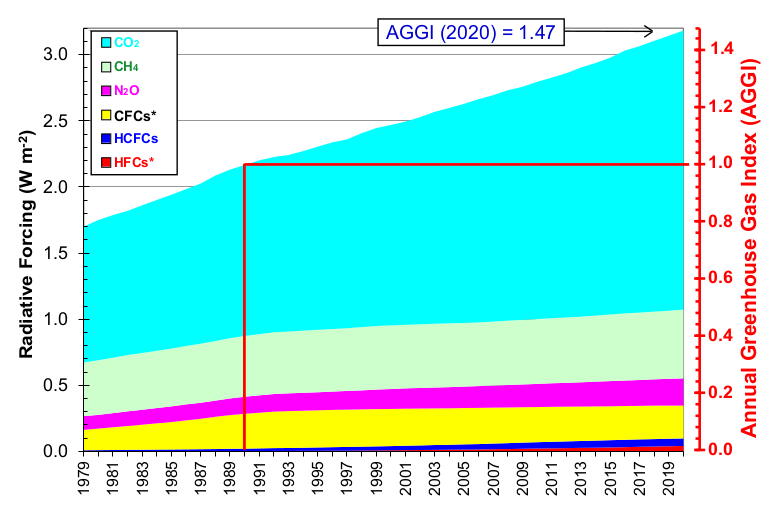
![Annual Greenhouse Gas Index (AGGI), 1750-2020. For 2020, the AGGI was a record high 1.47, representing an increase in total direct radiative forcing of 47 percent since 1990. This increase in CO2 is accelerating — while it averaged about 1.6 ppm per year in the 1980s and 1.5 ppm per year in the 1990s, the growth rate increased to 2.4 ppm per year during the last decade (2009-2020). Pre-1978 changes in the CO2-equivalent abundance and AGGI based on the ongoing measurements of all greenhouse gases reported here, measurements of CO2 going back to the 1950s from C.D. Keeling [Keeling et al., 1958], and atmospheric changes derived from air trapped in ice and snow above glaciers [Machida et al., 1995, Battle et al., 1996, Etheridge, et al., 1996; Butler, et al., 1999]. Equivalent CO2 atmospheric amounts (in ppm) are derived with the relationship between CO2 concentrations and radiative forcing from all long-lived greenhouse gases. Graphic: Butler and Montzka, 2021 / NOAA](https://desdemonadespair.net/wp-content/uploads/2021/05/AGGI-1750-2020-Butler-and-Montzka-2021-NOAA.png)
26 May 2021 (NOAA) – […] The atmospheric abundance of CO2 has increased by an average of 1.85 ppm per year over the past 41 years (1979-2020). This increase in CO2 is accelerating — while it averaged about 1.6 ppm per year in the 1980s and 1.5 ppm per year in the 1990s, the growth rate increased to 2.4 ppm per year during the last decade (2009-2020). The annual CO2 increase from 1 Jan 2020 to 1 Jan 2021 was 2.50 ± 0.08 ppm (see https://gml.noaa.gov/ccgg/trends/global.html), which is slightly higher than the average for the previous decade, and much higher than the two decades before that.
The growth rate of methane declined from 1983 until 1999, consistent with its concentration approaching steady-state. Superimposed on this decline is significant interannual variability in growth rates [Dlugokencky et al., 1998, 2003]. From 1999 to 2006, the atmospheric CH4 burden was nearly constant, but, since 2007, CH4 has been increasing again. Causes for the increase are not fully understood, but warm temperatures in the Arctic in 2007 and increased precipitation in the tropics during 2007 and 2008 [Dlugokencky et al., 2009] contributed in the early years. Isotopic measurements argue for continued increasing microbial emissions after 2008 (e.g., likely from wetlands or agriculture) [Schaefer et al., 2016; Nisbet et al., 2019]. Since 2015, the global annual increase in methane has become even larger, averaging 9.7 ± 3.3 ppb yr-1 through 2020 compared to an average annual increase of 6.4 ± 2.9 ppb yr-1 between 2008 and 2014 (https://gml.noaa.gov/ccgg/trends_ch4/). The annual methane increase in 2020 was 15.85 ± 0.47 ppb, which is the largest annual increase recorded since 1983 when NOAA’s ongoing measurements began.
The atmospheric burden of nitrous oxide continues to grow over time. Furthermore, the annual increase in nitrous oxide’s atmospheric burden, averaging 1.0 ppb yr-1 over the past decade, is also increasing. The annual increase in 2020 was the largest recorded since measurements began. Radiative forcing from the sum of observed CFC changes ceased increasing in about 2000 and has continued to decline ever since [Montzka et al., 2021]. This continued decline is a response to global controls placed on CFC production and trade by the adjusted and amended Montreal Protocol on Substances that Deplete the Ozone Layer. […]
2020 Results
Figure 3 shows radiative forcing for CO2, CH4, N2O and groupings of gases that capture changes predominantly in the CFCs, HCFCs, and the HFCs through 2020. As expected, CO2 is by far the largest contributor to total forcing from these gases, while methane and the CFCs are becoming relatively smaller contributors to total forcing over time.
The atmospheric abundance and radiative forcing of the three main long-lived greenhouse gases continue to increase in the atmosphere. While the combined radiative forcing of these and all the other long-lived, well-mixed greenhouse gases included in the AGGI rose 47% from 1990 to 2020 (by ~1.02 watts m-2), CO2 has accounted for about 80% of this increase (~0.82 watts m-2), which makes it by far the biggest contributor to increases in climate forcing since 1990. Had ozone-depleting gases not been regulated by the Montreal Protocol and its amendments, it is estimated that climate forcing would have been as much as 0.3 watt m-2 greater in 2010 [Velders et al., 2007], or more than half of the increase in radiative forcing due to CO2 alone since 1990.
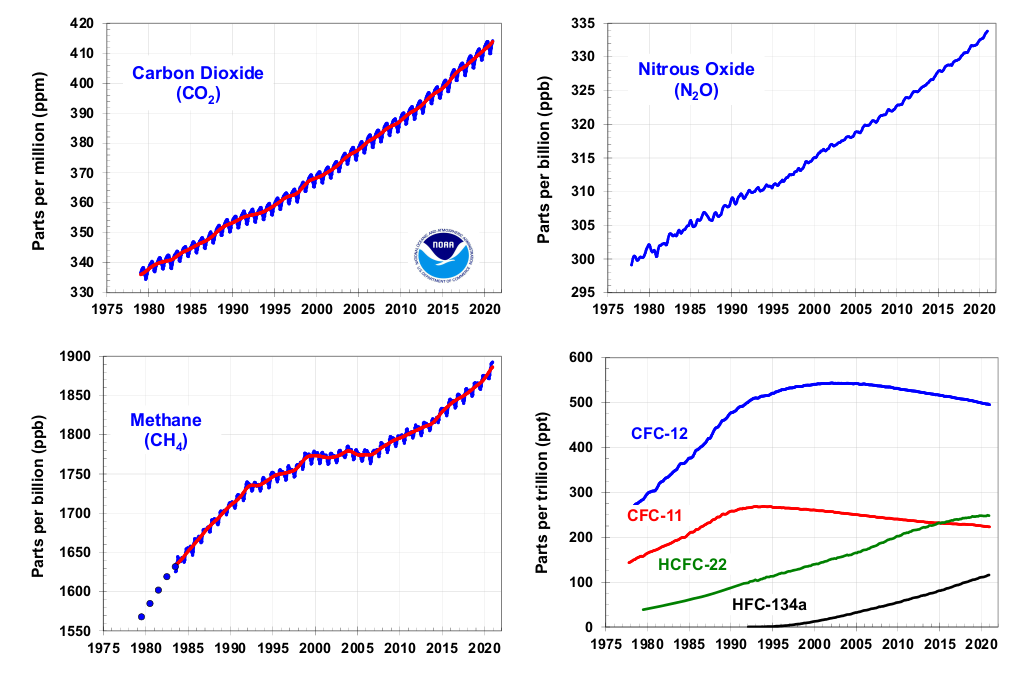
Had ozone-depleting gases not been regulated by the Montreal Protocol and its amendments, it is estimated that climate forcing would have been as much as 0.3 watt m-2 greater in 2010 [Velders et al., 2007], or more than half of the increase in radiative forcing due to CO2 alone since 1990 . While direct radiative forcing from CFCs and related gases (CFC* in Figure 3) has declined in recent years, the current warming influence from this group of chemicals is still larger than that from HCFCs and HFCs. Of the ozone-depleting gases and their substitutes, the largest contributors to direct warming in 2020 were CFC-12, followed by CFC-11, HCFC-22, CFC-113 and HCFC-134a. While the radiative forcing from HFCs has been small relative to other greenhouse gases, the potential for large future increases led to the adoption of controls on HFC production in the Kigali amendment to the Montreal Protocol. The concentration of HCFC-22 in the remote atmosphere surpassed that of CFC-11 by the end of 2015 (Figure 2), but the radiative forcing arising from HCFC-22 is still only 88% of that from CFC-11 because CFC-11 is more efficient at trapping infrared radiation on a per molecule basis.
The Annual Greenhouse Gas Index (AGGI) is calculated as the ratio of total direct radiative forcing due to these gases in a given year to its total in 1990. 1990 was chosen because it is the baseline year for the Kyoto Protocol and the publication year of the first IPCC Scientific Assessment of Climate Change. Most of this increase is related to CO2. For 2020, the AGGI was 1.47 (representing an increase in total direct radiative forcing of 47% since 1990). [more]