China’s greenhouse gas emissions exceeded the developed world for the first time in 2019
By Kate Larsen, Hannah Pitt, Mikhail Grant, and Trevor Houser
6 May 2021
(Rhodium Group) – Each year Rhodium Group provides the most up-to-date global and country-level greenhouse gas (GHG) emissions estimates through the ClimateDeck (a partnership with Breakthrough Energy). In addition to our preliminary US and China GHG estimates for 2020, Rhodium provides annual estimates of economy-wide emissions—including all six Kyoto gases—for over 190 countries from 1990-2019. Using our newly updated global emissions data through 2019, we estimate that in 2019, for the first time since national greenhouse gas emissions have been measured, China’s annual emissions exceeded those of all developed countries combined. China’s emissions were less than a quarter of developed country emissions in 1990, but over the past three decades have more than tripled, reaching over 14 gigatons of CO2-equivalent in 2019.
Global greenhouse gas emissions estimates for 2019
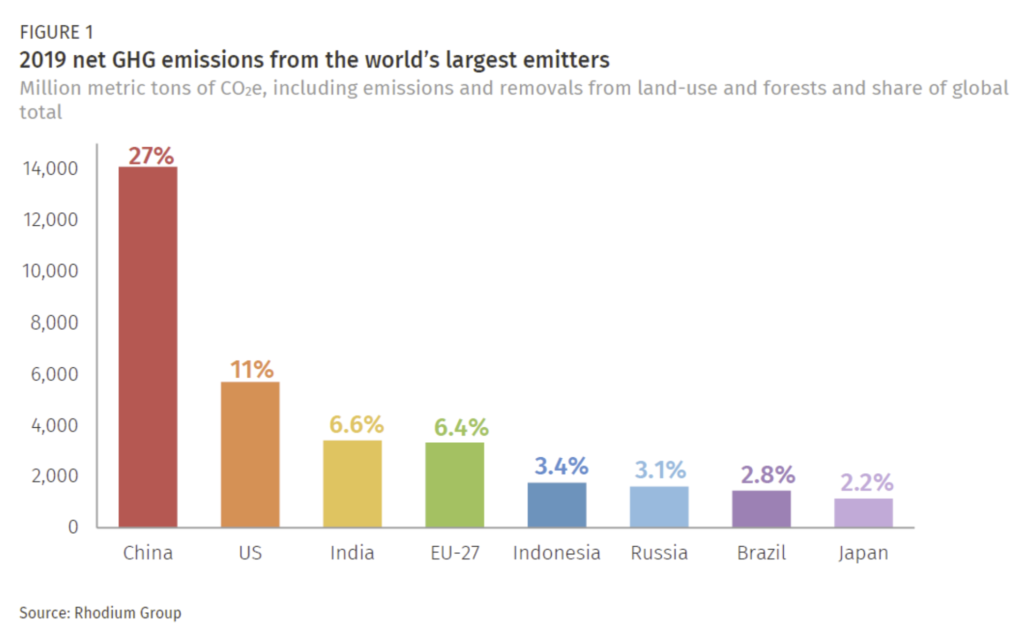
Based on our newly updated preliminary estimates for 2019, global emissions—including emissions of all six Kyoto gases, inclusive of land-use and forests and international bunkers—reached 52 gigatons of CO2-equivalent in 2019, a 11.4% increase over the past decade. China alone contributed over 27% of total global emissions, far exceeding the US—the second-highest emitter—which contributed 11% of the global total (Figure 1). For the first time, India edged out the EU-27 for third place, coming in at 6.6% of global emissions.
China’s emissions exceeded emissions from developed countries
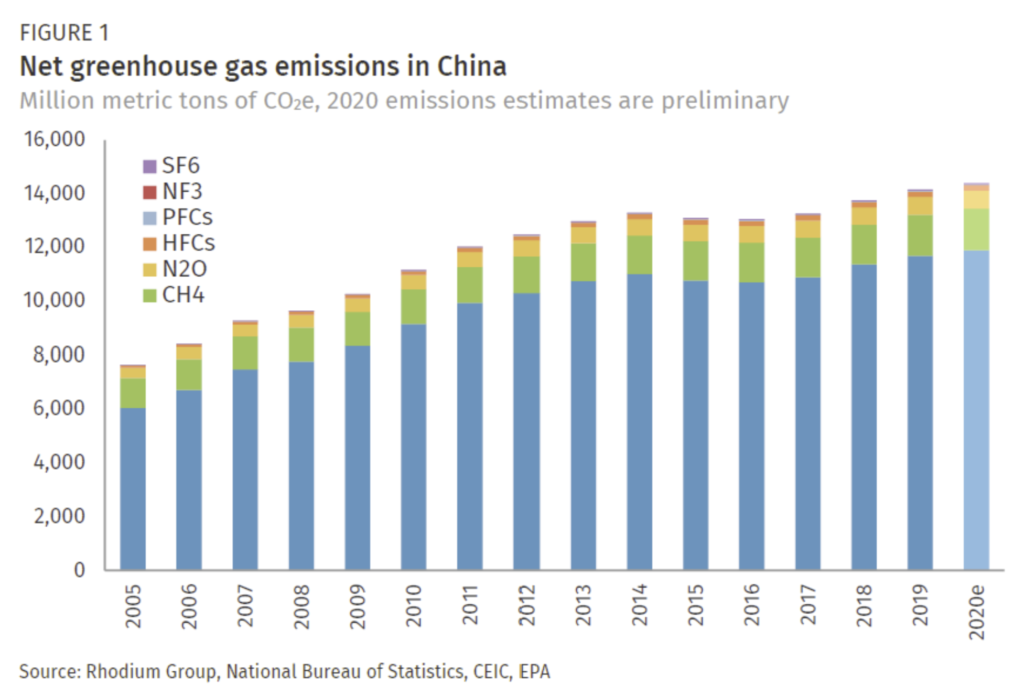
In 2019, China’s GHG emissions passed the 14 gigaton threshold for the first time, reaching 14,093 million metric tons of CO2 equivalent (MMt CO2e) (Figure 2). This represents a more than tripling of 1990 levels, and a 25% increase over the past decade. As a result, China’s share of the 2019 global emissions total of 52 gigatons rose to 27%.[1]
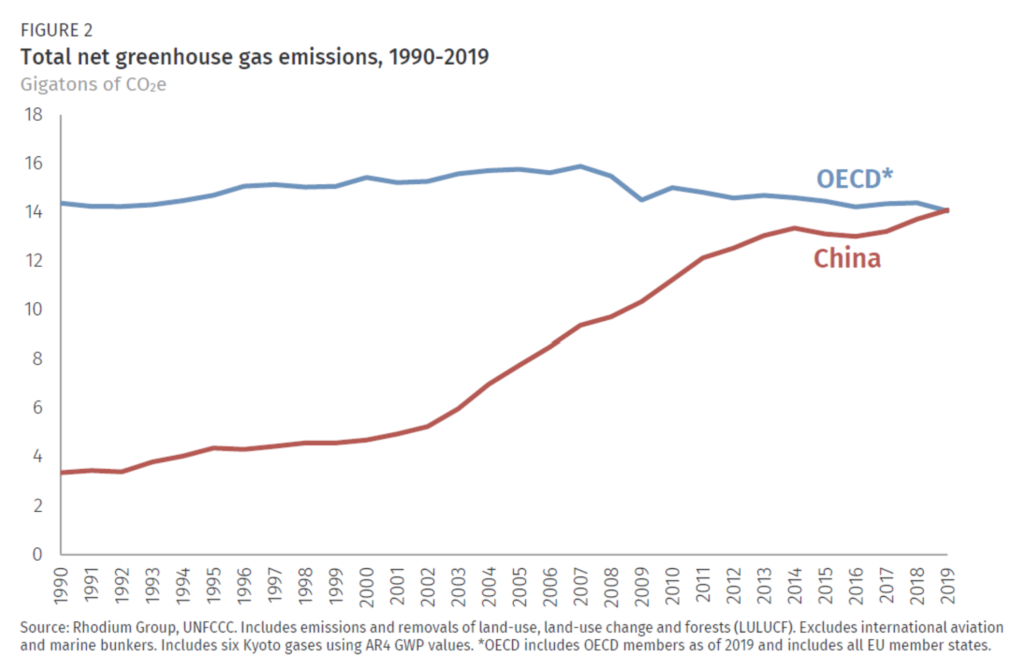
In 2019, China’s emissions not only eclipsed that of the US—the world’s second-largest emitter at 11% of the global total—but also, for the first time, surpassed the emissions of all developed countries combined (Figure 2). When added together, GHG emissions from all members of the Organization for Economic Cooperation and Development (OECD), as well as all 27 EU member states, reached 14,057 MMt CO2e in 2019, about 36 MMt CO2e short of China’s total.[2]
But China is a large country, home to over 1.4 billion people. To date, China’s size has meant that its per capita emissions have remained considerably lower than those in the developed world. In 2019, China’s per capita emissions reached 10.1 tons, nearly tripling over the past two decades. This comes in just below average levels across the OECD bloc (10.5 tons/capita) in 2019, but still significantly lower than the US, which has the highest per capita emissions in the world at 17.6 tons/capita. While final global data for 2020 is not yet available, we expect China’s per capita emissions exceeded the OECD average in 2020, as China’s net GHG emissions grew around 1.7% while emissions from almost all other nations declined sharply in the wake of the COVID-19 pandemic.
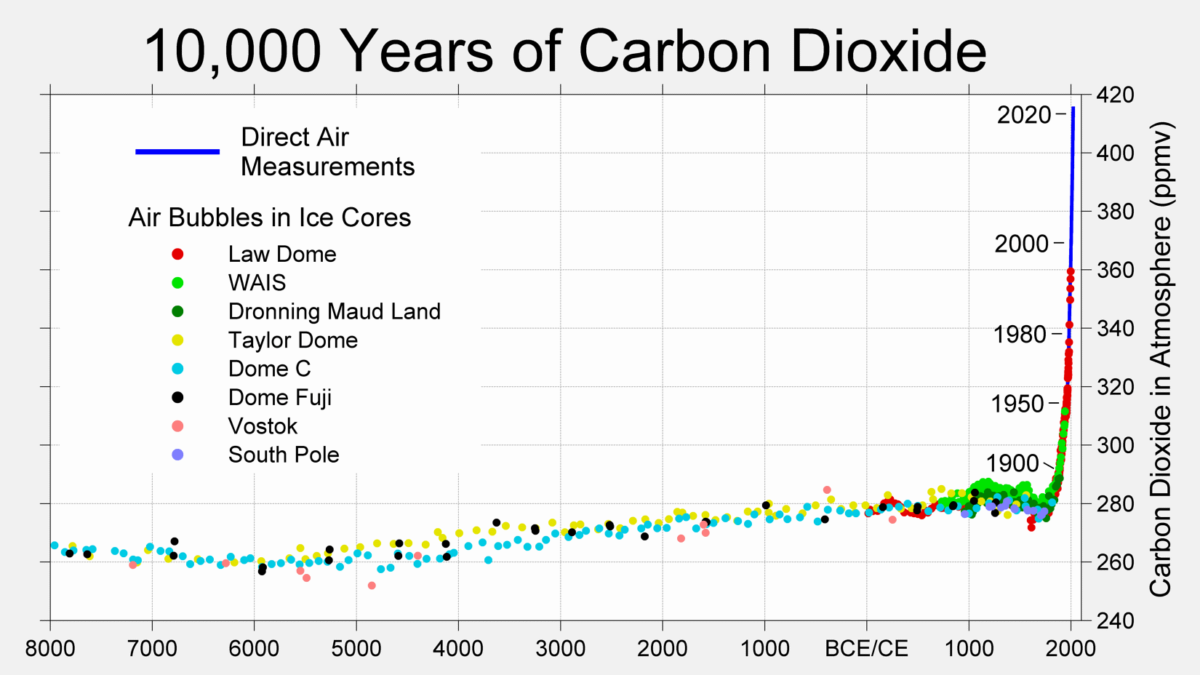
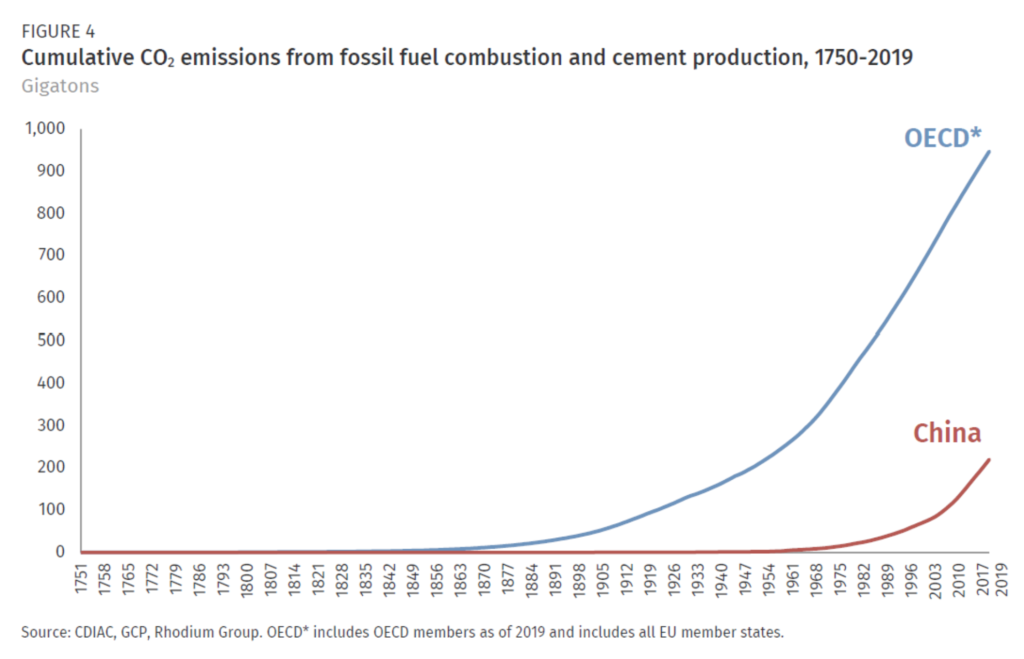
While China exceeded all developed countries combined in terms of annual emissions and came very close to matching per capita emissions in 2019, China’s history as a major emitter is relatively short compared to developed countries, many of which had more than a century head start. A large share of the CO2 emitted into the atmosphere each year hangs around for hundreds of years. As a result, current global warming is the result of emissions from both the recent and more distant past. Since 1750, members of the OECD bloc have emitted four times more CO2 on a cumulative basis than China (Figure 4). This overstates the relative role of OECD emissions in the more than 1 degree Celsius increase in global temperatures that has occurred since before the industrial revolution because a large share of annual CO2 emissions is absorbed in the earth’s carbon cycle in the decades after release. But China still has a way to go before surpassing the OECD on a cumulative contribution basis.
[1] Rhodium quantifies emissions on a “territorial” basis, consistent with UNFCCC reporting guidelines. A “consumption” based accounting of China’s emissions, which adds emissions associated with imported goods and removes those associated with exported goods, would put China’s 2019 GHG emissions at roughly 13 gigatons (or 25% of the global total).
[2] We use membership in the EU or OECD in 2019 to describe “developed” countries for this analysis, which includes all 27 current EU member states, Australia, Canada, Chile, Iceland, Israel, Japan, Korea, Mexico, New Zealand, Norway, Switzerland, Turkey, the US, and the UK. [more]
China’s Greenhouse Gas Emissions Exceeded the Developed World for the First Time in 2019