Air pollution from oil and gas production sites visible from space – U.S. and European satellites help scientists measure nitrogen dioxide from drilling, production, and flaring
15 January 2020 (CIRES) – Oil and gas production has doubled in some parts of the United States in the last two years, and scientists can use satellites to see impacts of that trend: a significant increase in the release of the lung-irritating air pollutant nitrogen dioxide, for example, and a more-than-doubling of the amount of gas flared into the atmosphere.
“We see the industry’s growing impact from space,” said CIRES scientist Barbara Dix, lead author of the new assessment published in the AGU journal Geophysical Research Letters. “We really are at the point where we can use satellite data to give feedback to companies and regulators, and see if they are successful in regulating emissions.”
Dix and a team of US and Dutch researchers set out to see if a suite of satellite-based instruments could help scientists understand more about nitrogen oxides pollution (including nitrogen dioxide) coming from engines in U.S. oil and gas fields. Combustion engines produce nitrogen oxides, which is a respiratory irritant and can lead to the formation of other types of harmful air pollutants, such as ground-level ozone.
On oil and gas drilling and production sites, there may be several small and large combustion engines, drilling, compressing gas, separating liquids and gases, and moving gas and oil through pipes and storage containers, said co-author Joost de Gouw, a CIRES Fellow and chemistry professor at CU Boulder. The emissions of those engines are not controlled. “Cars have catalytic converters, big industrial stacks may have emissions reduction equipment …” de Gouw said. “Not so with these engines.”
Conventional “inventories” meant to account for nitrogen oxides pollution from oil and gas sites are often very uncertain, underestimating or overestimating the pollutants, de Gouw said. And there are few sustained measurements of nitrogen oxides in many of the rural areas where oil and gas development often takes place, Dix said.
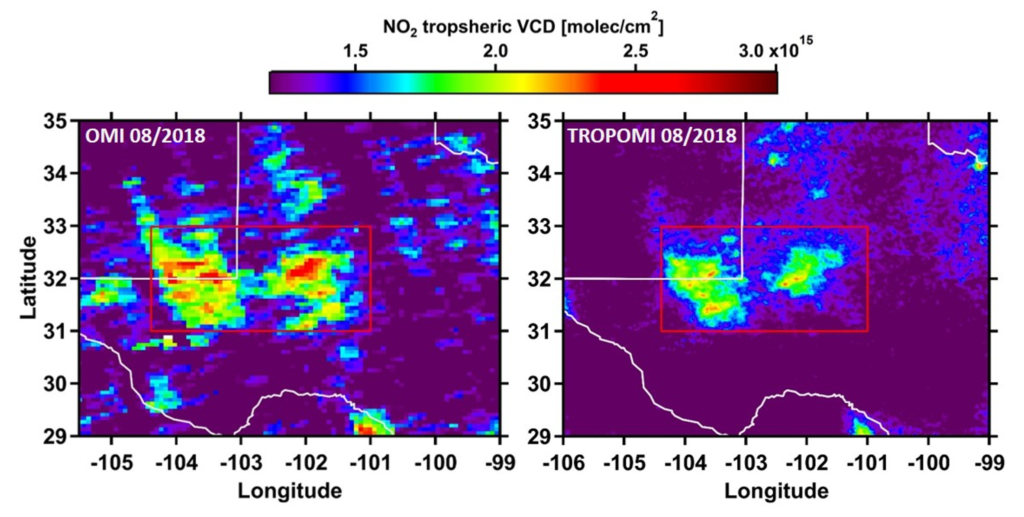
So she, de Gouw and their colleagues turned to nitrogen dioxide data from the Ozone Monitoring Instrument (OMI) on board a NASA satellite and the Tropospheric Monitoring Instrument (TropOMI) on a European Space Agency satellite. They also looked at gas flaring data from an instrument on the NOAA/NASA Suomi satellite system.
Between 2007 and 2019, across much of the United States, nitrogen dioxide pollution levels dropped because of cleaner cars and power plants, the team found, confirming findings reported previously. The clean air trend in satellite data was most obvious in urban areas of California, Washington and Oregon and in the eastern half of the continental United States. “We’ve cleaned up our act a lot,” Dix said.
However, several areas stuck out with increased emissions of nitrogen dioxide: The Permian, Bakken and Eagle Ford oil and gas basins, in Texas and New Mexico, North Dakota, and Texas, respectively.
In those areas, the scientists used a type of time-series analysis to figure out where the pollutant was coming from: Drilling of new wells vs. longer-term production. They could do this kind of analysis because drilling activity swings up and down quickly in response to market forces while production changes far more slowly (once a well is drilled, it may produce oil and natural gas for years or even decades).
Before a downturn in drilling in 2015, drilling generated about 80 percent of nitrogen dioxide from oil and gas sites, the team reported. After 2015, drilling and production produced roughly equal amounts of the pollutant. Flaring is estimated to contribute up to 10 percent in both time frames.
The researchers also developed a new oil and gas emissions inventory, using data on fuel use by the industry, the location of drilling rigs, and well-level production data. The inventory confirmed the satellite trends, said co-author Brian McDonald, a CIRES scientist working in NOAA’s Chemical Sciences Division, “It is a promising development that what we observe from space can be explained by expected trends in emissions from the oil and gas industry.”
“Scientifically, this is especially important: we can do source attribution by satellite,” de Gouw said. “We need to know the important sources to address these emissions in the most cost-efficient manner.”
Air Pollution from Oil and Gas Production Sites Visible from Space
Nitrogen Oxide Emissions from U.S. Oil and Gas Production: Recent Trends and Source Attribution
ABSTRACT: U.S. oil and natural gas production volumes have grown by up to 100% in key production areas between January 2017 and August 2019. Here we show that recent trends are visible from space and can be attributed to drilling, production, and gas flaring activities. By using oil and gas activity data as predictors in a multivariate regression to satellite measurements of tropospheric NO2 columns, observed changes in NO2 over time could be attributed to NOx emissions associated with drilling, production and gas flaring for three select regions: the Permian, Bakken, and Eagle Ford basins. We find that drilling had been the dominant NOx source contributing around 80% before the downturn in drilling activity in 2015. Thereafter, NOx contributions from drilling activities and combined production and flaring activities are similar. Comparison of our top‐down source attribution with a bottom‐up fuel‐based oil and gas NOx emission inventory shows agreement within error margins.
SIGNIFICANCE: U.S. oil and natural gas production volumes have grown by up to 100% in key production areas between January 2017 and August 2019. Here we show that recent trends are visible from space as increases in NO2, an air pollutant that is released from combustion engines associated with the oil and gas industry. For three select regions, the Permian (TX and NM), Bakken (ND), and Eagle Ford (TX) basins, we report that the trend in NO2 columns over time can be explained by a combination of drilling activity, production numbers, and flared gas volume, which allows us to quantify the contributions from these sources to the total NOx (= NO + NO2) emissions from these areas. We find that drilling had been the dominant NOx source contributing around 80% before the downturn in drilling activity in 2015. But now, NOx contributions from drilling activities and combined production and flaring activities are similar. Both Permian and Bakken oil and gas production volumes are at an all‐time high and if current growth rates continue in the Eagle Ford basin, maximum production volumes will be exceeded in about 1 year.
Nitrogen Oxide Emissions from U.S. Oil and Gas Production: Recent Trends and Source Attribution