Graph of the Day: Life expectancy by U.S. congressional district, 2010–2015
25 March 2022 (Harvard T.H. Chan School of Public Health) – Researchers at the Harvard Geographic Insights Lab have launched the first-ever dashboard that tracks life expectancy on the U.S. congressional district level.
The dashboard was released in conjunction with a 12 March 2022 paper in the journal Social Science & Medicine. Harvard T.H. Chan School of Public Health co-authors of the paper included Aya Takai, an MPH student, and S.V. Subramanian, professor of population health and geography.
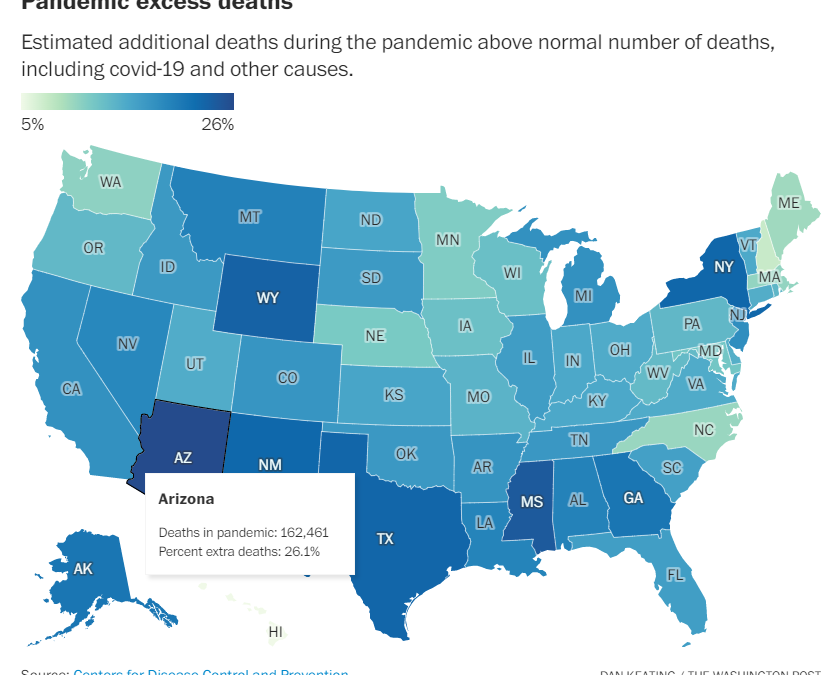
Life expectancy disparities have persisted in the U.S., and the pandemic worsened the situation. Over the past two years, life expectancy at birth declined 1.5 years, and disparities between non-Hispanic white and non-Hispanic Black populations increased for the first time in three decades, according to data from the U.S. Centers for Disease Control and Prevention.
Data on health disparities at the congressional district level have been meager, the researchers noted, suggesting the need for more robust data to help inform policy.
“As our nation transitions towards recovering from the COVID-19 pandemic and reducing health disparities, it is imperative for politically relevant public health data to be available in a clear and direct manner,” said Subramanian, who is also principal investigator of the Geographic Insights Lab. “We hope that this initiative, which focuses on congressional districts and health inequities among them, will deliver exactly that.”
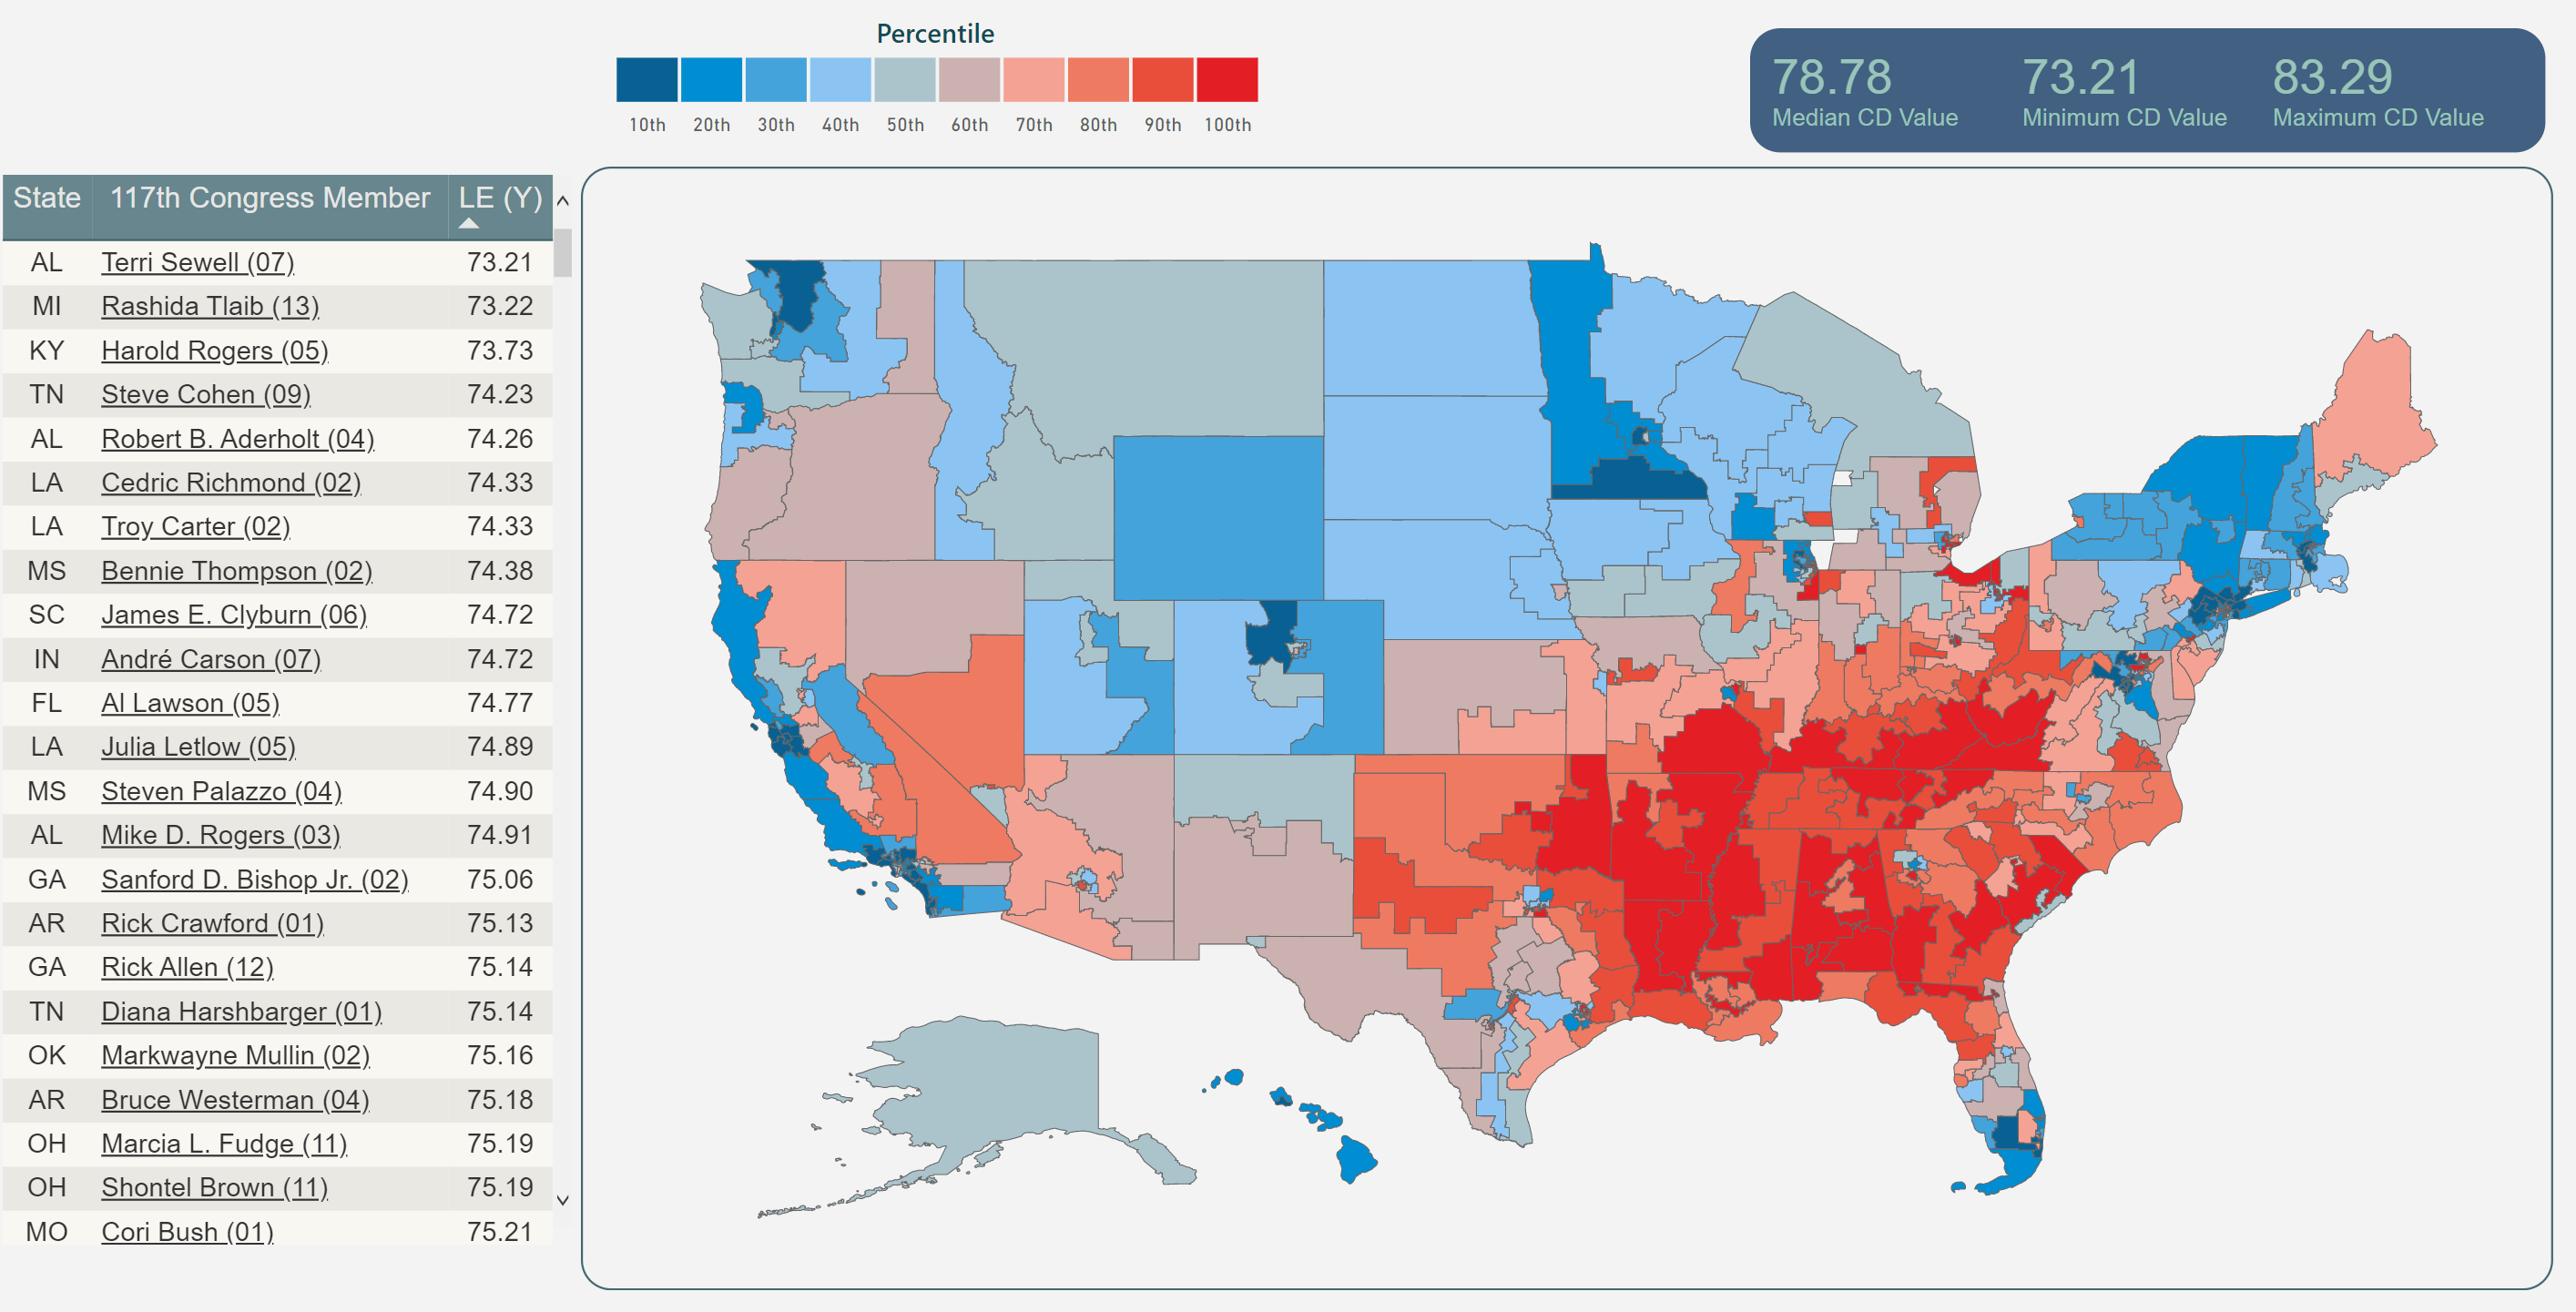
View the dashboard: Life expectancies across congressional districts in the United States
New dashboard shows life expectancy by U.S. congressional district
Life expectancies across congressional districts in the United States
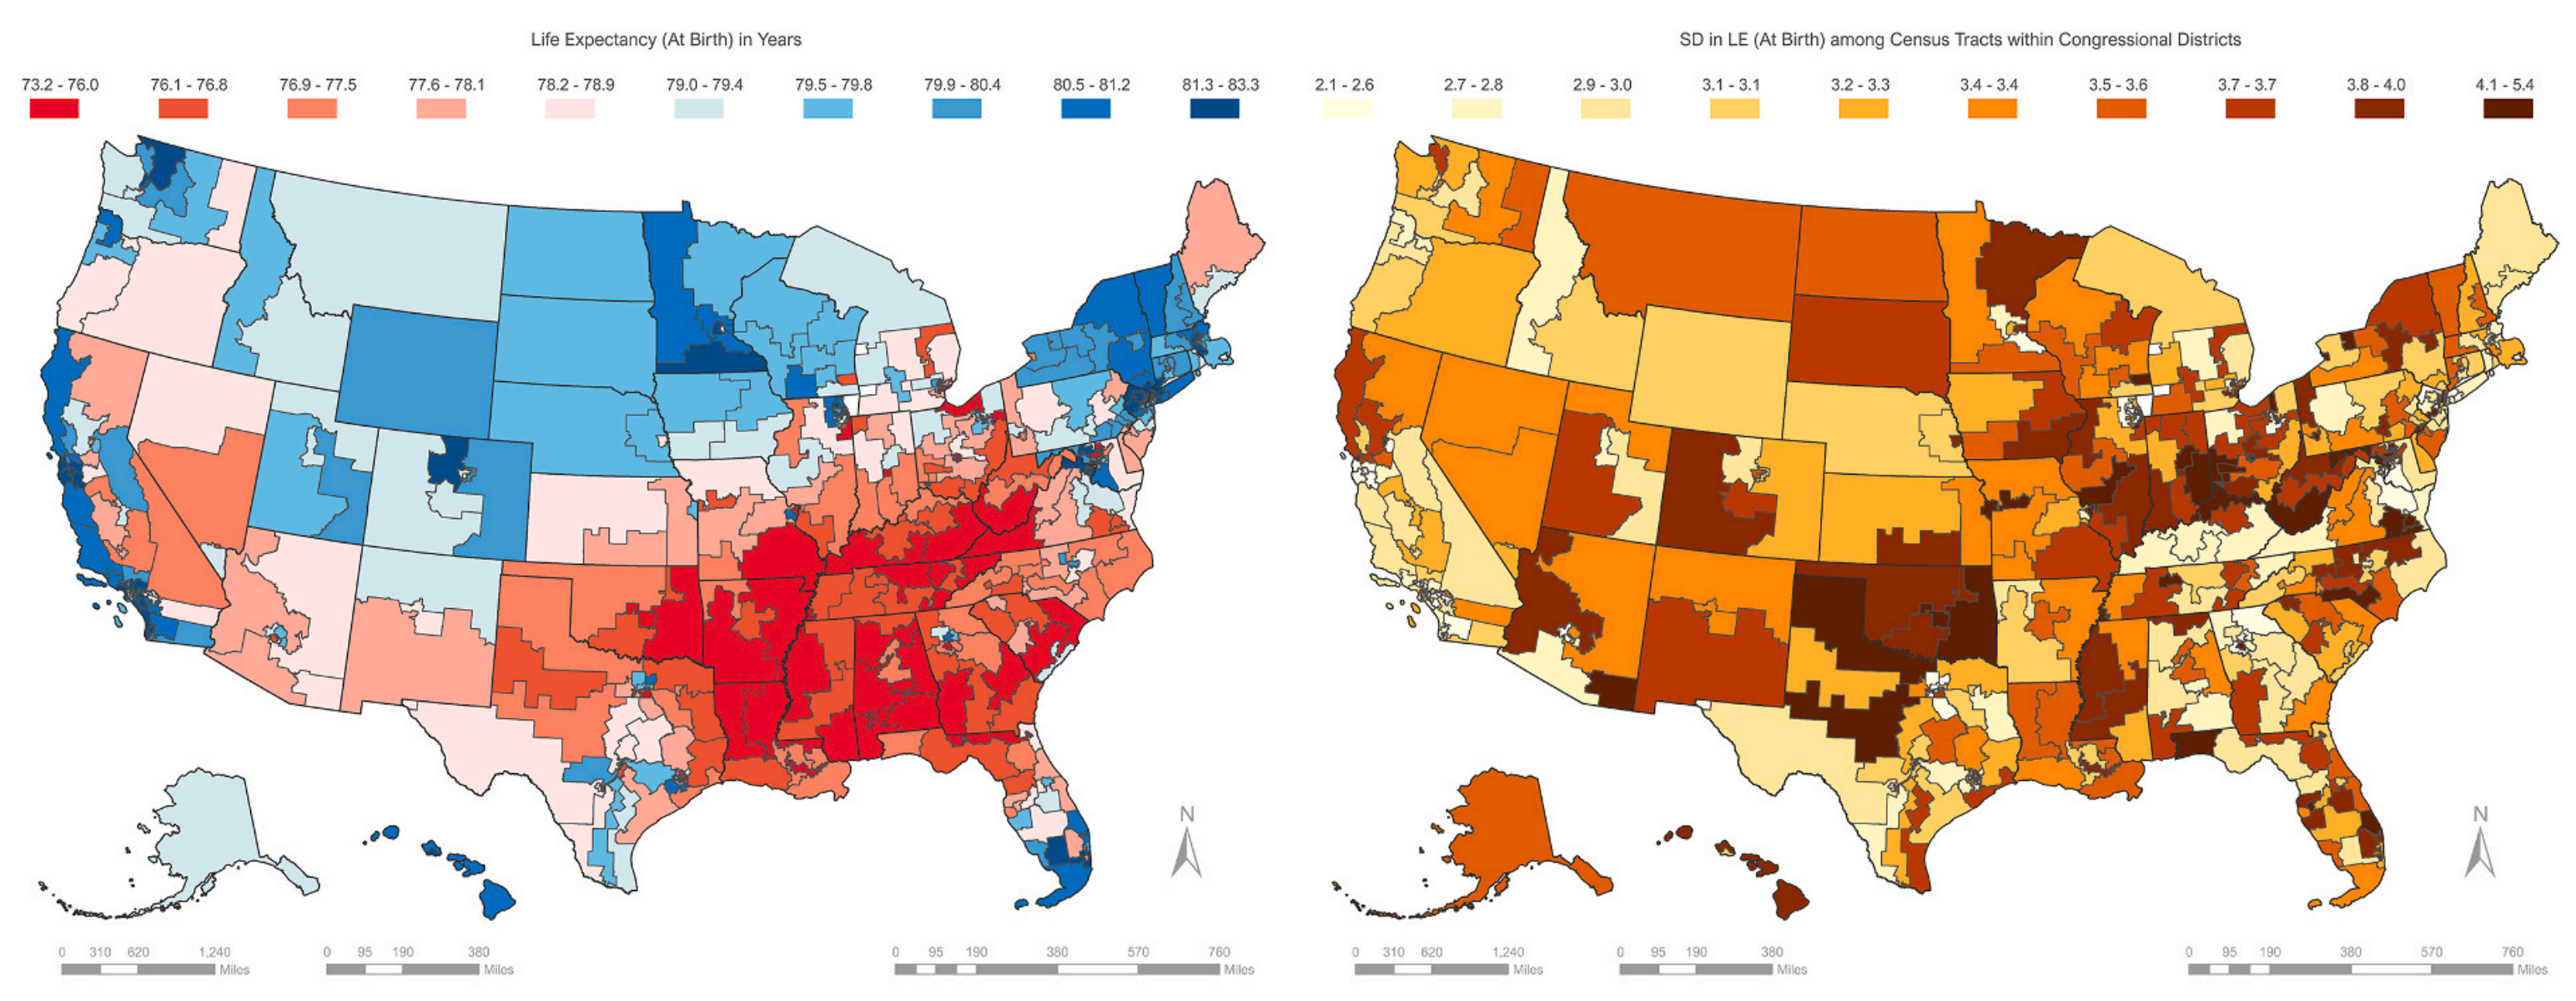
ABSTRACT: Examining data on the congressional district level may better align with the interests of Members of Congress who have the power to implement federal health policies. Despite this importance, measurement of health indicators at the congressional district level remains widely understudied. In this study, we estimated overall life expectancy and variation within each congressional district by computing standard deviations of census tract-level age-specific life expectancies for 2010–2015. We found smaller standard deviations in congressional districts with higher overall life expectancy at younger ages, but the pattern was reversed at older ages.
Life expectancies across congressional districts in the United States