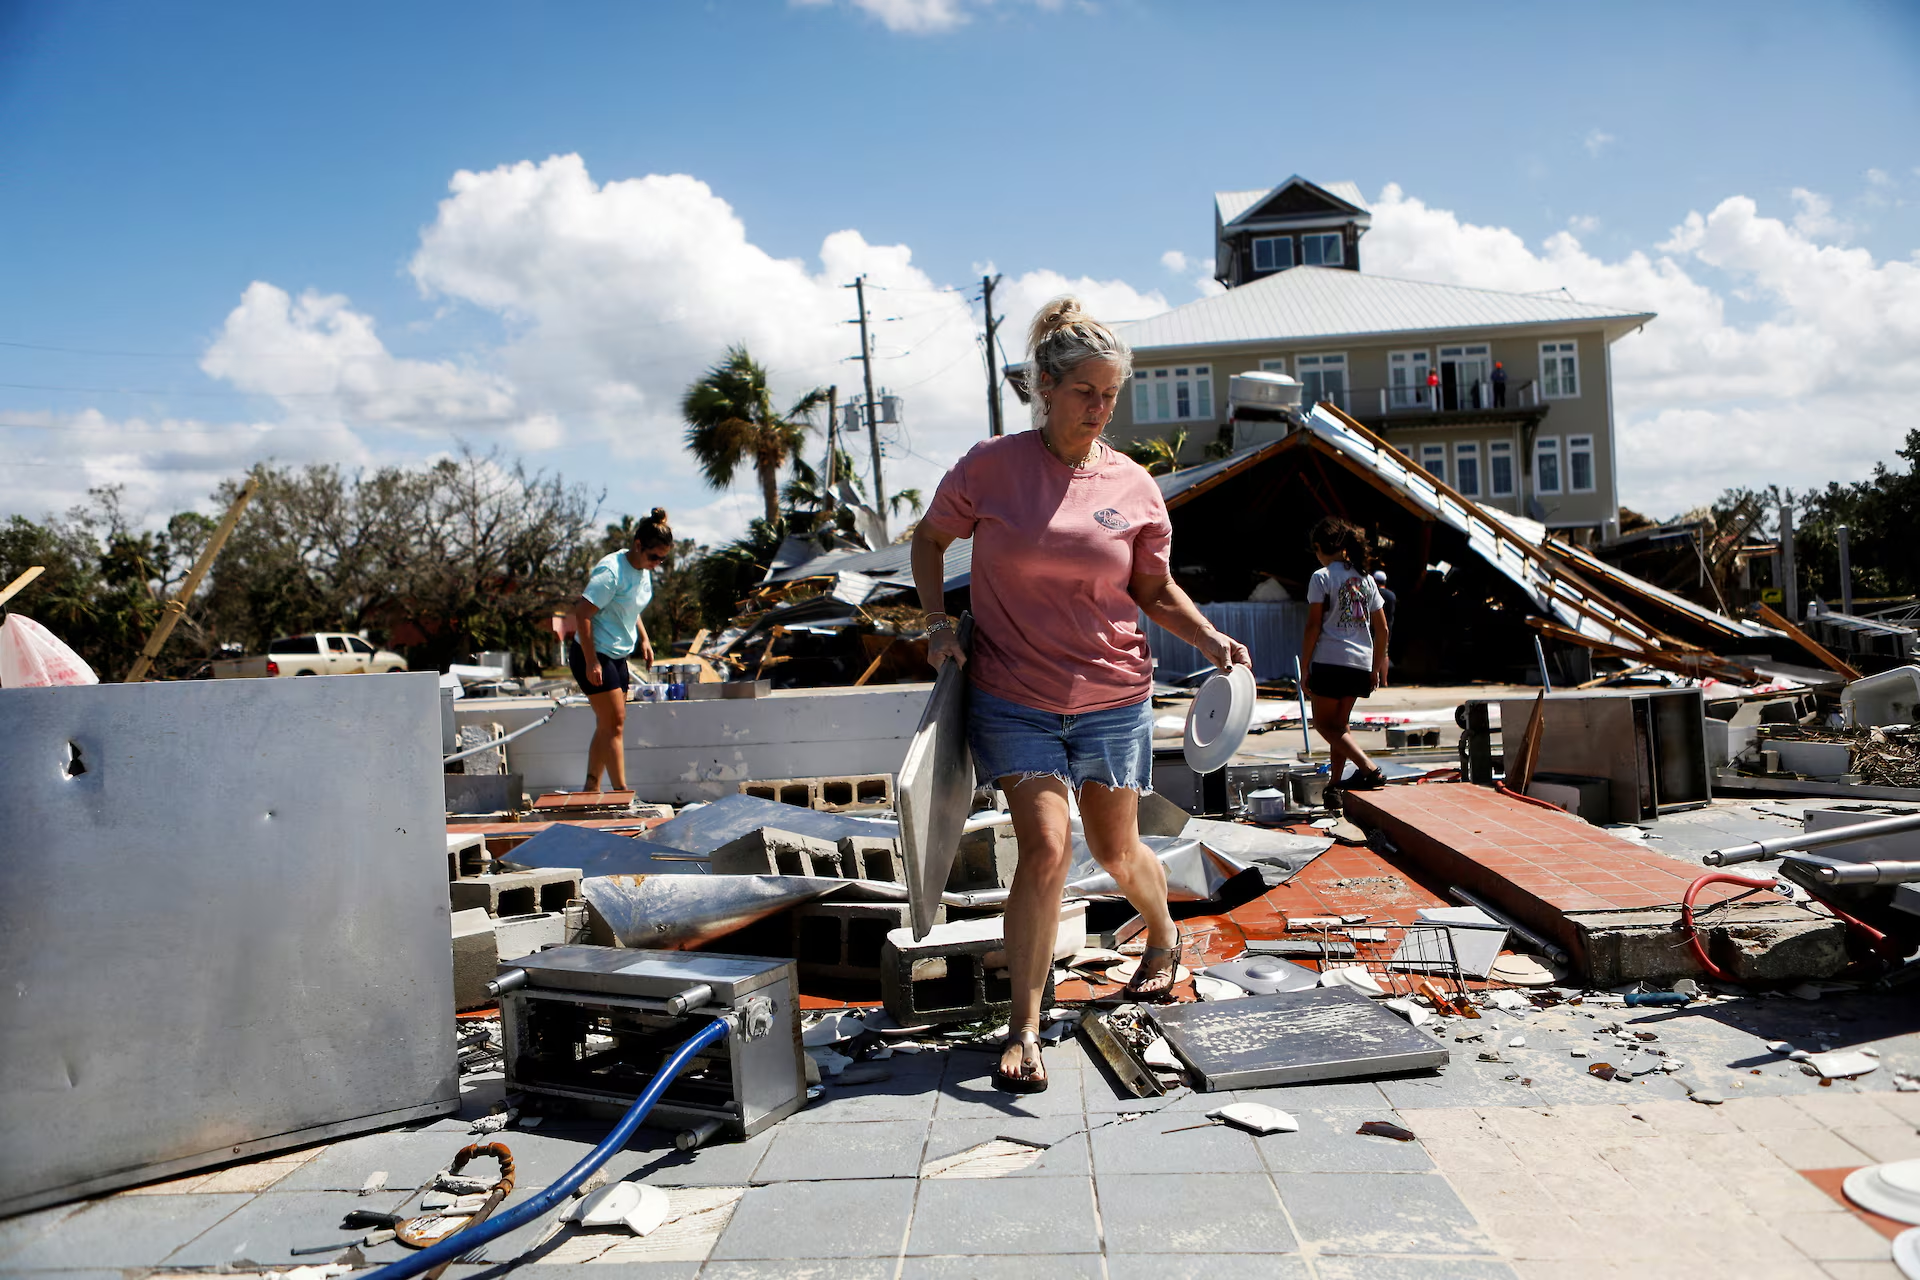
8 August 2024 (Center for American Progress) – In the devastating aftermath of Hurricane Debby, the Southeast is tasked with the difficult work of rebuilding homes, businesses, and lives. Initial reports indicate at least six people have died from the storm. Federal agencies play a critical role in providing swift and efficient support to these families and […]
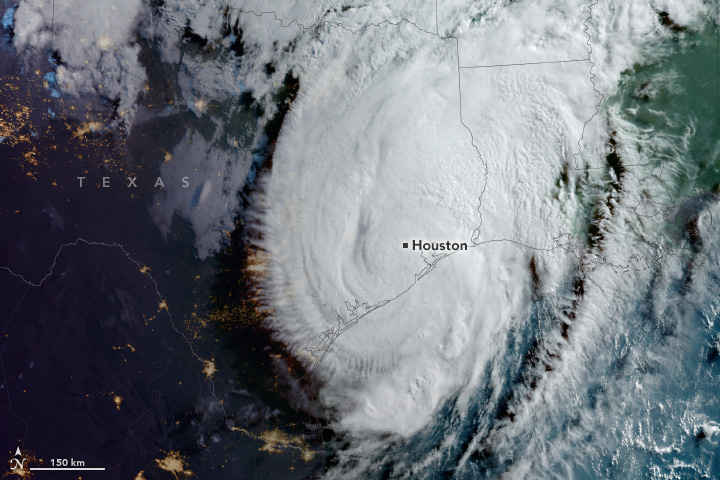
By Clyde Hughes, Allen Cone, and Darryl Coote 8 July 2024 (UPI) – At least eight people were killed after Hurricane Beryl slammed southeast Texas with heavy winds, rain and flash flooding Monday. More than 2.5 million were still without power late Monday. The death toll included seven people killed in Texas and one in […]
By Scott Cohn 2 July 2024 (CNBC) – An insurance crisis that has sent premiums skyrocketing and caused carriers to flee coastal states like Florida and California is spreading, and it is fundamentally changing the real estate market in states across the country. “Not only is the cost higher than people anticipated, but just the inability to […]
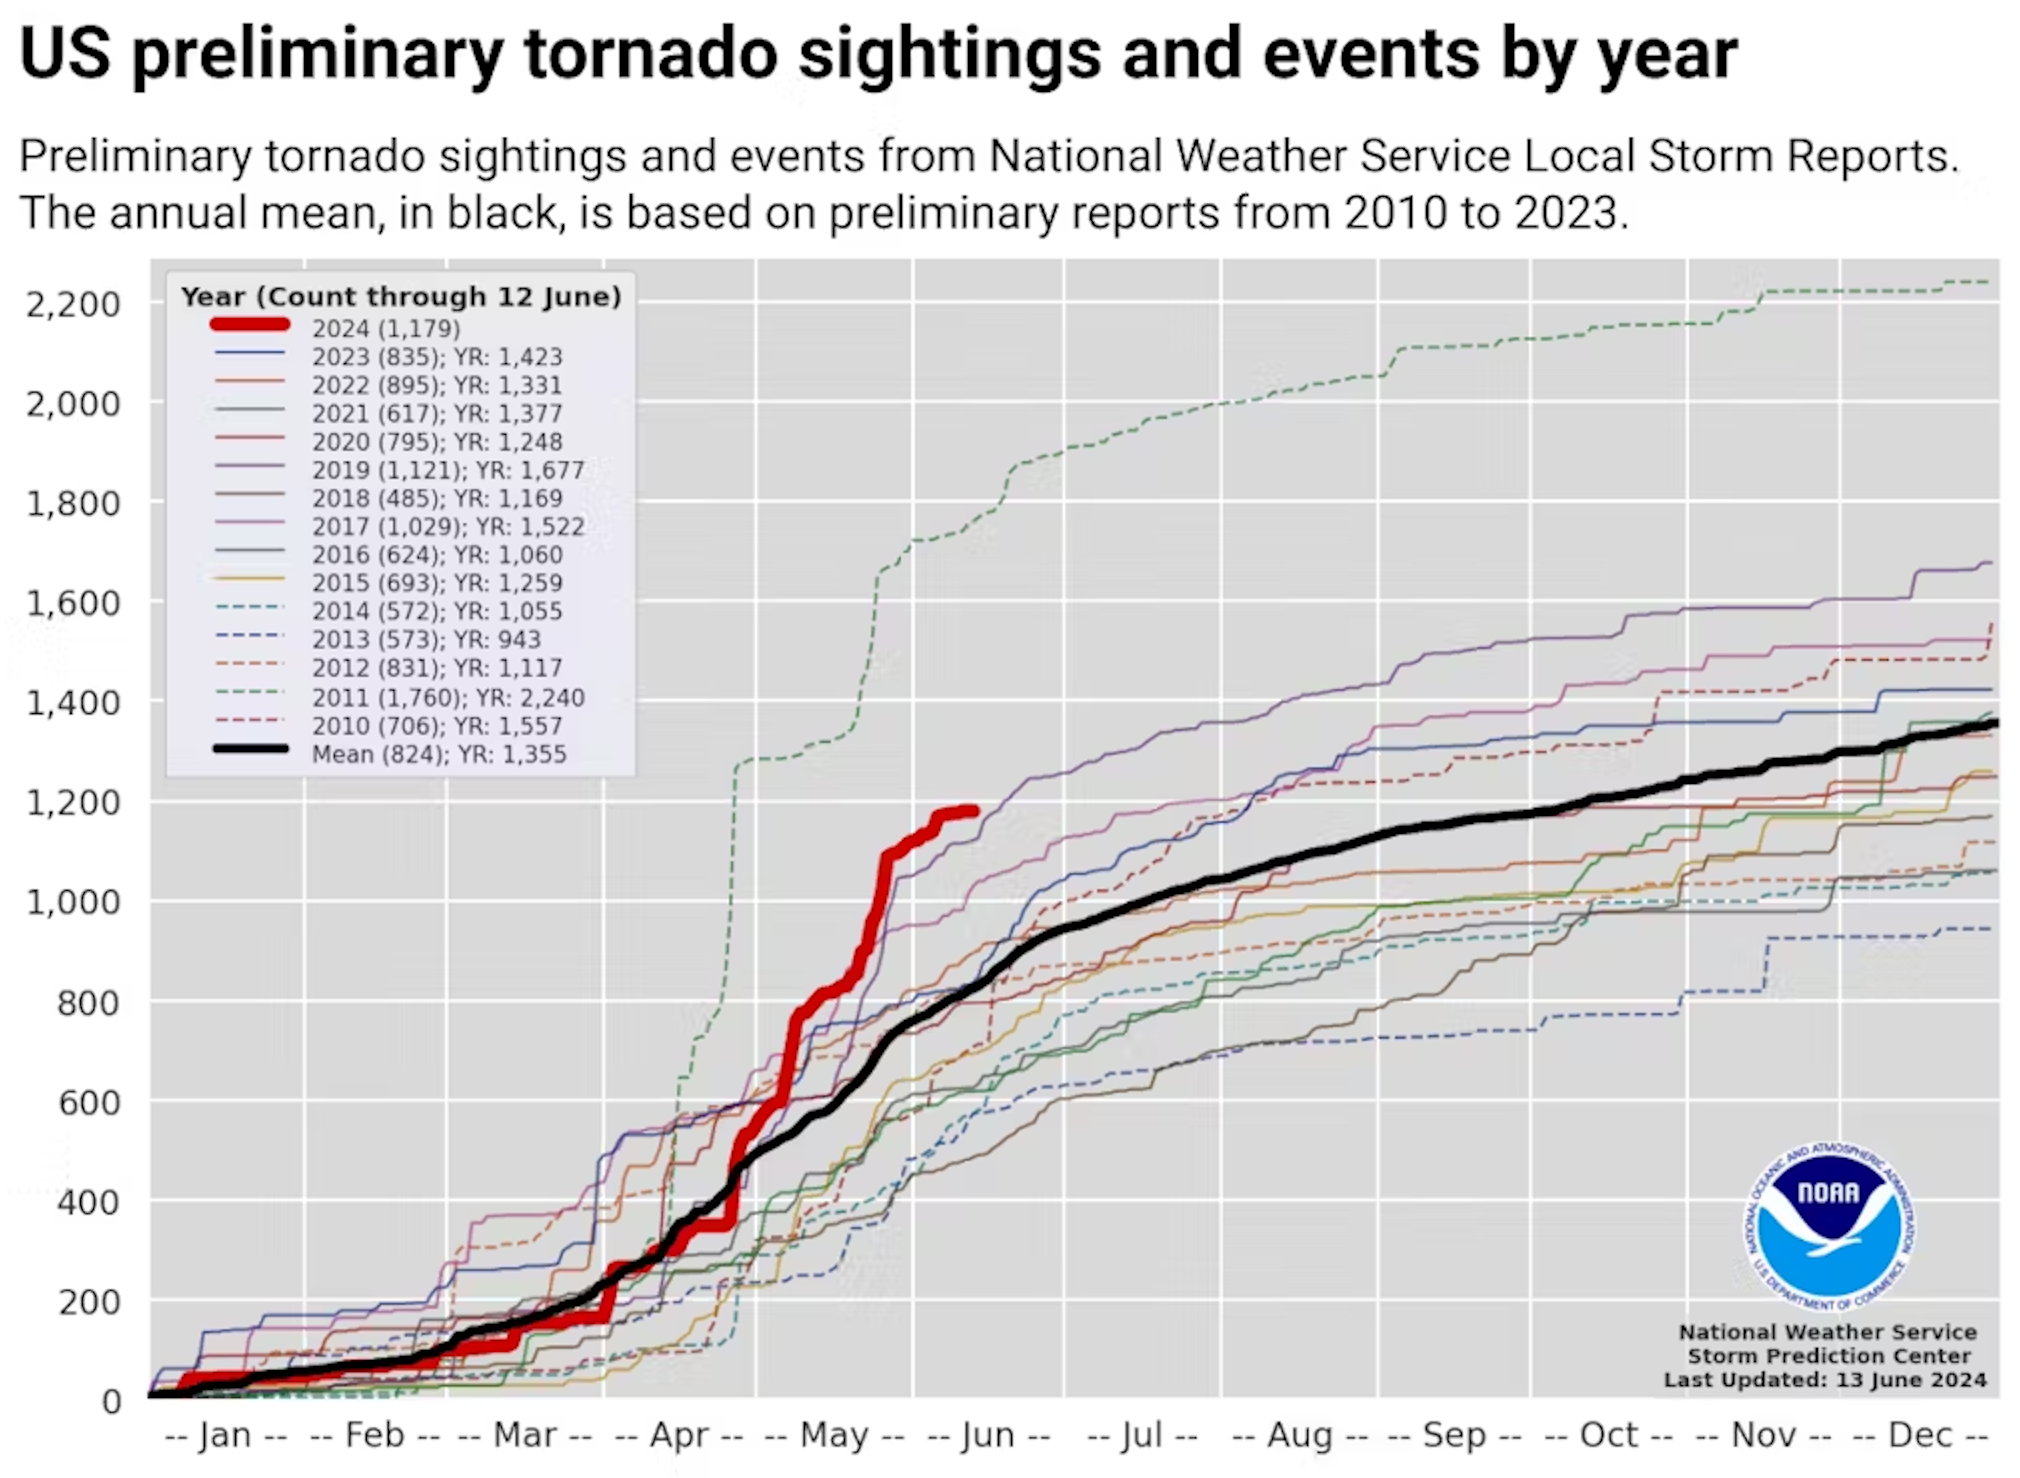
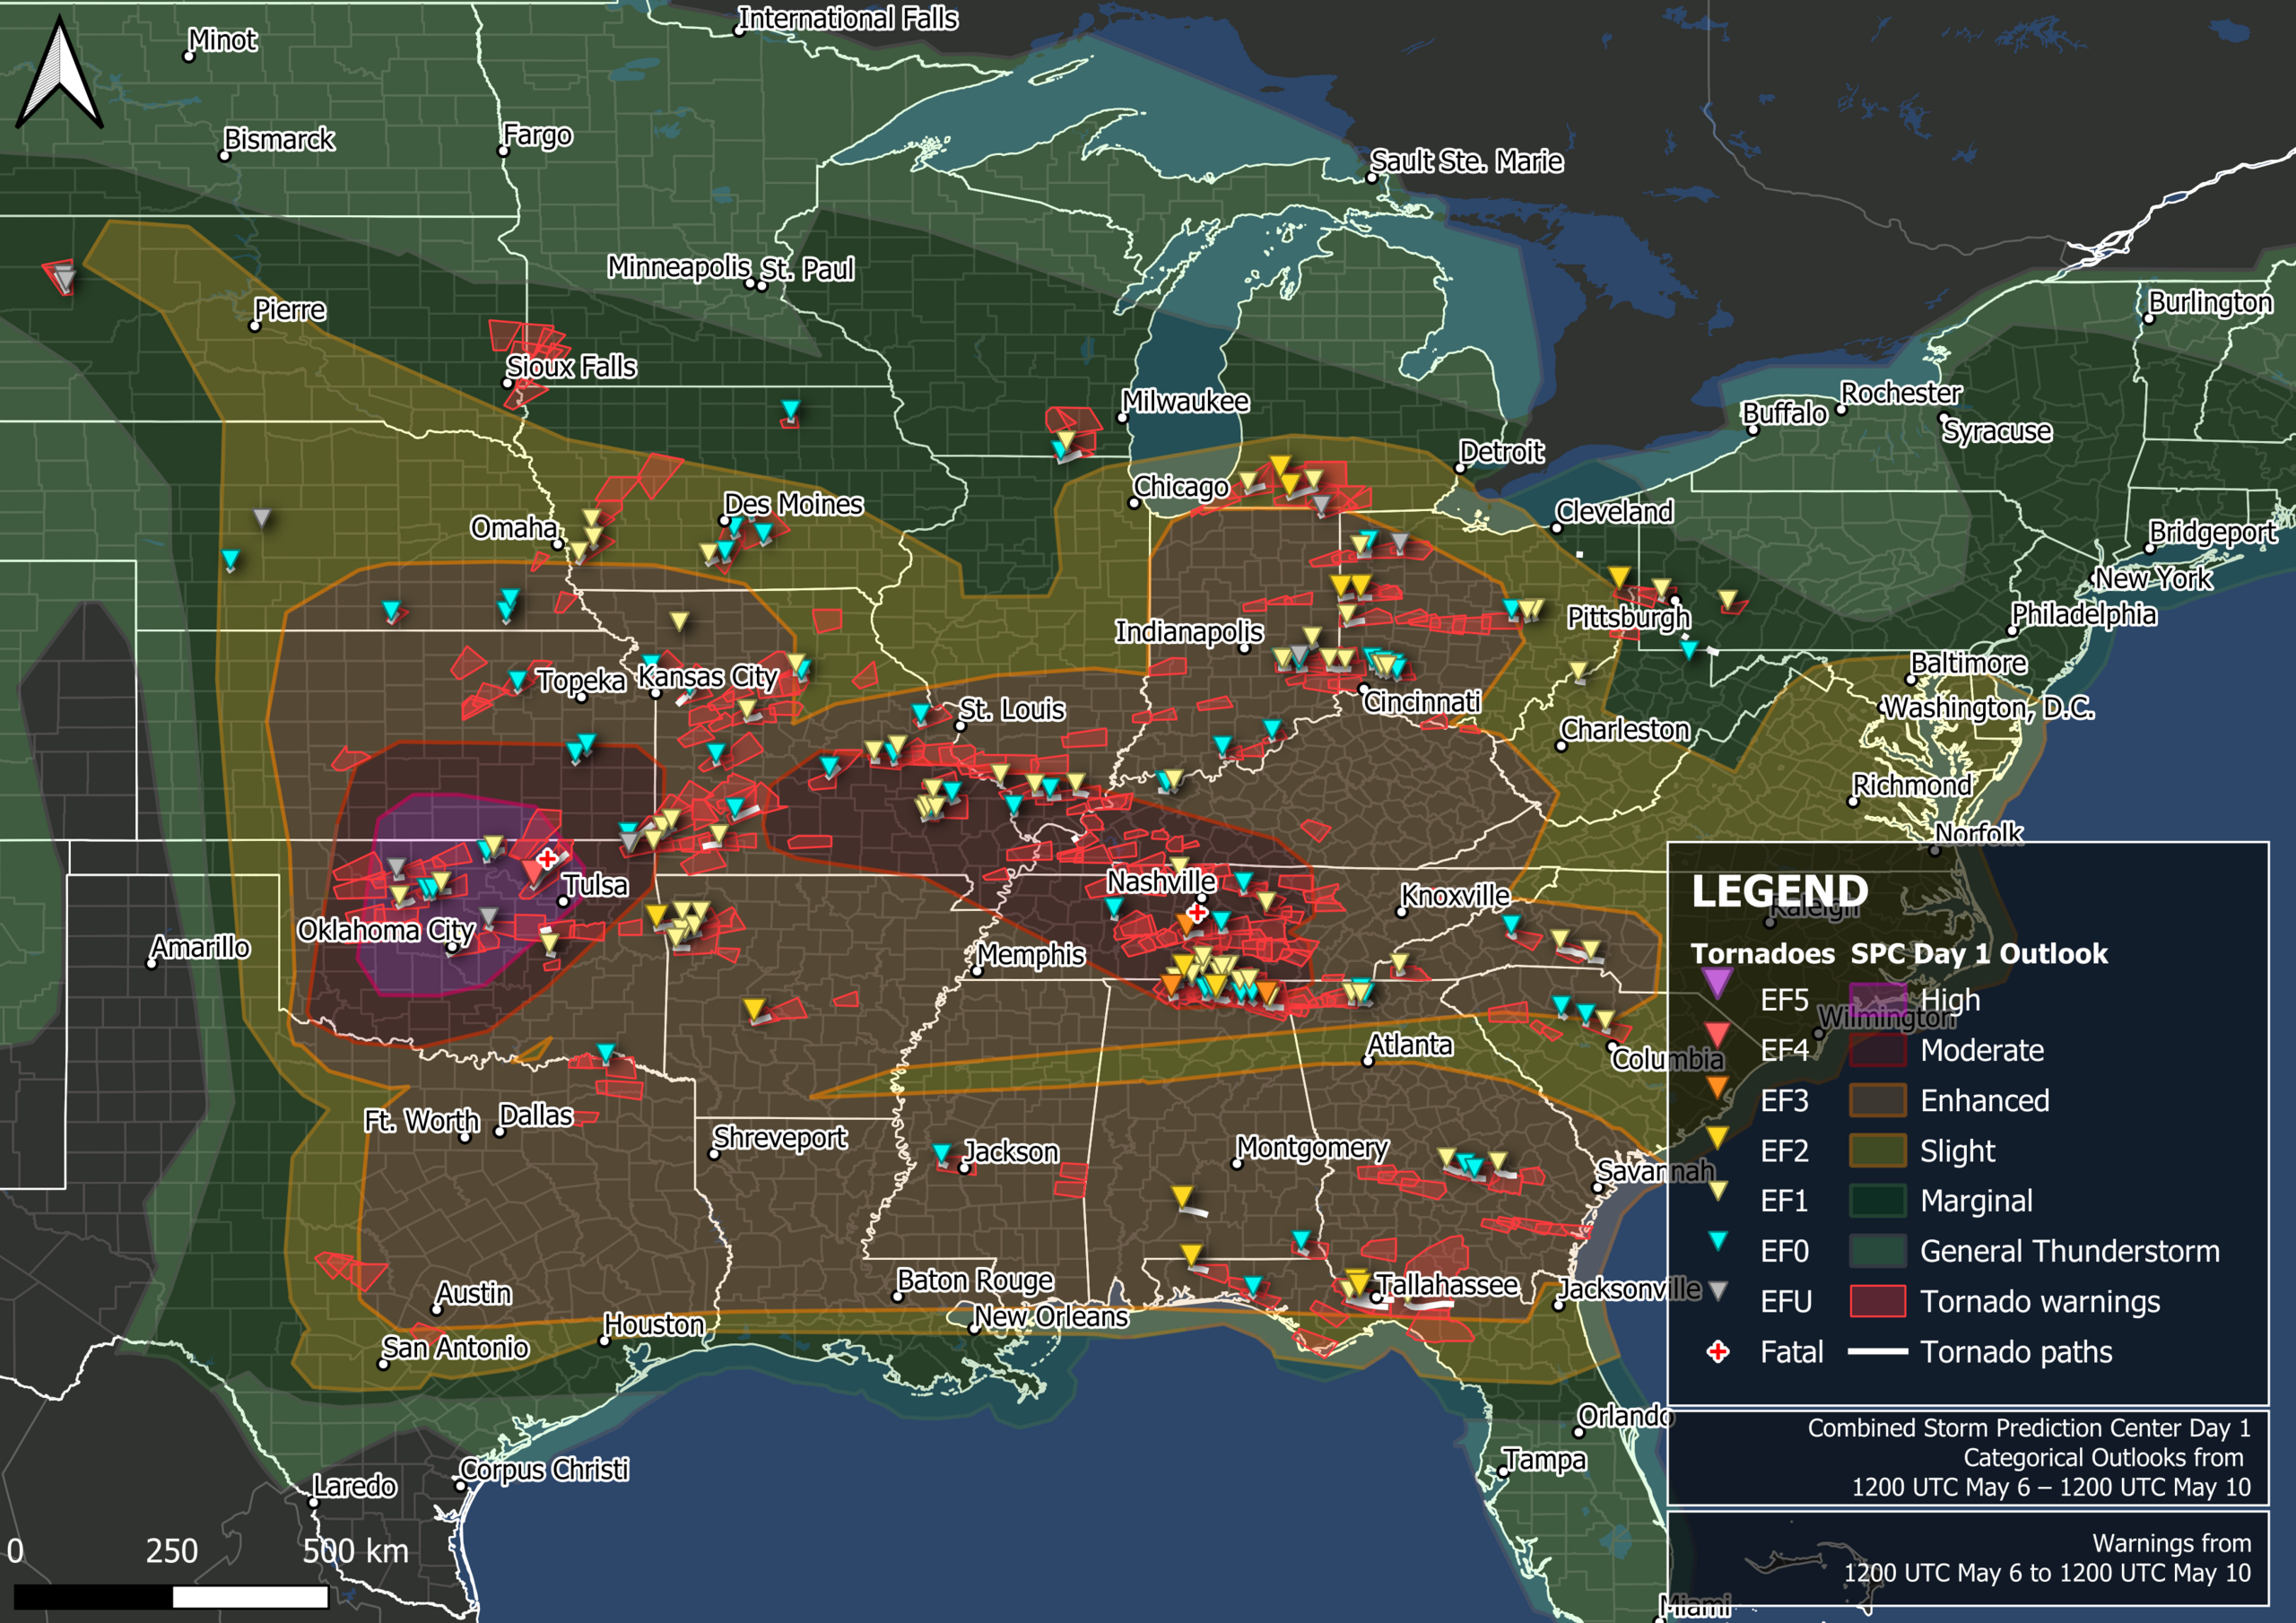
By William Gallus 26 June 2024 (The Conversation) – Spring 2024 was unnerving for people across large parts of the U.S. as tornado warnings and sirens sent them scrambling for safety. More than 1,100 tornadoes were reported through May − a preliminary number but nearly twice the 30-year average at that point and behind only 2011, when deadly […]
By Delaney Nolan 11 Jun 2024 (The Guardian) – Gloria Gellot, 79, takes a careful seat in a kitchen chair in front of her only air-conditioning unit, massaging her knees. She’s hung a sheet in the doorway to keep the cool air in the kitchen, and drawn shades to keep the sun – already blazing […]
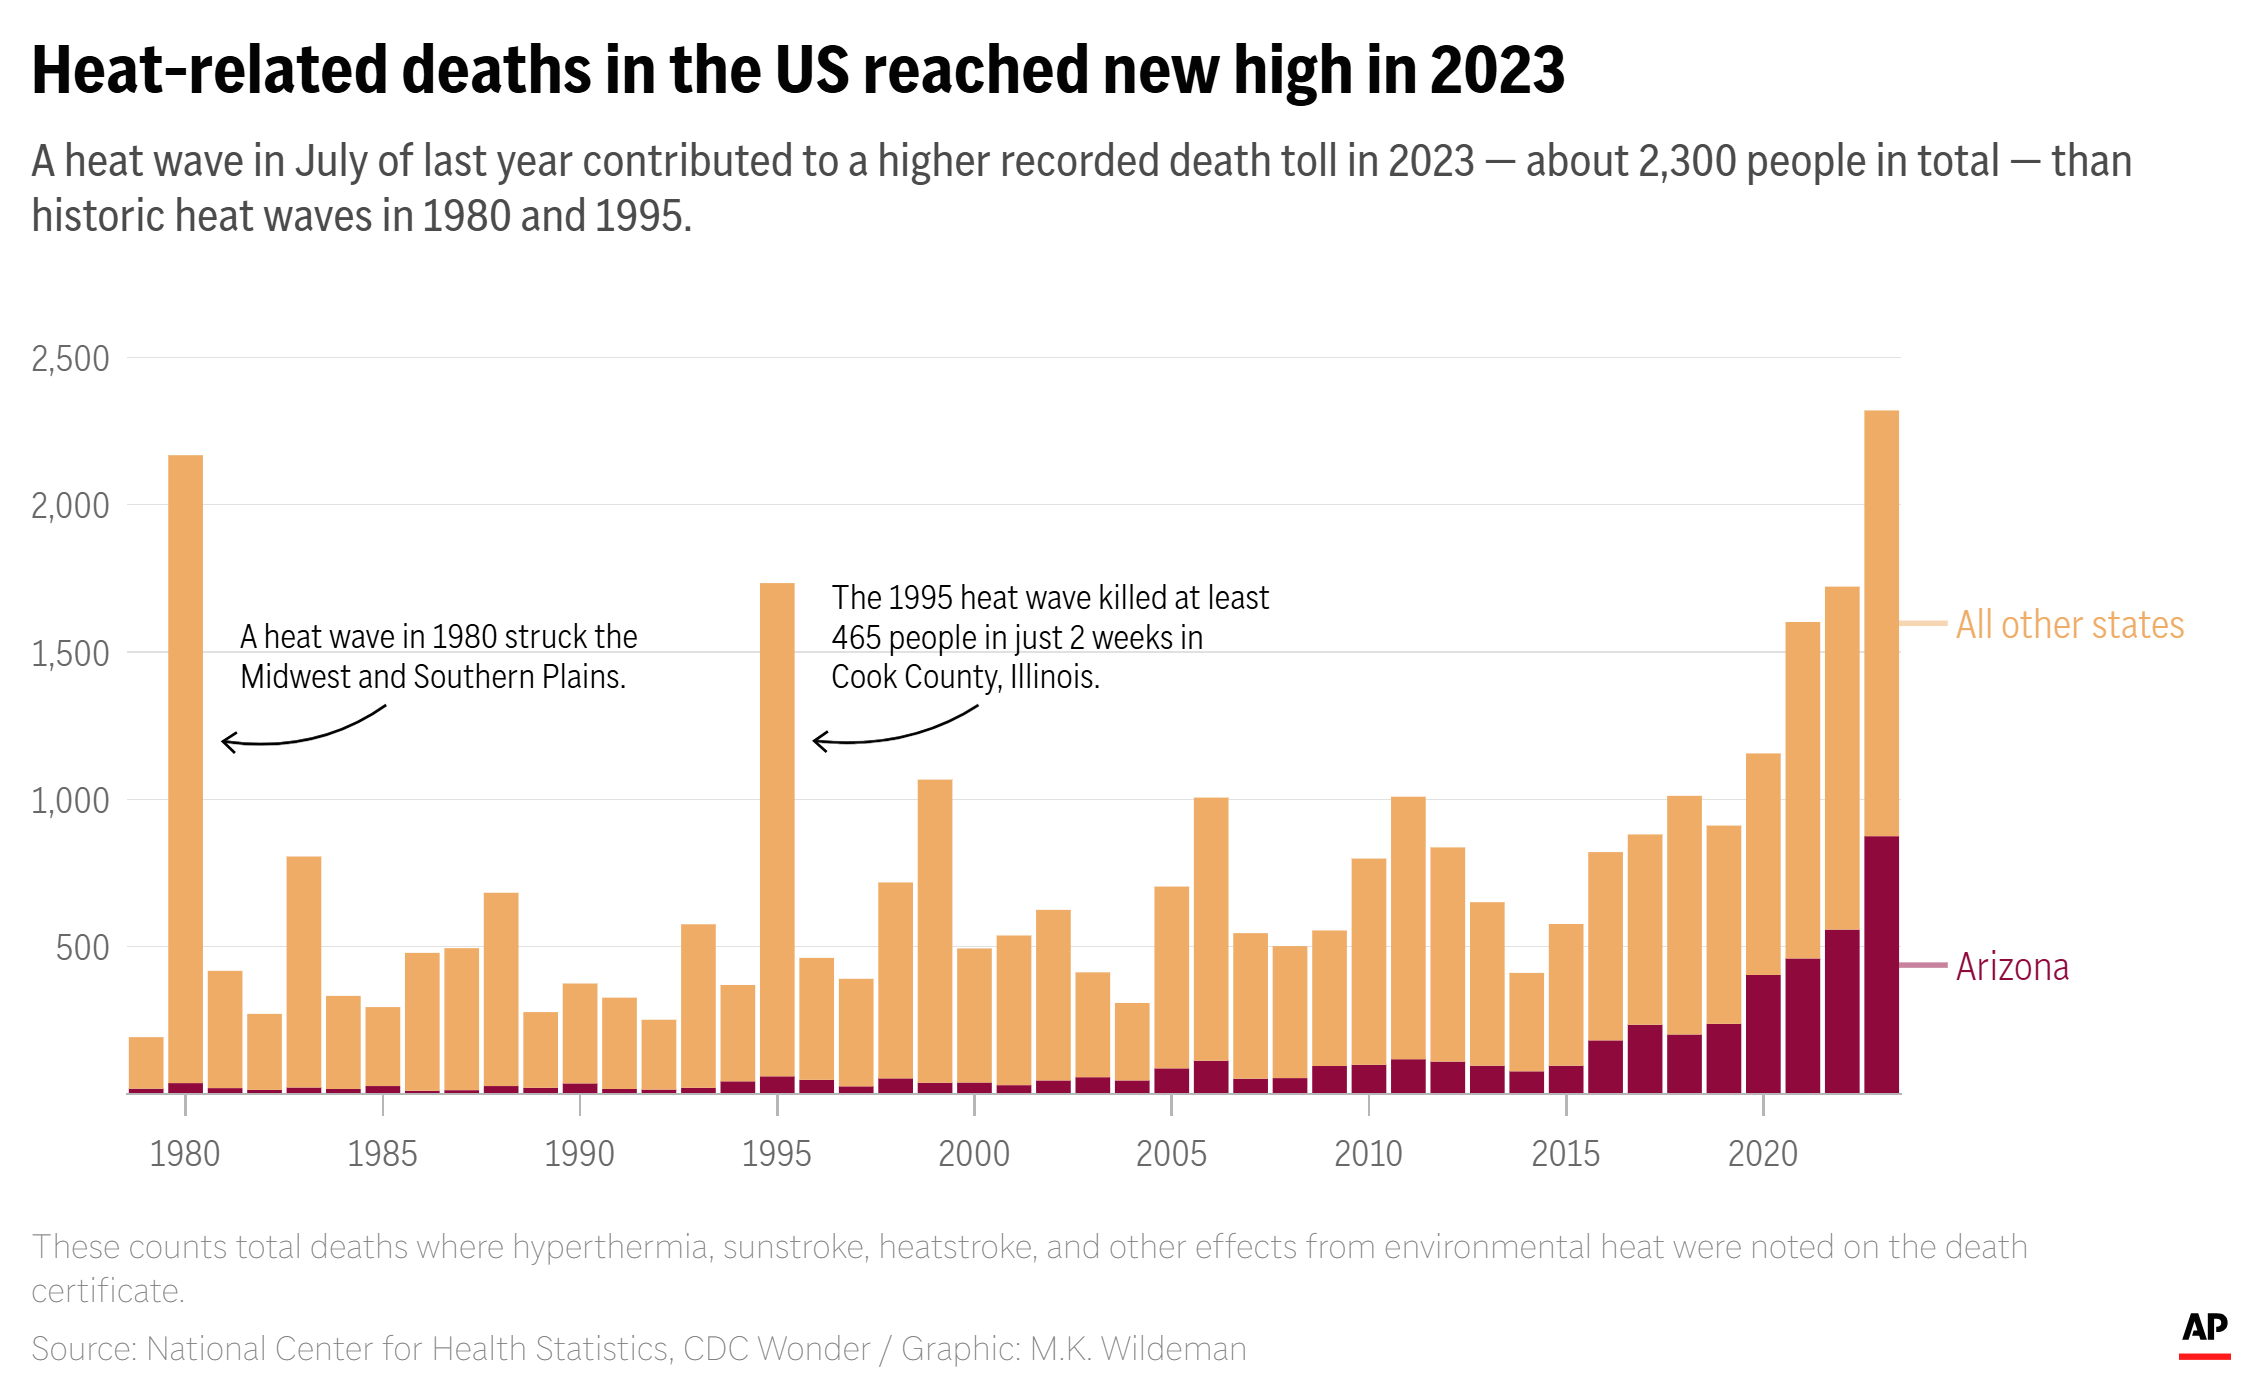
By Seth Borenstein, Mary Katherine Wildeman, and Anita Snow 31 May 2024 (AP) – David Hom suffered from diabetes and felt nauseated before he went out to hang his laundry in 108-degree weather, another day in Arizona’s record-smashing, unrelenting July heat wave. His family found the 73-year-old lying on the ground, his lower body burned. Hom […]
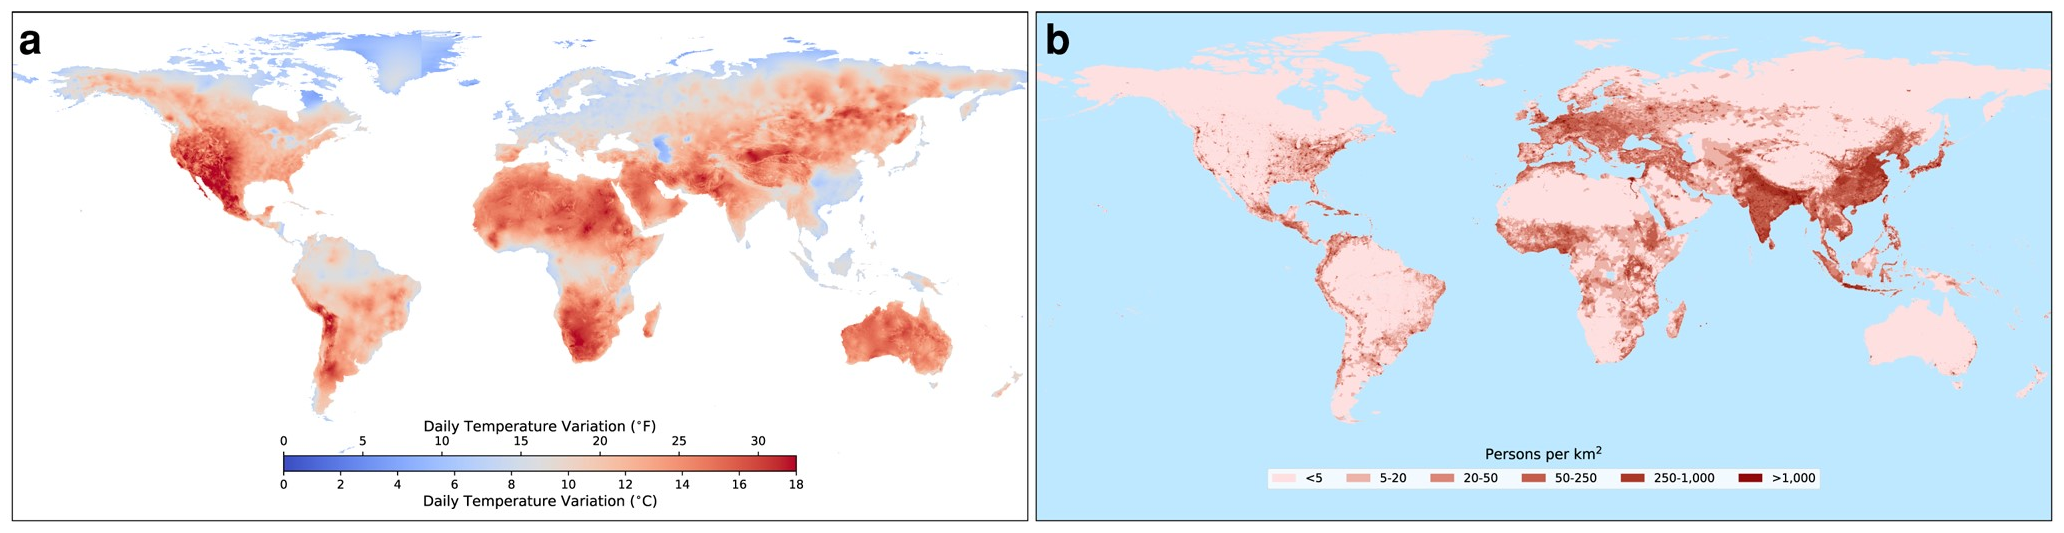
22 May 2024 (PNAS Nexus) – Extreme heat can harm human health, but so can extreme temperature swings. Large daily temperature variation (DTV) has been associated with elevated mortality in studies around the world. Trees and other vegetation can lower DTV, as trees reduce temperature through transpiration during the day and also trap long-wave radiation […]
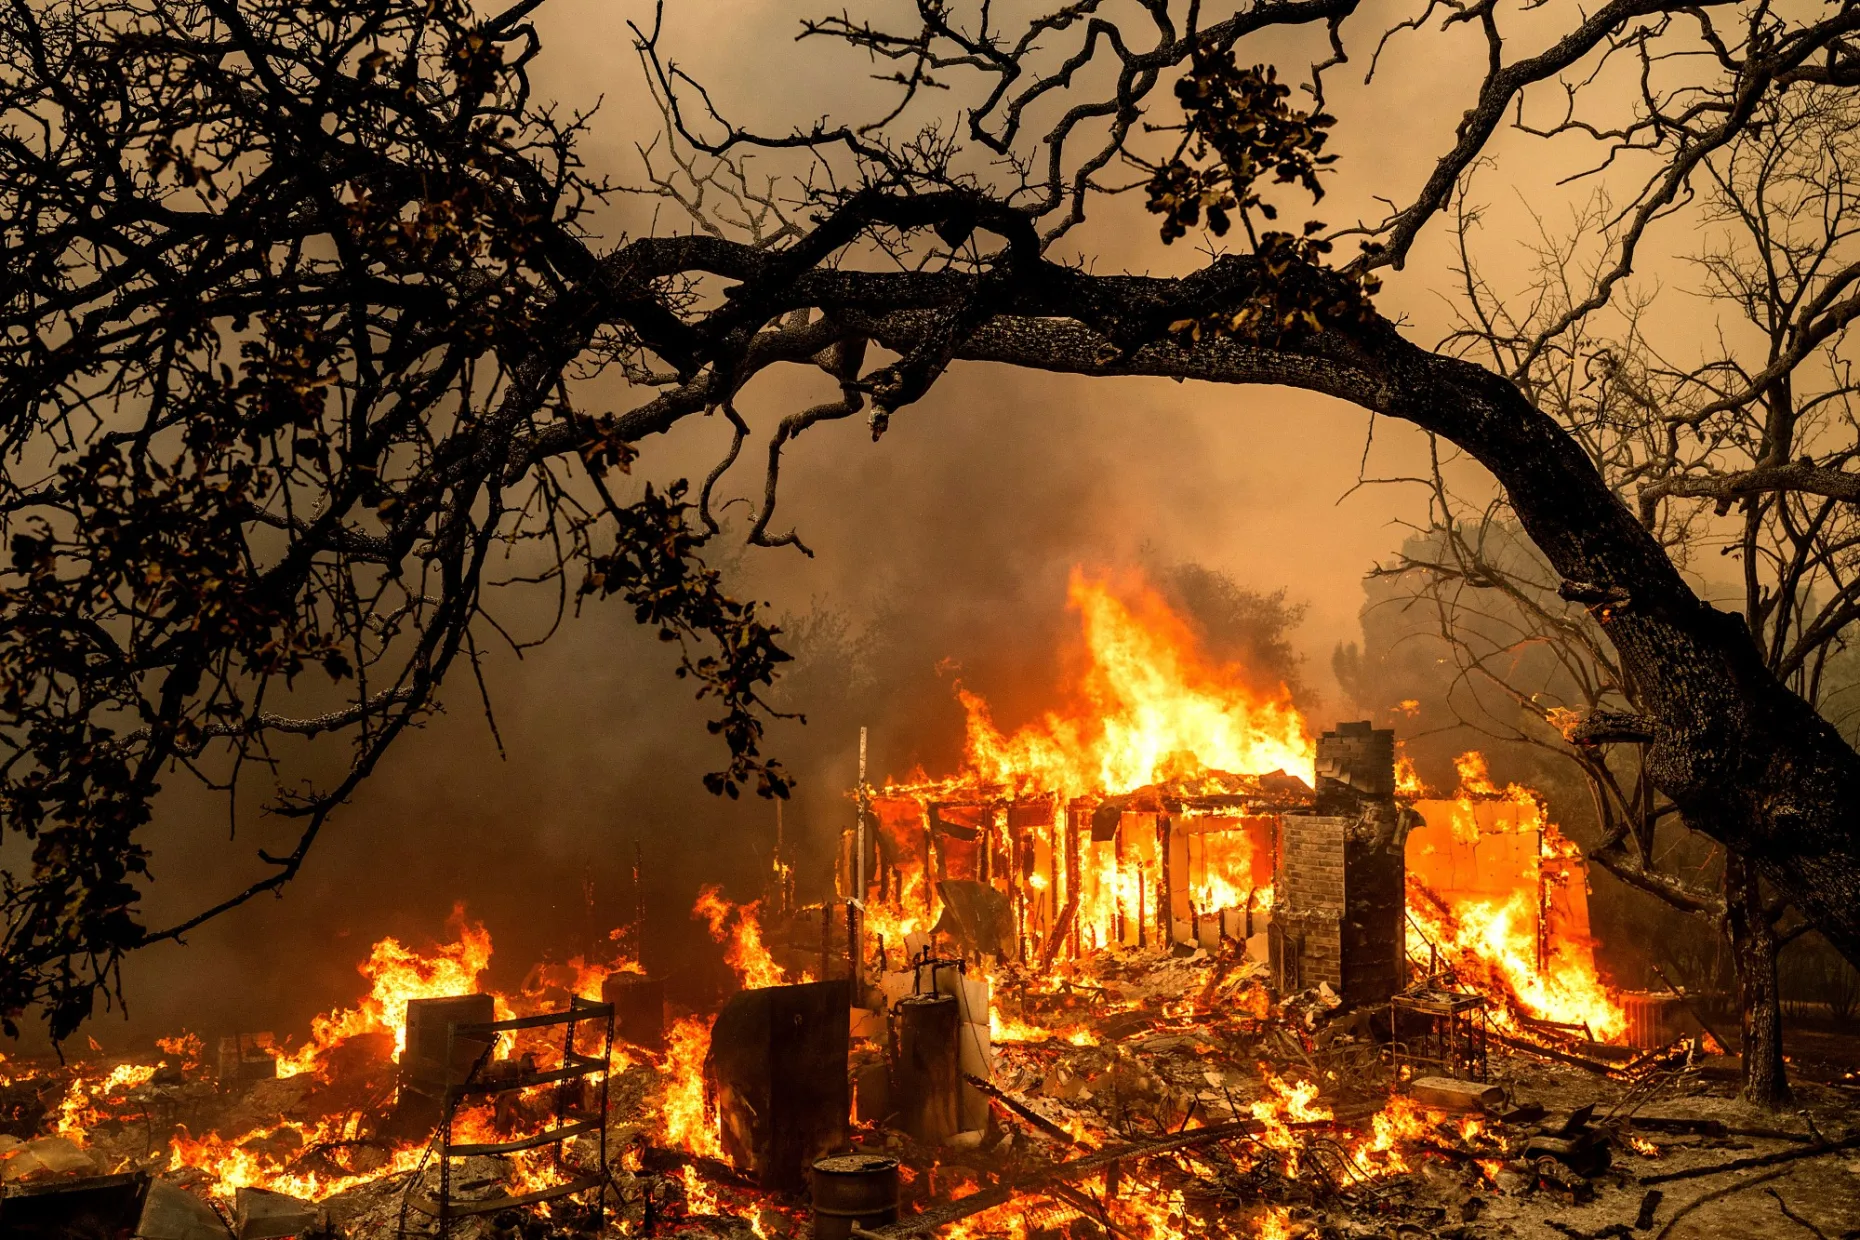
By Jake Bittle 16 May 2024 (Grist) – The rising cost of homeowner’s insurance is now one of the most prominent symptoms of climate change in the United States. Major carriers like State Farm and Allstate have pulled back from offering fire insurance in California, dropping thousands of homeowners from their books, and dozens of small […]
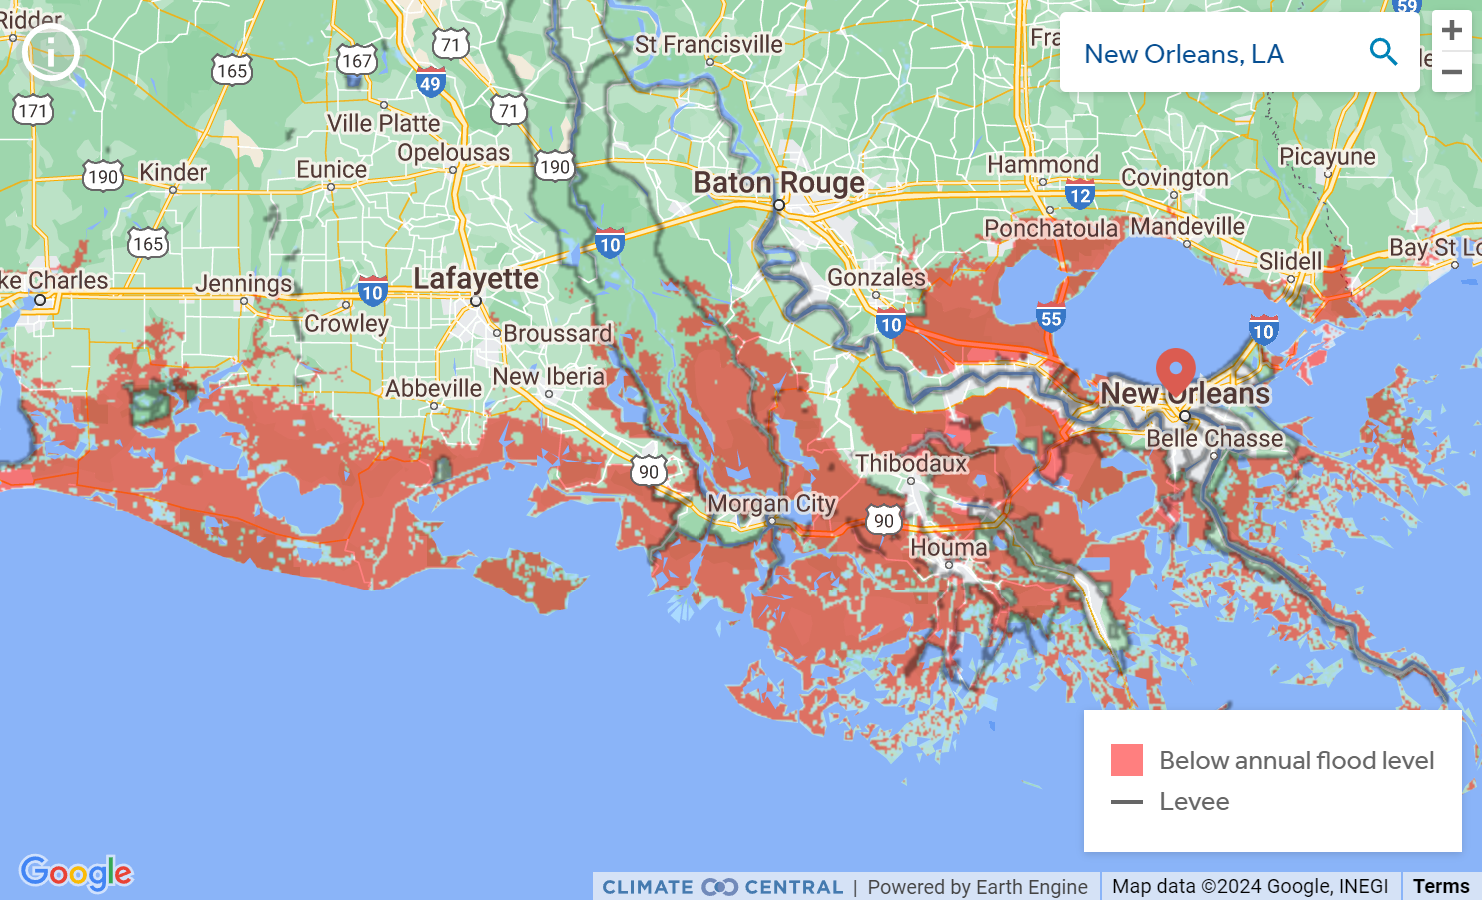
By John O’sullivan 1 January 2024 (Irish Star) – Several parts of The United States could be underwater by the year 2050, according to a frightening map produced by Climate Central. The map shows what could happen if the sea levels, driven by climate change, continue to rise at rates of 2 mm and 4 mm […]
By Sara Moniuszko 9 November 2023 (CBS News) – A record number of American kindergarten students started school last year with an exemption from one of the key vaccines health authorities require, according to new data from the Centers for Disease Control and Prevention. In the report published Thursday, the CDC examined immunization program data to […]