Study finds super-emitters responsible for nearly 40 percent of methane emissions in five U.S. basins – “These findings drive home the need for swift action to advance strong methane rules in the U.S.”
PASADENA, 13 September 2022 (JPL) – A study released today by Carbon Mapper, University of Arizona, NASA’s Jet Propulsion Laboratory (JPL), Arizona State University, and Environmental Defense Fund (EDF) shows that strong methane point sources contribute an average of 40% of total emissions across multiple basins in the U.S., revealing that a small number of emitters account for a disproportionately high fraction of emissions. The ability to quantify the regional impact of super-emitters (point sources that emit greater than 22 pounds or 10 kilograms of methane per hour)—and precisely determine their causes can improve the accuracy of emissions accounting and inform strategies for timely methane emissions mitigation.
Published today in the Proceedings of the National Academy of Sciences, the research is a key milestone in bridging the gap between research and operations of a global tiered observing system for methane. A tiered system involves the coordinated application of multiple technologies to observe and analyze methane emissions across a range of scales.
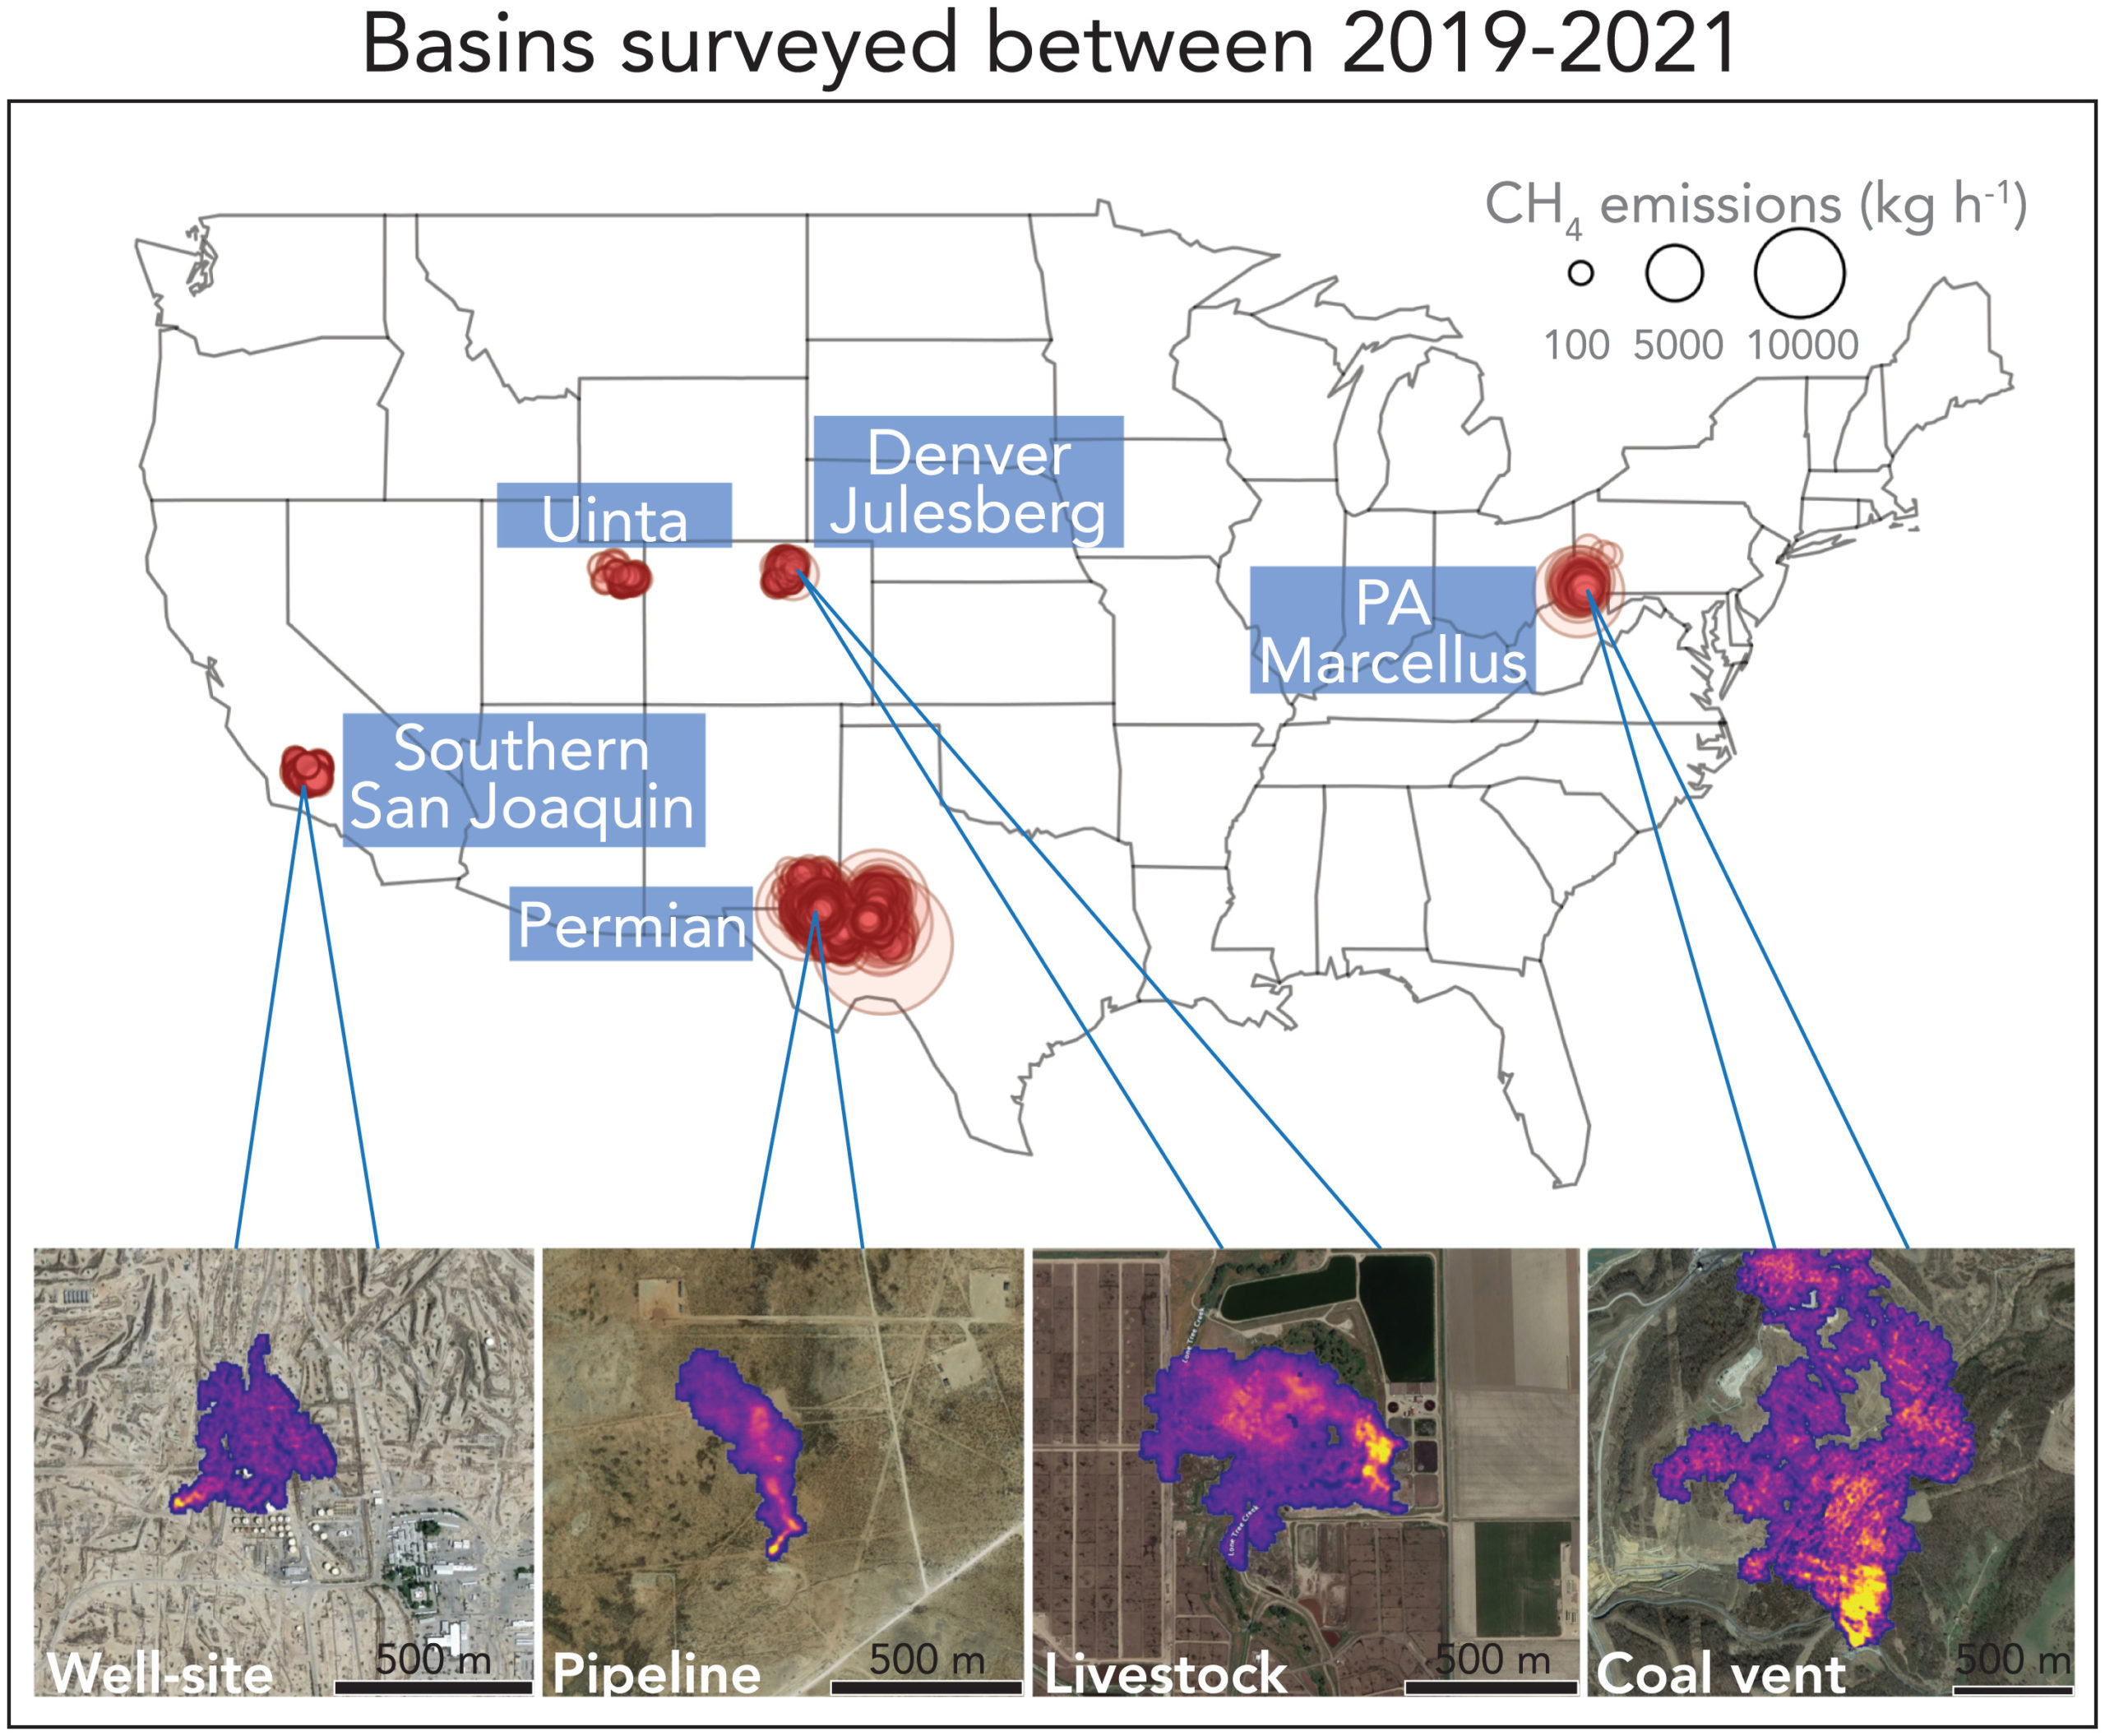
The team mapped five regions from 2019-2021 including the southern San Joaquin Valley in California, Uinta basin in Utah, Denver-Julesburg basin in Colorado, the Permian basin in Texas and New Mexico, and key sections of the Marcellus shale in Pennsylvania. Researchers used a tiered observing system to quantify the net regional emissions, as well as the contributions from over 3,000 individual high emission point sources.
“This study exposes the diversity of methane emission distributions both spatially and by sector across the U.S., offering a glimpse into the improved methane detection we can expect in the coming years thanks to the deployment of new satellites,” said Dr. Daniel Cusworth, Project Scientist with Carbon Mapper and lead author. “This multi-tiered observing approach demonstrates and reinforces the potential value of a more sustained and comprehensive assessment of methane sources.”
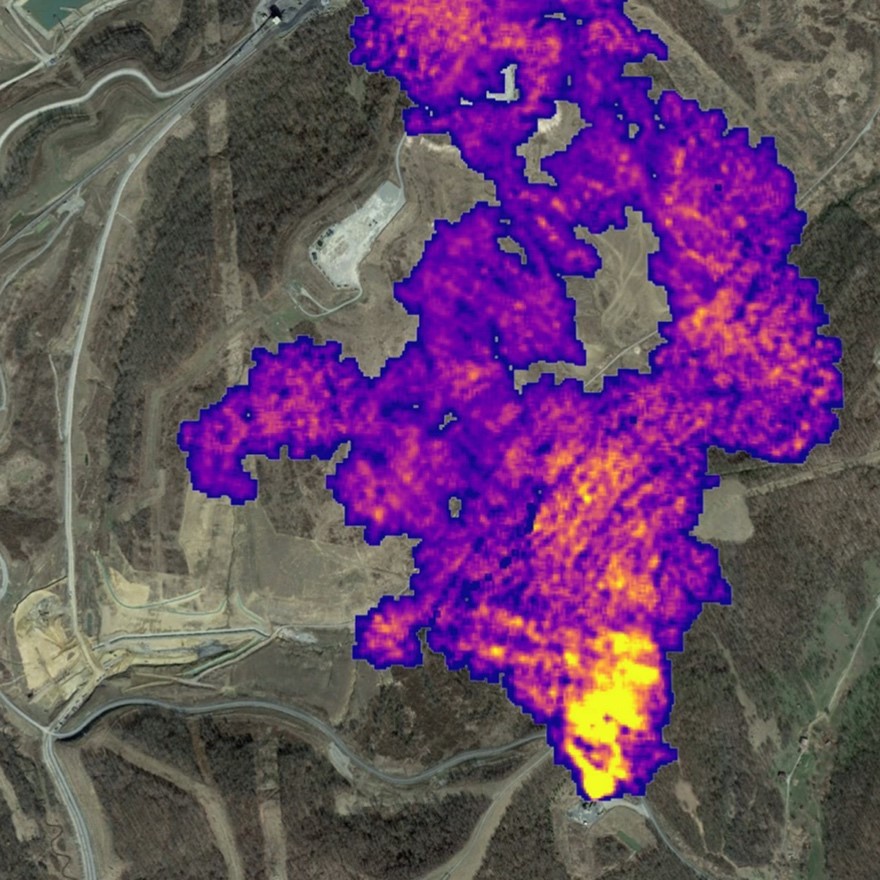
Researchers used airborne imaging spectrometers to pinpoint super-emitters by imaging invisible methane plumes at high resolution.
“Arizona State University’s Global Airborne Observatory (GAO), which is one of the imaging spectrometers used in this study, can pinpoint methane sources to within 15 feet while flying at 18,000 feet. When methane emission plumes are detected, we can then use a high-resolution imagery to relate the plumes to individual pieces of equipment,” said Greg Asner, professor and director of the Center for Global Discovery and Conservation Science, in the Julie Ann Wrigley Global Futures Laboratory at ASU.
The research team used the high-resolution data from the GAO and NASA JPL’s Airborne Visible/Infrared Imaging Spectrometer (AVIRIS-NG) to attribute emissions to major sectors—including key oil and gas production segments, wet manure management from animal feedlots, large landfills, and coal mine venting—and assessed their intermittency by sampling each area several times, in some cases spanning intervals from months to years. The team then contextualized these emissions by comparing them with total basin methane derived from Sentinel 5p satellite observations.
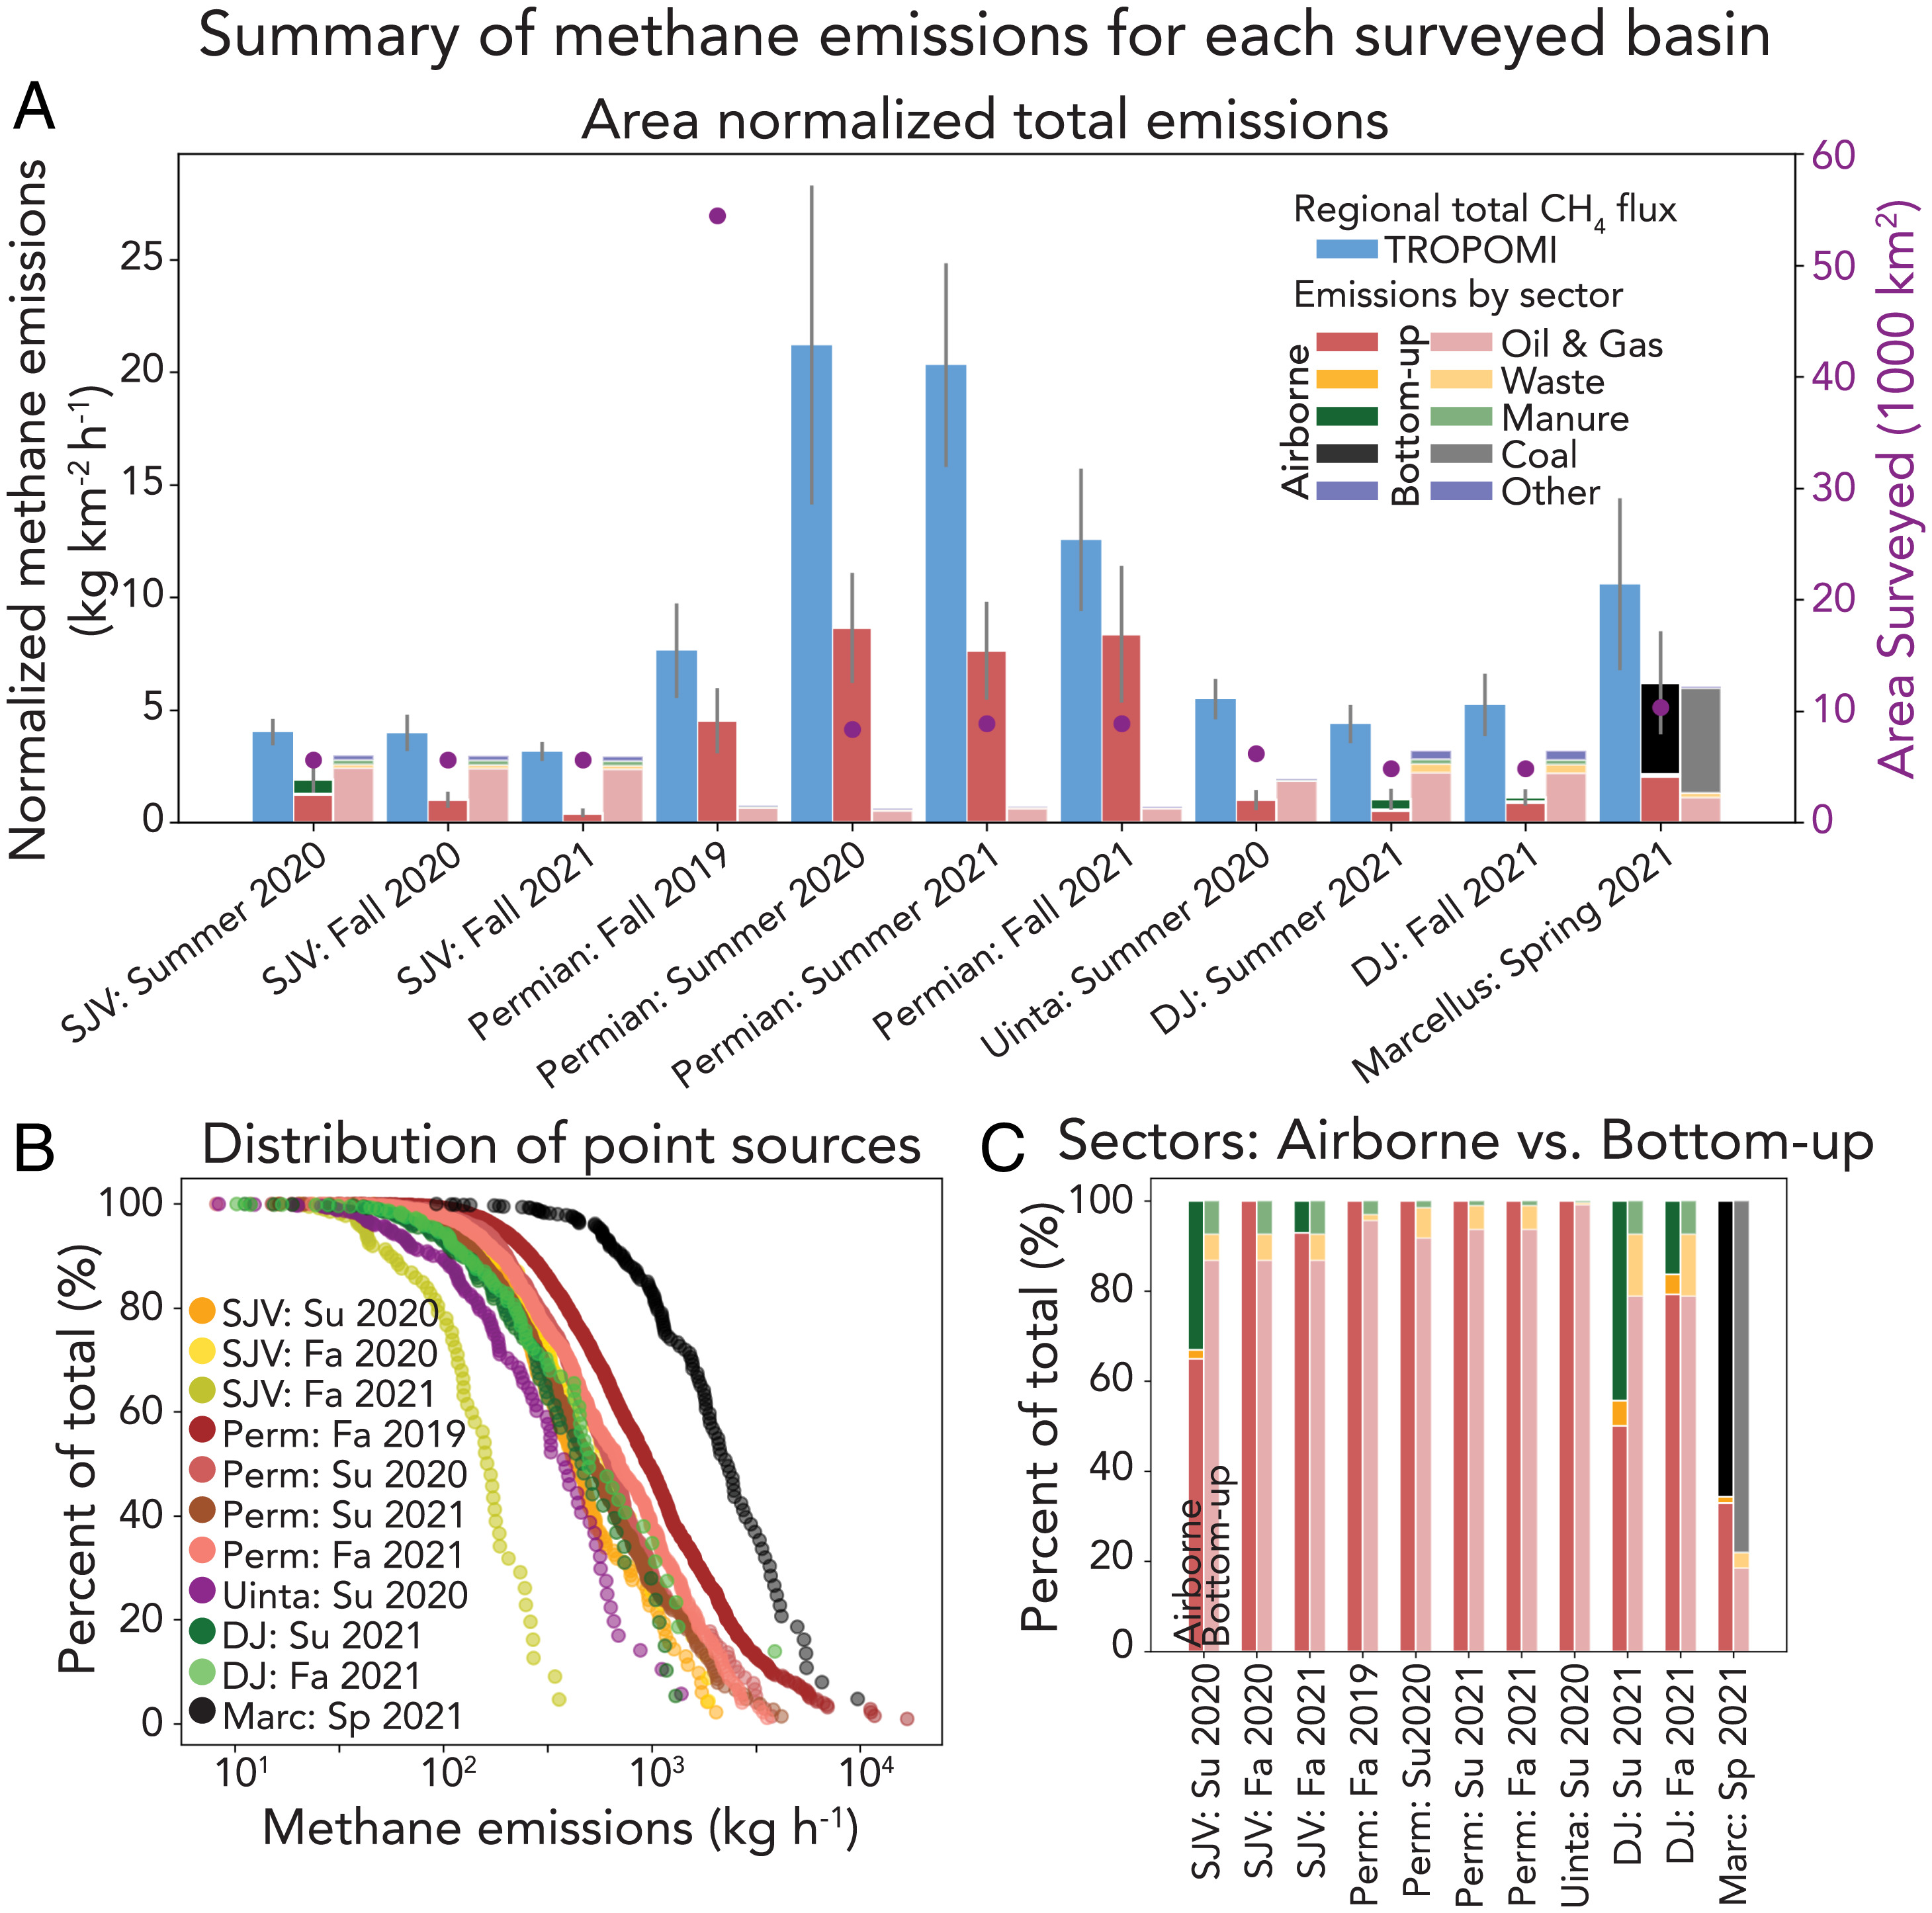
They discovered that across all basins and time periods, super-emitters make up on average 40% of each basin’s total observed methane emissions. This occurs in both oil and gas dominant basins such as the Permian, but also in basins where other emissions sectors play an equivalent or larger role.
“These findings drive home the need for swift action to advance strong methane rules in the U.S., which should tackle pollution from practices like routine flaring—a common source of super-emitters from oil and gas facilities” said David Lyon, Sr. Scientist at Environmental Defense Fund, and study co-author. “This study shows that states that have established leading methane rules like Colorado and California appear to have a lower frequency of super-emitters, underlining the importance of strong nationwide rules from EPA.”
Additional key findings are as follows:
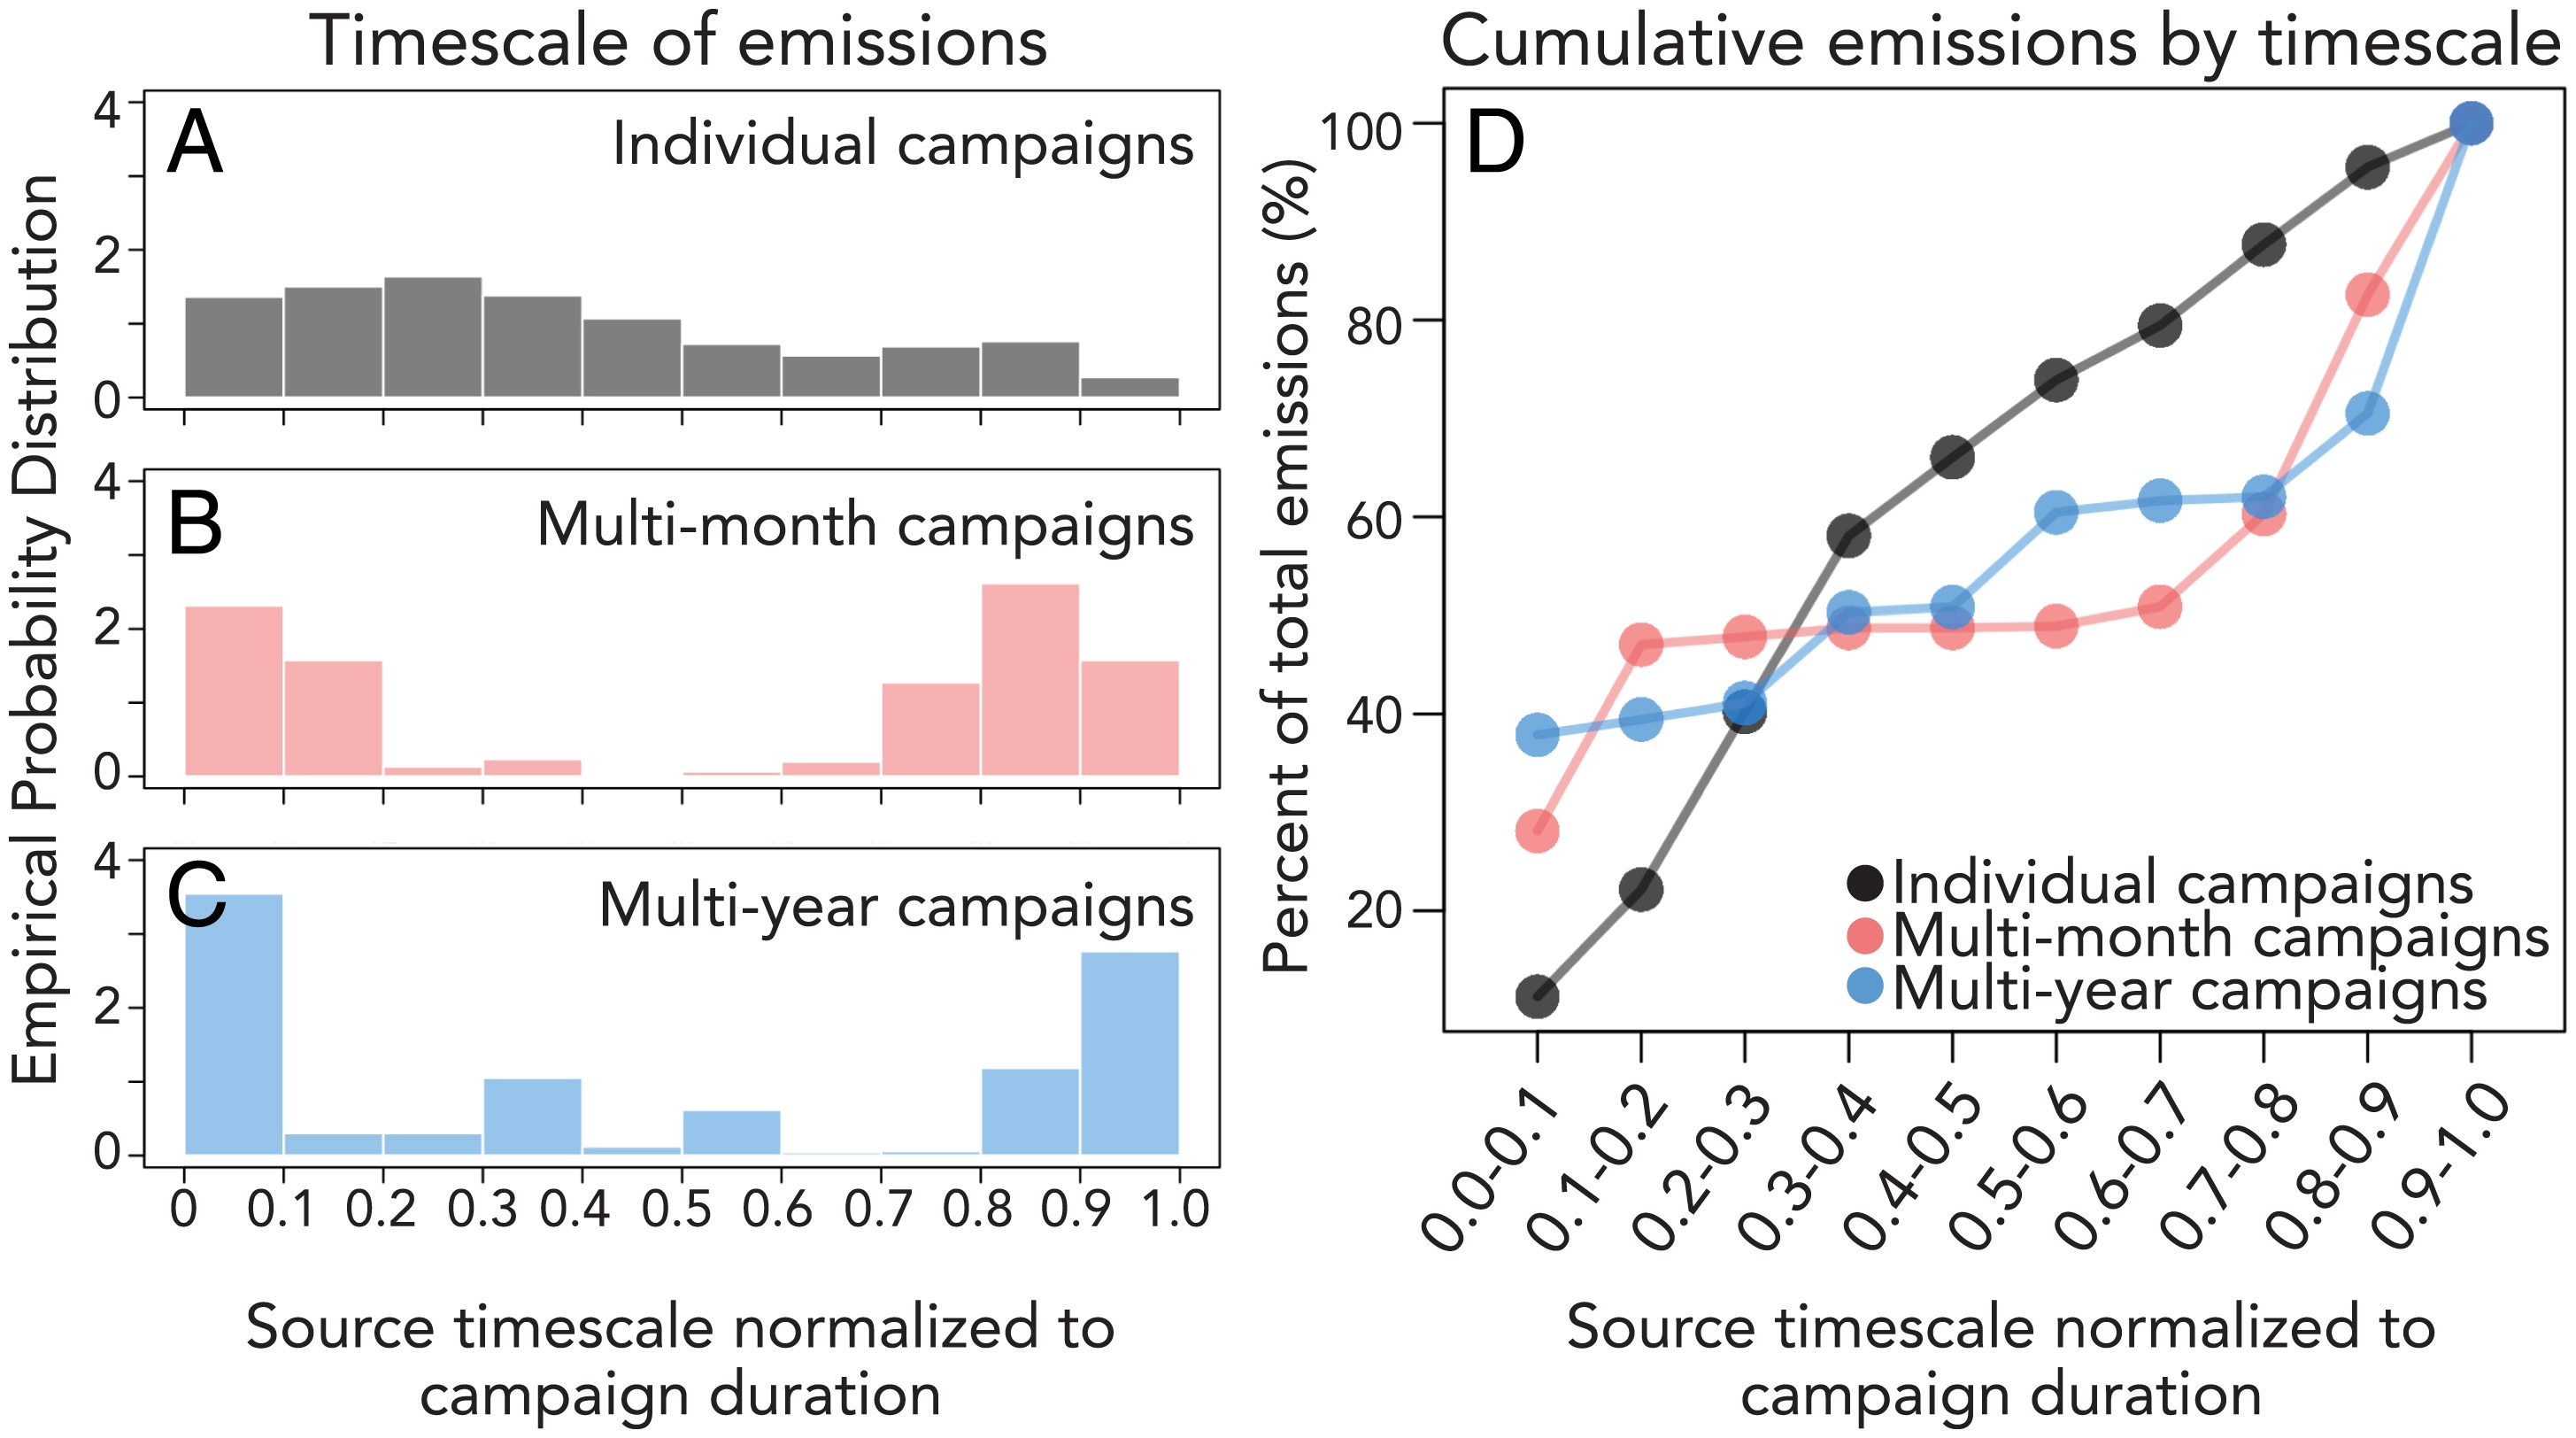
- Multiple surveys of each region revealed a population of both persistent (long-lived) emissions and intermittent (short-lived) emissions, each contributing roughly equally to total emissions. Long-lived sources may be indicative of undetected leaks as well as known, intentional releases (e.g., permitted coal venting). Short-lived sources may be indicative of expected releases (e.g., temporary maintenance) or intermittent malfunctions. Quantifying super-emitter persistence is an important factor for observing system design since infrequent measurements would not be able to distinguish between these modes and potentially over- or under-estimate average emission rates.
- Gathering pipelines made up 23% of point source emissions and were the second largest source of emissions. These pipeline emissions are highly variable in their oil and gas contribution across basins and even within basins over time, suggesting a priority area for greater observation and mitigation.
- In the surveyed area of the Marcellus basin in southwestern Pennsylvania, 58% of the observed methane in the region was attributed to point sources—primarily persistent coal mine ventilation. Coal mine venting in many cases is an expected and permitted operation but it’s important to understand the sector’s impact on regional and national greenhouse gas emissions.
“There is a critical need for persistent, open-source monitoring of methane emissions at local and regional scales around the world to guide mitigation efforts and ensure accurate accounting, particularly given international commitments under the Global Methane Pledge and new policies in the U.S. like methane provisions in the recently enacted Inflation Reduction Act and pending EPA rulemaking,” said Riley Duren, CEO of Carbon Mapper and Research Scientist with the University of Arizona who served as Principal Investigator for a series of NASA-funded projects that culminated in this study. “We look forward to applying the lessons learned from this study as new complementary satellite programs join the expanding global methane monitoring system of systems next year.”
Download the full study at https://www.pnas.org/doi/10.1073/pnas.2202338119.
Contact
- Kelly Vaughn, Carbon Mapper, Kelly@carbonmapper.org, +1-970-401-0001
Study finds super-emitters responsible for nearly 40% of methane emissions in five U.S. basins
Strong methane point sources contribute a disproportionate fraction of total emissions across multiple basins in the United States
ABSTRACT: Understanding, prioritizing, and mitigating methane (CH4) emissions requires quantifying CH4 budgets from facility scales to regional scales with the ability to differentiate between source sectors. We deployed a tiered observing system for multiple basins in the United States (San Joaquin Valley, Uinta, Denver-Julesburg, Permian, Marcellus). We quantify strong point source emissions (>10 kg CH4 h−1) using airborne imaging spectrometers, attribute them to sectors, and assess their intermittency with multiple revisits. We compare these point source emissions to total basin CH4 fluxes derived from inversion of Sentinel-5p satellite CH4 observations. Across basins, point sources make up on average 40% of the regional flux. We sampled some basins several times across multiple months and years and find a distinct bimodal structure to emission timescales: the total point source budget is split nearly in half by short-lasting and long-lasting emission events. With the increasing airborne and satellite observing capabilities planned for the near future, tiered observing systems will more fully quantify and attribute CH4 emissions from facility to regional scales, which is needed to effectively and efficiently reduce methane emissions.
SIGNIFICANCE: Large methane point sources exist across multiple source sectors (e.g., oil, gas, coal, livestock, waste). Lacking is a robust assessment of the relative contribution of strong methane point sources against total or regional budgets, which is needed for prioritizing mitigation. In this study, we flew airborne imaging spectrometers repeatedly over multiple basins in the United States to quantify large methane point sources across multiple sectors. We compared these point sources to satellite-based regional flux inversions and found that methane super-emitters consistently make up a sizable contribution to total the total flux in a basin. These results show that a significant climate benefit can be realized by specific isolation and remediation of relatively few sources.