Components of the global carbon budget and their uncertainties, 1960-2021 and projected to 2022. Components are presented individually for (a) fossil CO2 and cement carbonation emissions (EFOS), (b) growth rate in atmospheric CO2 concentration (GATM), (c) emissions from land-use change (ELUC), (d) the land CO2 sink (SLAND), (e) the ocean CO2 sink (SOCEAN), and (f) the budget imbalance that is not accounted for by the other terms. Positive values of SLAND and SOCEAN represent a flux from the atmosphere to land or the ocean. All data are in GtC yr−1 with the uncertainty bounds representing ±1 standard deviation in shaded colour. Data sources are as in Fig. 3. The red dots indicate our projections for the year 2022, and the red error bars the uncertainty in the projections. Graphic: Friedlingstein, et al., 2022 / Earth System Science Data
Components of the global carbon budget and their uncertainties as a function of time, presented individually for (a) fossil CO2 and cement carbonation emissions (EFOS), (b) growth rate in atmospheric CO2 concentration (GATM), (c) emissions from land-use change (ELUC), (d) the land CO2 sink (SLAND), (e) the ocean CO2 sink (SOCEAN), and (f) the budget imbalance that is not accounted for by the other terms. Positive values of SLAND and SOCEAN represent a flux from the atmosphere to land or the ocean. All data are in GtC yr−1 with the uncertainty bounds representing ±1 standard deviation in shaded colour. The red dots indicate our projections for the year 2022, and the red error bars the uncertainty in the projections. Graphic: Friedlingstein, et al., 2022 / Earth System Science Data

11 November 2022 (Global Carbon Project) – Global carbon emissions in 2022 remain at record levels – with no sign of the decrease that is urgently needed to limit warming to 1.5°C, according to the Global Carbon Project science team (Global Carbon Budget 2022).

If current emissions levels persist, there is now a 50% chance that global warming of 1.5°C will be exceeded in nine years.

The new report projects total global CO2 emissions of 40.6 billion tonnes (GtCO2) in 2022. This is fuelled by fossil CO2 emissions which are projected to rise 1.0% compared to 2021, reaching 36.6 GtCO2 – slightly above the 2019 pre-COVID-19 levels. Emissions from land-use change (such as deforestation) are projected to be 3.9 GtCO2 in 2022.

To reach zero CO2 emissions by 2050 would now require a decrease of about 1.4 GtCO2 each year, comparable to the observed fall in 2020 emissions resulting from COVID-19 lockdowns, highlighting the scale of the action required.

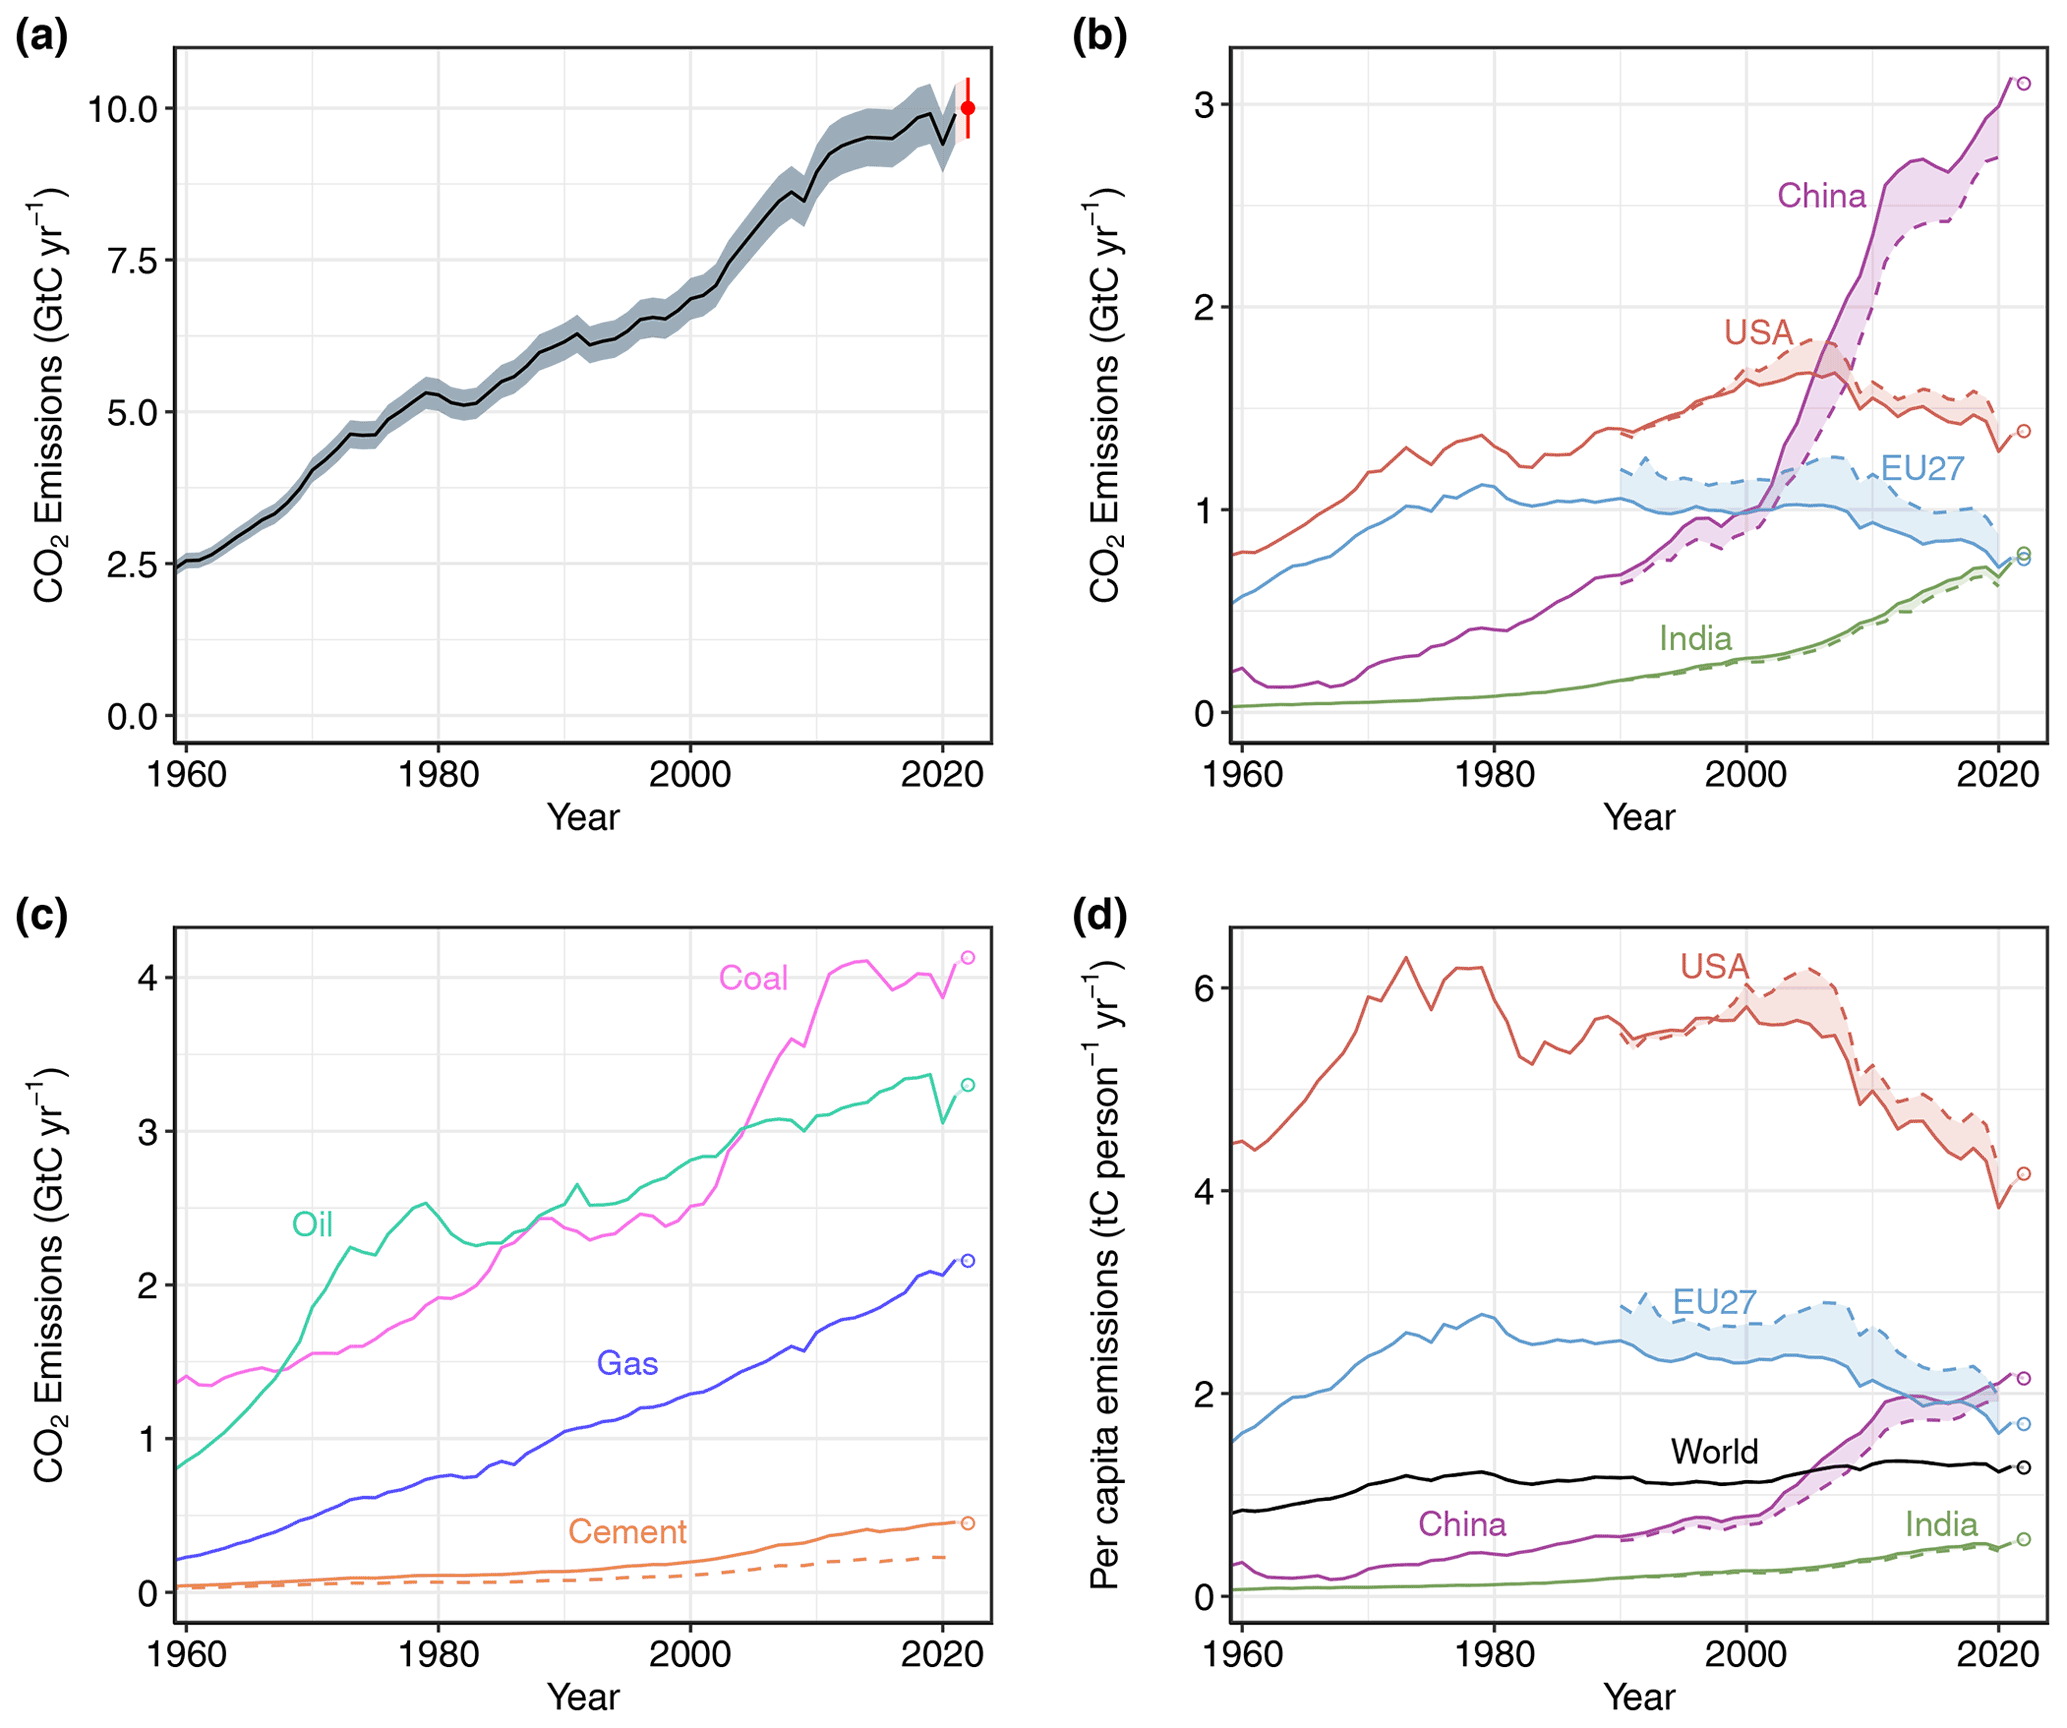
Projected emissions from coal and oil are above their 2021 levels, with oil being the largest contributor to total emissions growth. The growth in oil emissions can be largely explained by the delayed rebound of international aviation following COVID-19 pandemic restrictions.

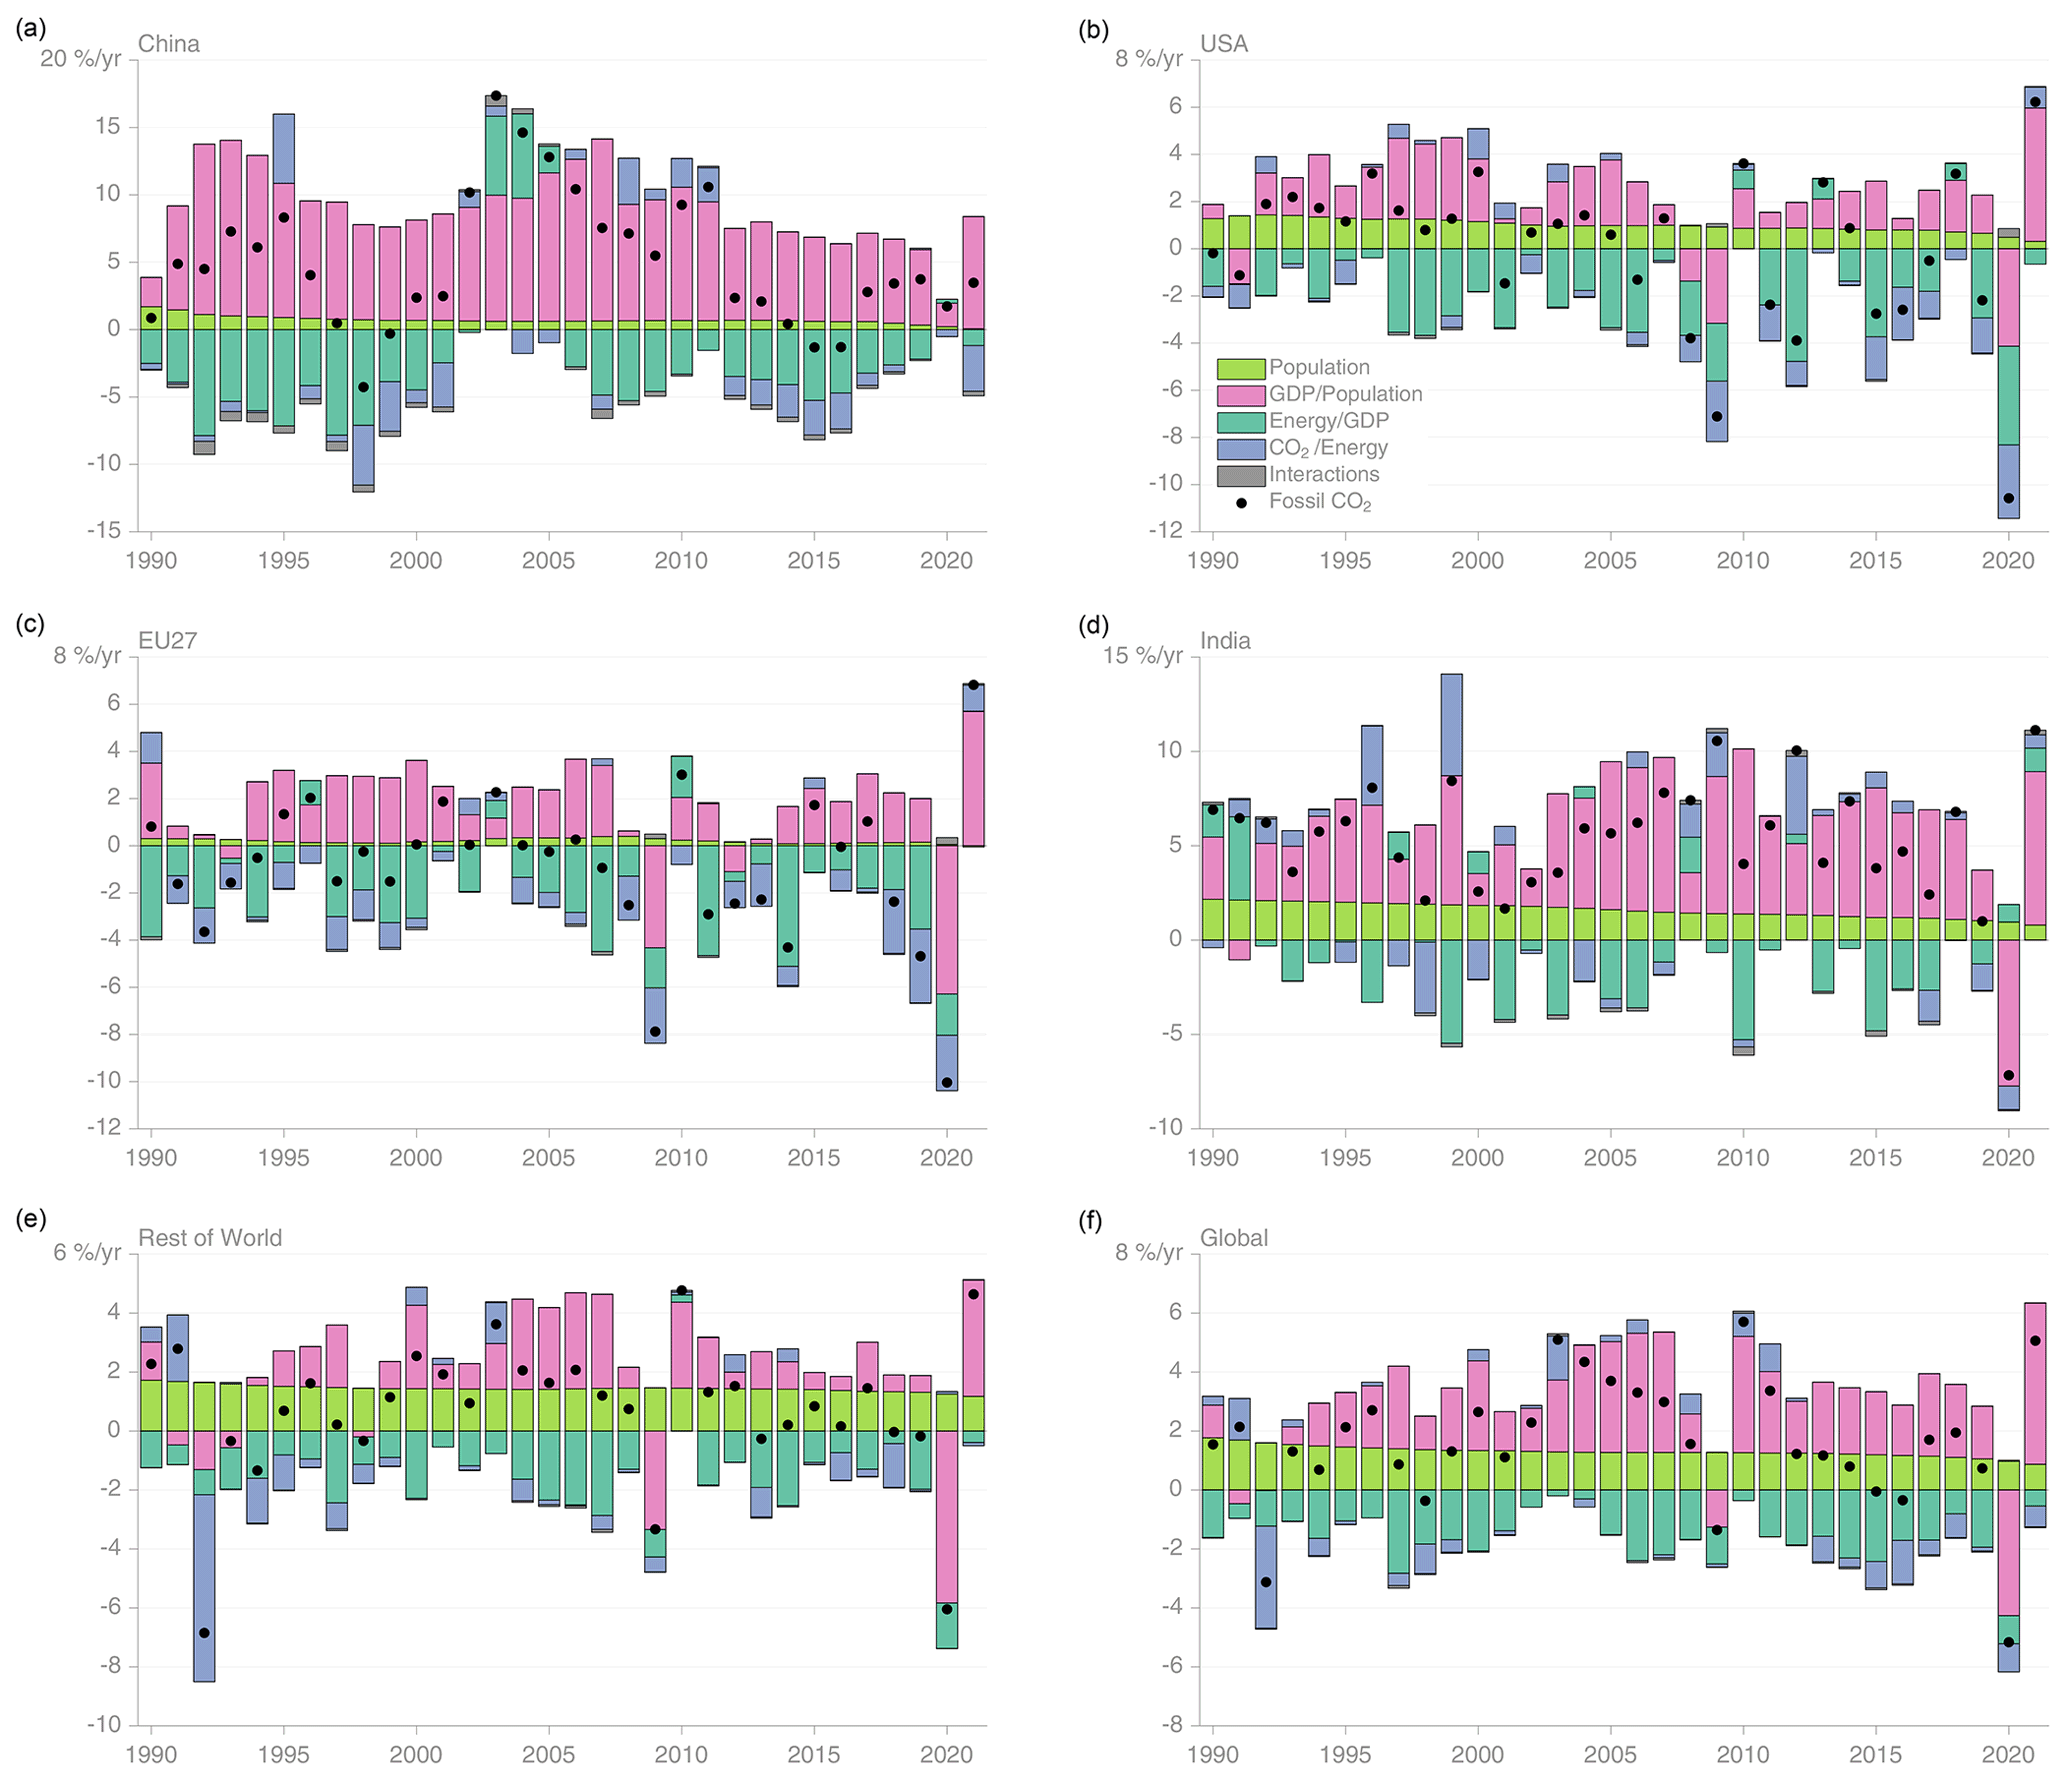
The 2022 picture among major emitters is mixed: emissions are projected to fall in China (0.9%) and the EU (0.8%), and increase in the USA (1.5%) and India (6%), with a 1.7% rise in the rest of the world combined.

The remaining carbon budget for a 50% likelihood to limit global warming to 1.5°C has reduced to 380 GtCO2 (exceeded after nine years if emissions remain at 2022 levels) and 1230 GtCO2 to limit to 2°C (30 years at 2022 emissions levels).

Fossil CO2 emissions for (a) the globe, including an uncertainty of ± 5 % (grey shading) and a projection through the year 2022 (red dot and uncertainty range); (b) territorial (solid lines) and consumption (dashed lines) emissions for the top three country emitters (USA, China, India) and for the European Union (EU27); (c) global emissions by fuel type, including coal, oil, gas, cement, and cement minus cement carbonation (dashed); and (d) per capita emissions for the world and for the large emitters, as in panel (b). Territorial emissions are primarily from a draft update of Gilfillan and Marland (2021), with the exception of the national data for Annex I countries for 1990-2020, which are reported to the UNFCCC as detailed in the text, as well as some improvements in individual countries, and are extrapolated forward to 2021 using BP Energy Statistics. Consumption-based emissions are updated from Peters et al., 2011b. Graphic: Friedlingstein, et al., 2022 / Earth System Science Data

To reach zero CO2 emissions by 2050 would now require a decrease of about 1.4 GtCO2 each year, comparable to the observed fall in 2020 emissions resulting from COVID-19 lockdowns, highlighting the scale of the action required.

Land and ocean, which absorb and store carbon, continue to take up around half of the CO2 emissions. The ocean and land CO2 sinks are still increasing in response to the atmospheric CO2 increase, although climate change reduced this growth by an estimated 4% (ocean sink) and 17% (land sink) over the 2012-2021 decade.

This year’s carbon budget shows that the long-term rate of increasing fossil emissions has slowed. The average rise peaked at +3% per year during the 2000s, while growth in the last decade has been about +0.5% per year.

The research team – including the University of Exeter, the University of East Anglia (UEA), CICERO and Ludwig-Maximilian-University Munich – welcomed this slow-down, but said it was “far from the emissions decrease we need”.

Kaya decomposition of the main drivers of fossil CO2 emissions, 1990-2021, considering population, GDP per person, energy per GDP, and CO2 emissions per energy, for China (a), the USA (b), the EU27 (c), India (d), the rest of the world (e), and the world (f). Black dots are the annual fossil CO2 emissions growth rate, coloured bars are the contributions from the different drivers. A general trend is that population and GDP growth put upward pressure on emissions, while energy per GDP and more recently CO2 emissions per energy put downward pressure on emissions. Both the COVID-19-induced changes during 2020 and the recovery in 2021 led to a stark contrast to previous years, with different drivers in each region. Graphic: Friedlingstein, et al., 2022 / Earth System Science Data

The findings come as world leaders meet at COP27 in Egypt to discuss the climate crisis.

“This year we see yet another rise in global fossil CO2 emissions, when we need a rapid decline,” said Professor Pierre Friedlingstein, of Exeter’s Global Systems Institute, who led the study.

“There are some positive signs, but leaders meeting at COP27 will have to take meaningful action if we are to have any chance of limiting global warming close to 1.5°C. The Global Carbon Budget numbers monitor the progress on climate action and right now we are not seeing the action required.”

Professor Corinne Le Quéré, Royal Society Research Professor at UEA’s School of Environmental Sciences, said: “Our findings reveal turbulence in emissions patterns this year resulting from the pandemic and global energy crises.

“If governments respond by turbo charging clean energy investments and planting, not cutting, trees, global emissions could rapidly start to fall.

“We are at a turning point and must not allow world events to distract us from the urgent and sustained need to cut our emissions to stabilise the global climate and reduce cascading risks.”

Map showing the 2012-2021 decadal mean components of the global carbon budget, presented for (a) fossil CO2 emissions (EFOS), (b) land-use change emissions (ELUC), (c) the ocean CO2 sink (SOCEAN), and (d) the land CO2 sink (SLAND). Positive values for EFOS and ELUC represent a flux to the atmosphere, whereas positive values of SOCEAN and SLAND represent a flux from the atmosphere to the ocean or the land. In all panels, yellow and red (green and blue) colours represent a flux from (into) the land and ocean to (from) the atmosphere. All units are in kgC m-2 yr-1. Note the different scales in each panel. EFOS data shown is from GCP-GridFEDv2022.2. ELUC data shown are only from BLUE as the updated H&N2017 and OSCAR do not resolve gridded fluxes. SOCEAN data shown are the average of GOBMs and data product means using GOBM simulation A with no adjustment for bias or drift applied to the gridded fields. SLAND data shown are the average of DGVMs for simulation S2. Graphic: Friedlingstein, et al., 2022 / Earth System Science Data
The 2012–2021 decadal mean components of the global carbon budget, presented for (a) fossil CO2 emissions (EFOS), (b) land-use change emissions (ELUC), (c) the ocean CO2 sink (SOCEAN), and (d) the land CO2 sink (SLAND). Positive values for EFOS and ELUC represent a flux to the atmosphere, whereas positive values of SOCEAN and SLAND represent a flux from the atmosphere to the ocean or the land. In all panels, yellow and red (green and blue) colours represent a flux from (into) the land and ocean to (from) the atmosphere. All units are in kgC m−2 yr−1. Note the different scales in each panel. EFOS data shown is from GCP-GridFEDv2022.2. ELUC data shown are only from BLUE as the updated H&N2017 and OSCAR do not resolve gridded fluxes. SOCEAN data shown are the average of GOBMs and data product means using GOBM simulation A with no adjustment for bias or drift applied to the gridded fields (see Sect. 2.4). SLAND data shown are the average of DGVMs for simulation S2. Graphic: Friedlingstein, et al., 2022 / Earth System Science Data

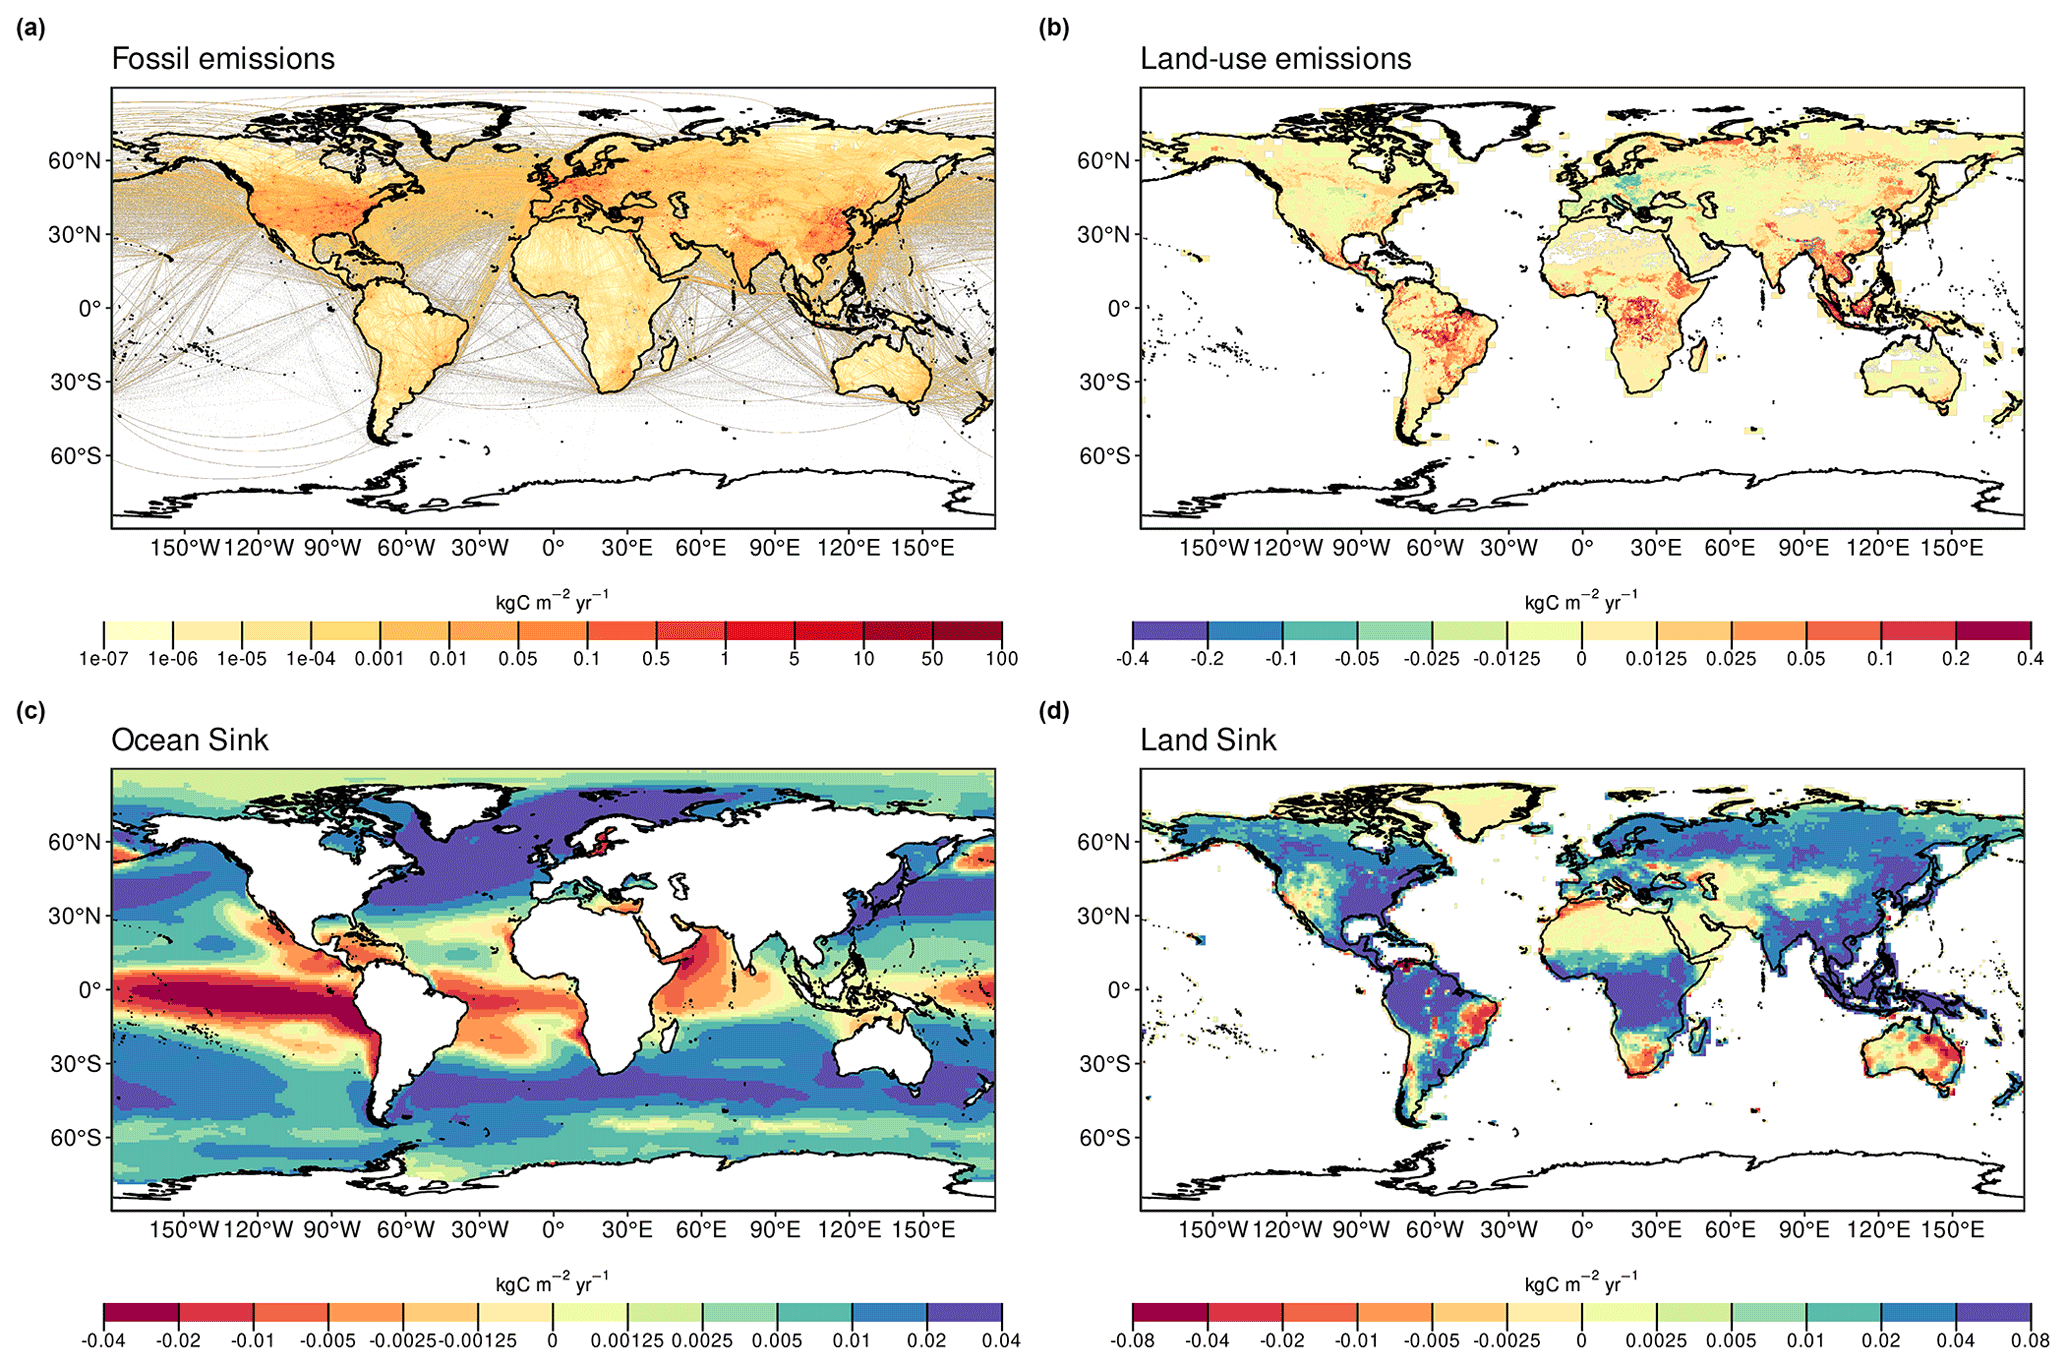
Land-use changes, especially deforestation, are a significant source of CO2 emissions (about a tenth of the amount from fossil emissions). Indonesia, Brazil and the Democratic Republic of the Congo contribute 58% of global land-use change emissions.

Carbon removal via reforestation or new forests counterbalances half of the deforestation emissions, and the researchers say that stopping deforestation and increasing efforts to restore and expand forests constitutes a large opportunity to reduce emissions and increase removals in forests. The Global Carbon Budget report projects that atmospheric CO2 concentrations will reach an average of 417.2 parts per million in 2022, more than 50% above pre-industrial levels.

The projection of 40.6 GtCO2 total emissions in 2022 is close to the 40.9 GtCO2 in 2019, which is the highest annual total ever.

The Global Carbon Budget report, produced by an international team of more than 100 scientists, examines both carbon sources and sinks. It provides an annual, peer-reviewed update, building on established methodologies in a fully transparent manner. The 2022 edition (the 17th annual report) is online here: https://doi.org/10.5194/essd-14-4811-2022.

Data availability

All material, publications, data, figures (including by country), are available on the
following link: https://drive.google.com/drive/u/0/folders/1JL0ukEVVYQsiuCma5hRN7L0iXiZ5vW0F
Global Carbon Atlas: http://emissions2020.globalcarbonatlas.org
User name: media
Password: fromxLSCEx2021

No sign of decrease in global CO2 emissions


Combined components of the global carbon budget illustrated in Fig. 2 as a function of time for fossil CO2 emissions (EFOS, including a small sink from cement carbonation; grey) and emissions from land-use change (ELUC; brown), as well as their partitioning among the atmosphere (GATM; cyan), ocean (SOCEAN; blue), and land (SLAND; green). Panel (a) shows annual estimates of each flux, and panel (b) shows the cumulative flux (the sum of all prior annual fluxes) since the year 1850. The partitioning is based on nearly independent estimates from observations (for GATM) and from process model ensembles constrained by data (for SOCEAN and SLAND) and does not exactly add up to the sum of the emissions, resulting in a budget imbalance (BIM), which is represented by the difference between the bottom red line (mirroring total emissions) and the sum of carbon fluxes in the ocean, land, and atmosphere reservoirs. All data are in GtC yr−1 (a) and GtC (b). The EFOS estimate is based on a mosaic of different data sets and has an uncertainty of ±5 % (±1σ). The ELUC estimate is from three bookkeeping models (Table 4) with uncertainty of ±0.7 GtC yr−1. The GATM estimates prior to 1959 are from Joos and Spahni (2008) with uncertainties equivalent to about ±0.1–0.15 GtC yr−1 and from Dlugokencky and Tans (2022) since 1959 with uncertainties of about +-0.07 GtC yr−1 during 1959–1979 and ± 0.02 GtC yr−1 since 1980. The SOCEAN estimate is the average from Khatiwala et al. (2013) and DeVries (2014) with uncertainty of about ±30 % prior to 1959, and the average of an ensemble of models and an ensemble of fCO2 data products (Table 4) with uncertainties of about ±0.4 GtC yr−1 since 1959. The SLAND estimate is the average of an ensemble of models (Table 4) with uncertainties of about ±1 GtC yr−1. See the text for more details of each component and their uncertainties. Graphic: Friedlingstein, et al., 2022 / Earth System Science Data
Combined components of the global carbon budget illustrated in Fig. 2 as a function of time for fossil CO2 emissions (EFOS, including a small sink from cement carbonation; grey) and emissions from land-use change (ELUC; brown), as well as their partitioning among the atmosphere (GATM; cyan), ocean (SOCEAN; blue), and land (SLAND; green). Panel (a) shows annual estimates of each flux, and panel (b) shows the cumulative flux (the sum of all prior annual fluxes) since the year 1850. The partitioning is based on nearly independent estimates from observations (for GATM) and from process model ensembles constrained by data (for SOCEAN and SLAND) and does not exactly add up to the sum of the emissions, resulting in a budget imbalance (BIM), which is represented by the difference between the bottom red line (mirroring total emissions) and the sum of carbon fluxes in the ocean, land, and atmosphere reservoirs. All data are in GtC yr−1 (a) and GtC (b). The EFOS estimate is based on a mosaic of different data sets and has an uncertainty of ±5 % (±1σ). The ELUC estimate is from three bookkeeping models (Table 4) with uncertainty of ±0.7 GtC yr−1. The GATM estimates prior to 1959 are from Joos and Spahni (2008) with uncertainties equivalent to about ±0.1–0.15 GtC yr−1 and from Dlugokencky and Tans (2022) since 1959 with uncertainties of about +-0.07 GtC yr−1 during 1959–1979 and ± 0.02 GtC yr−1 since 1980. The SOCEAN estimate is the average from Khatiwala, et al. (2013) and DeVries (2014) with uncertainty of about ±30 % prior to 1959, and the average of an ensemble of models and an ensemble of fCO2 data products (Table 4) with uncertainties of about ±0.4 GtC yr−1 since 1959. The SLAND estimate is the average of an ensemble of models (Table 4) with uncertainties of about ±1 GtC yr−1. See the text for more details of each component and their uncertainties. Graphic: Friedlingstein, et al., 2022 / Earth System Science Data

Global Carbon Budget 2022

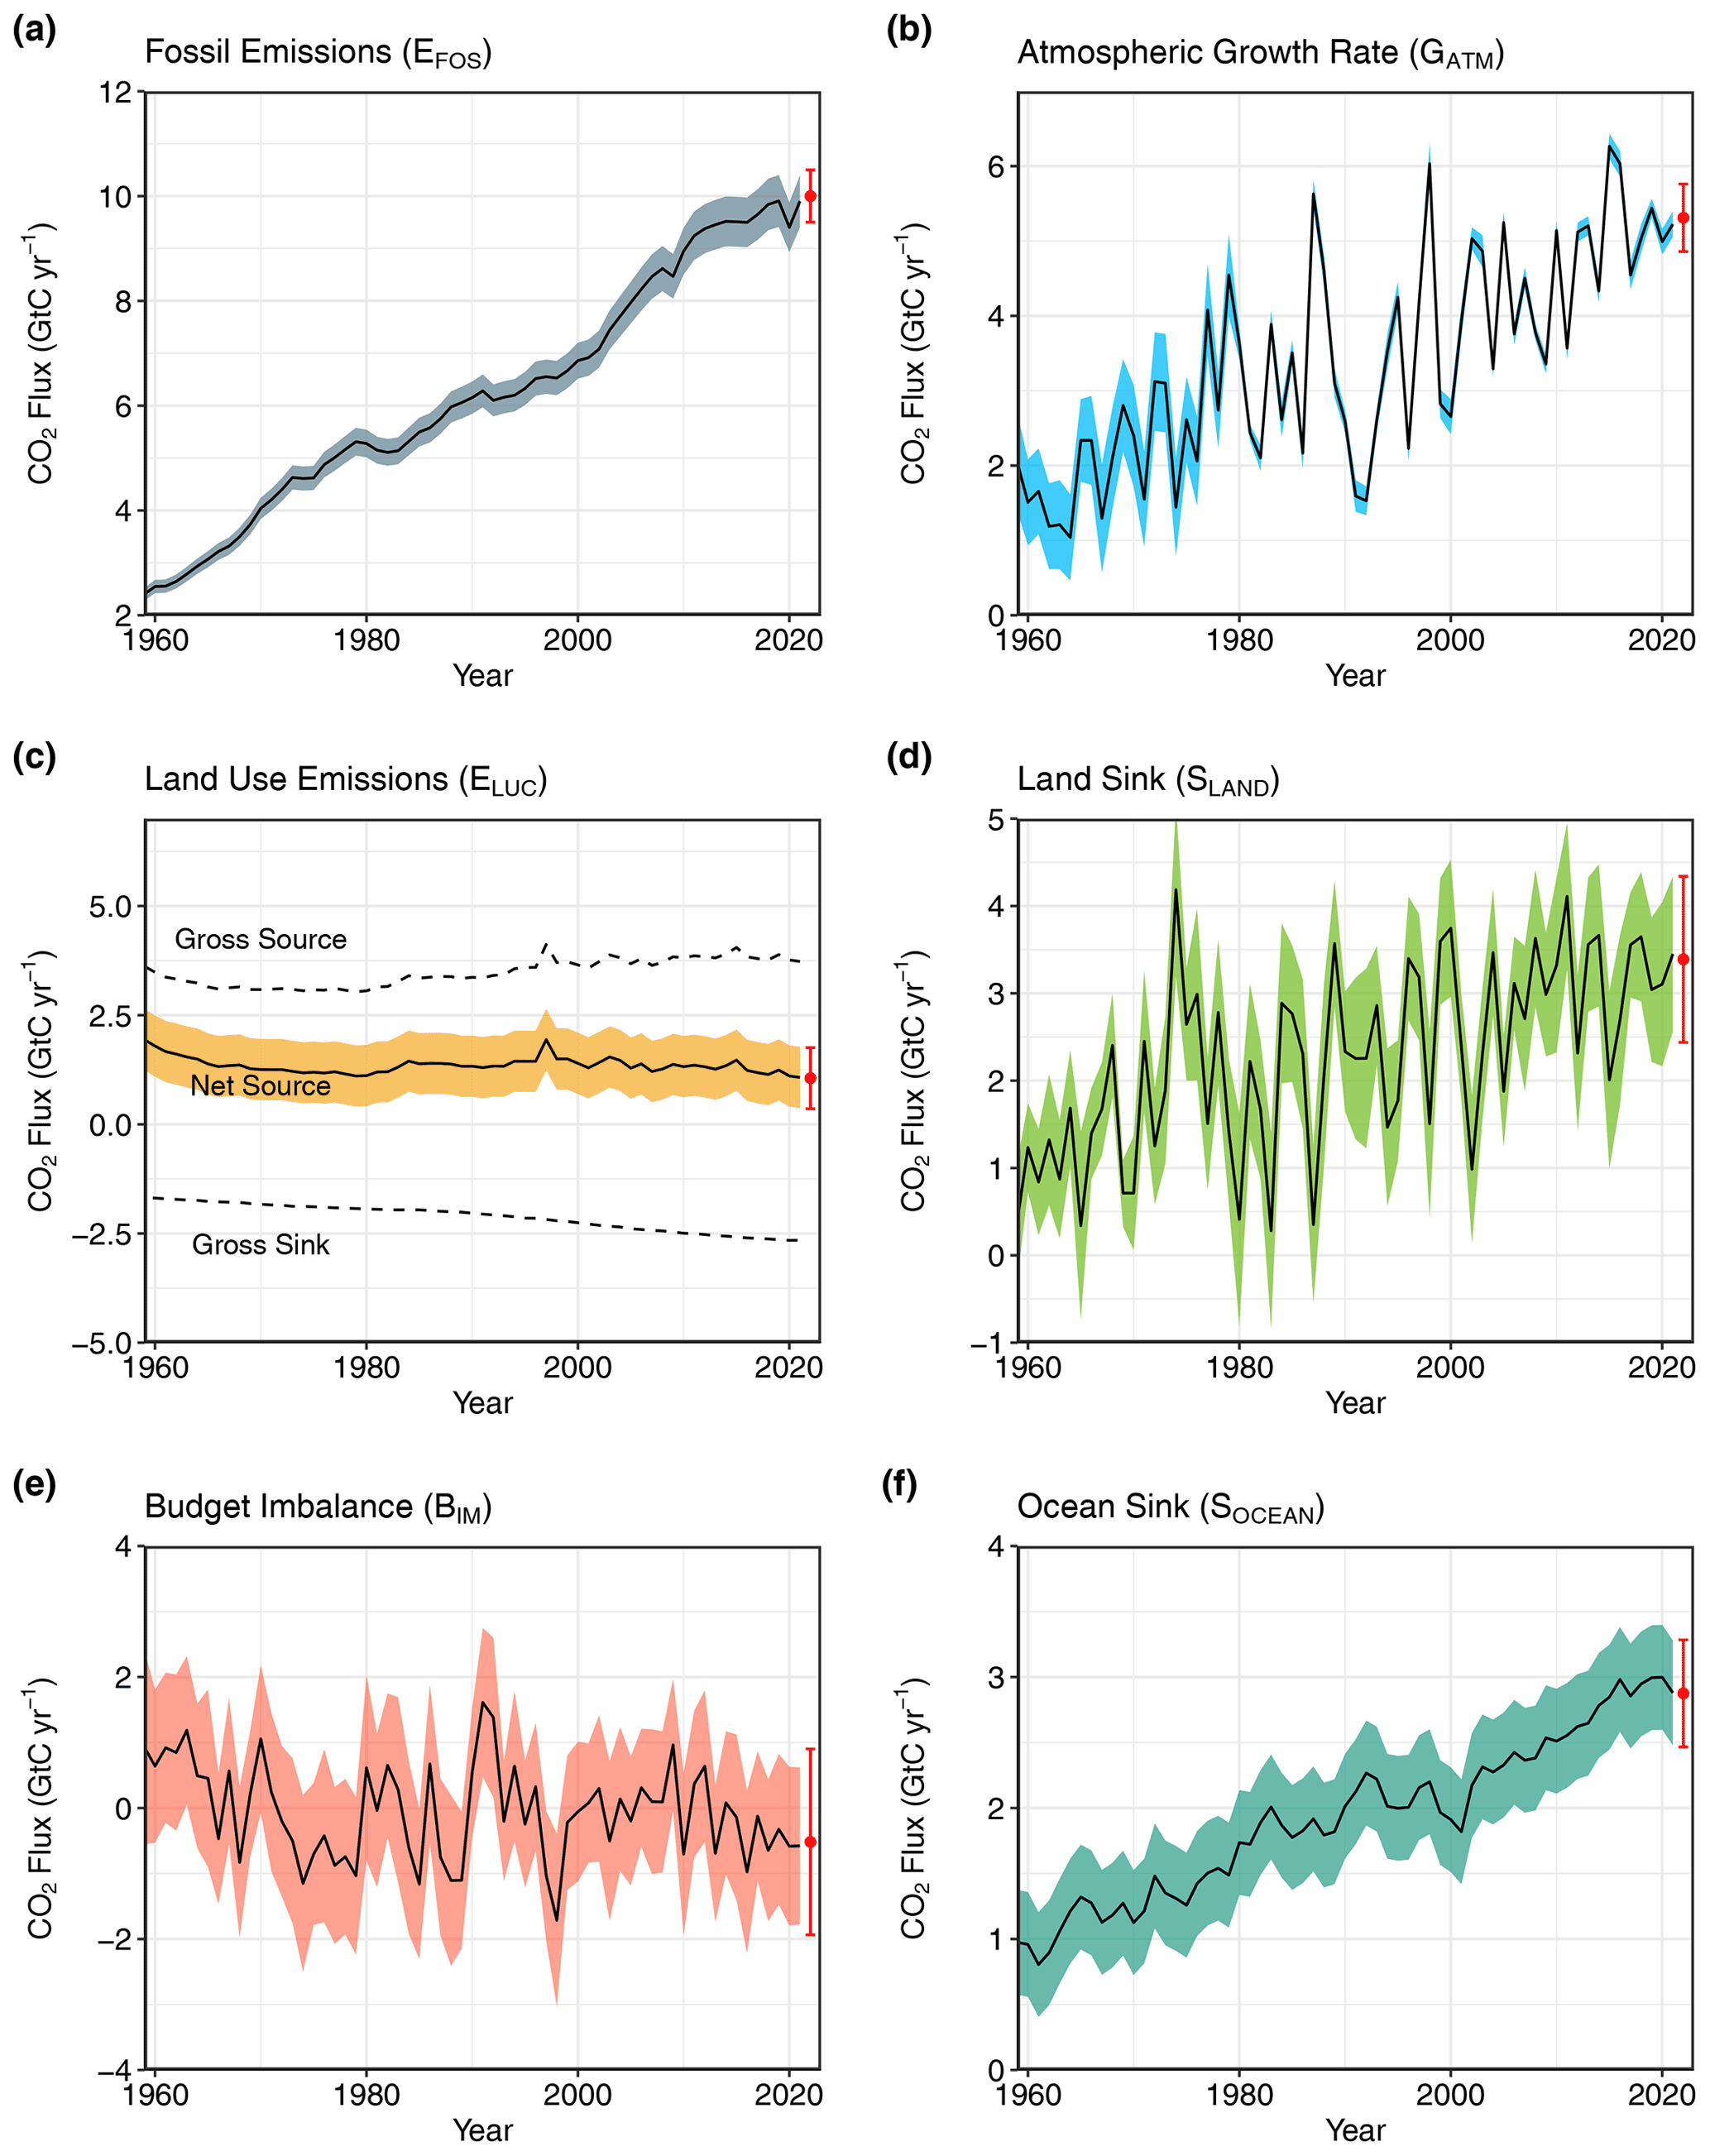
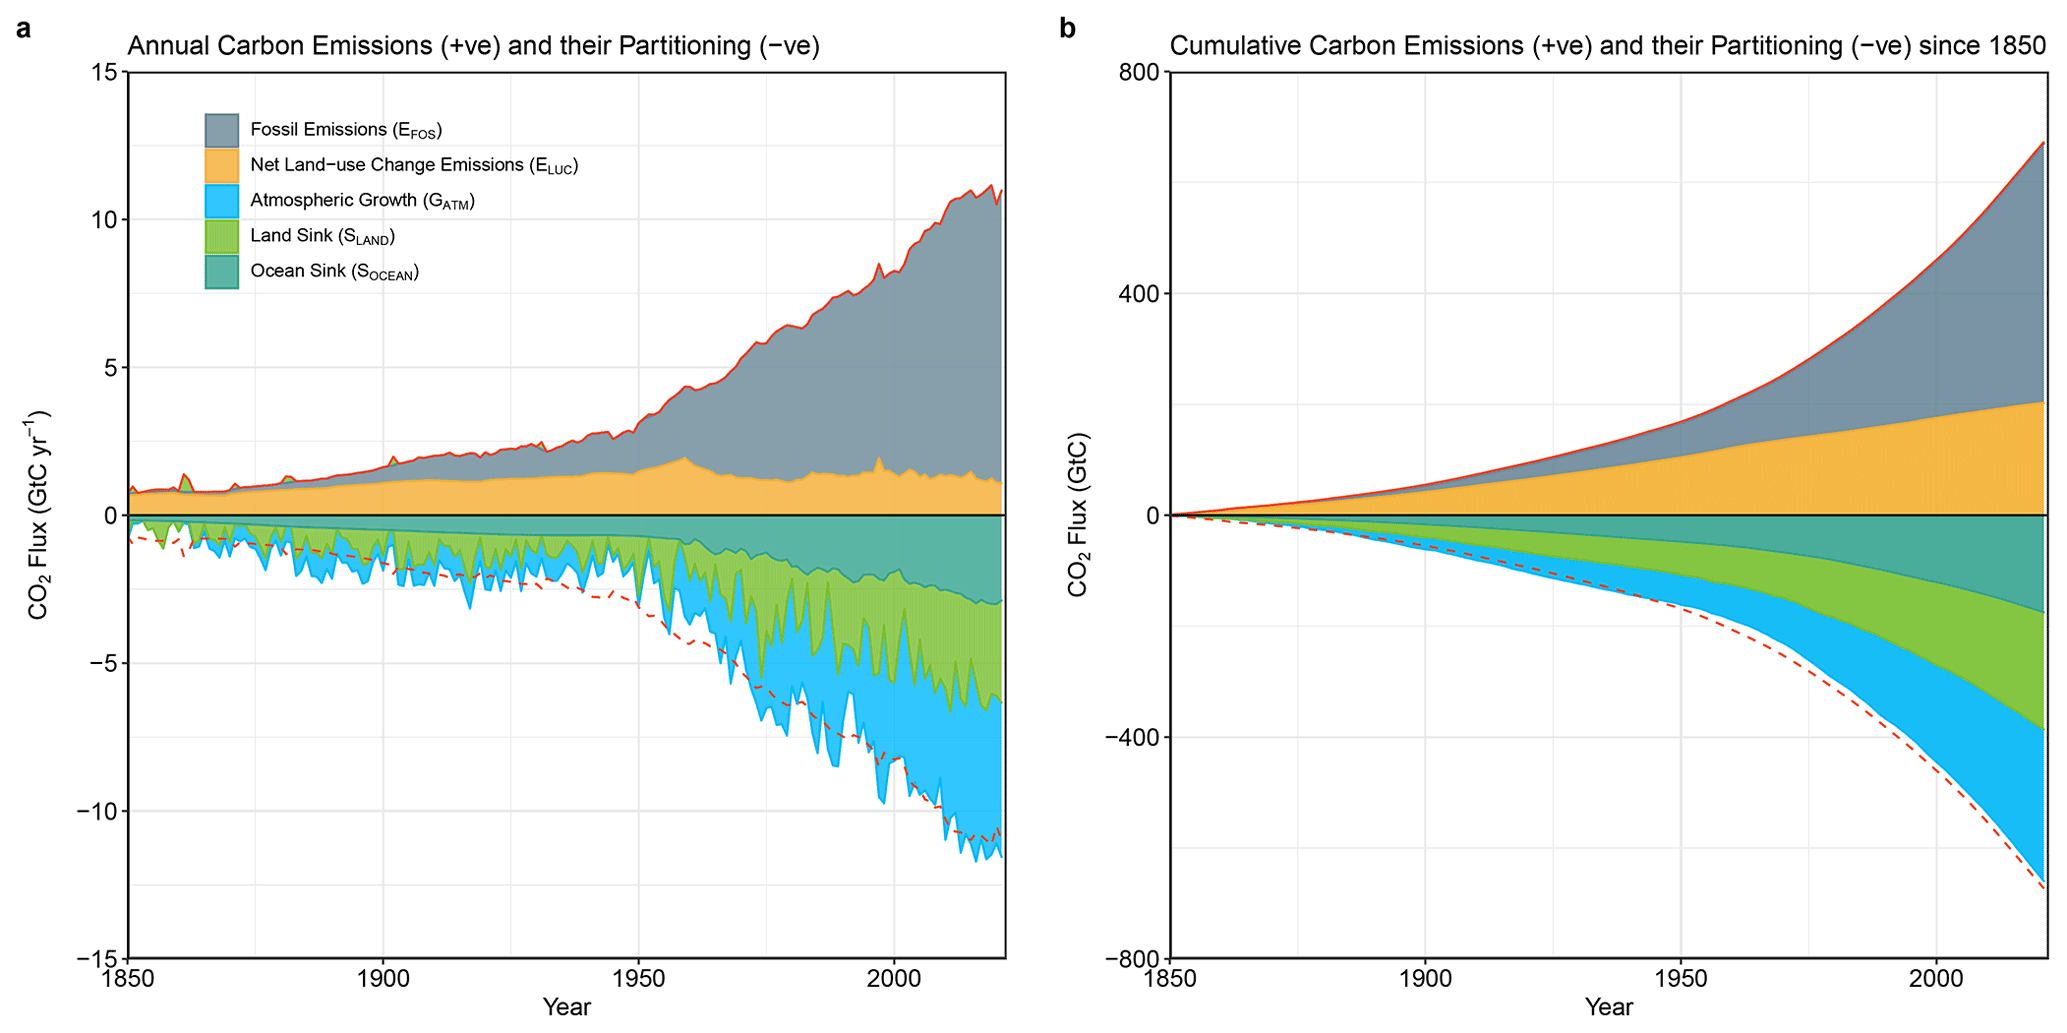
ABSTRACT: Accurate assessment of anthropogenic carbon dioxide (CO2) emissions and their redistribution among the atmosphere, ocean, and terrestrial biosphere in a changing climate is critical to better understand the global carbon cycle, support the development of climate policies, and project future climate change. Here we describe and synthesize data sets and methodologies to quantify the five major components of the global carbon budget and their uncertainties. Fossil CO2 emissions (EFOS) are based on energy statistics and cement production data, while emissions from land-use change (ELUC), mainly deforestation, are based on land use and land-use change data and bookkeeping models. Atmospheric CO2 concentration is measured directly, and its growth rate (GATM) is computed from the annual changes in concentration. The ocean CO2 sink (SOCEAN) is estimated with global ocean biogeochemistry models and observation-based data products. The terrestrial CO2 sink (SLAND) is estimated with dynamic global vegetation models. The resulting carbon budget imbalance (BIM), the difference between the estimated total emissions and the estimated changes in the atmosphere, ocean, and terrestrial biosphere, is a measure of imperfect data and understanding of the contemporary carbon cycle. All uncertainties are reported as ±1σ.

For the year 2021, EFOS increased by 5.1 % relative to 2020, with fossil emissions at 10.1 ± 0.5 GtC yr−1 (9.9 ± 0.5 GtC yr−1 when the cement carbonation sink is included), and ELUC was 1.1 ± 0.7 GtC yr−1, for a total anthropogenic CO2 emission (including the cement carbonation sink) of 10.9 ± 0.8 GtC yr−1 (40.0 ± 2.9 GtCO2). Also, for 2021, GATM was 5.2 ± 0.2 GtC yr−1 (2.5 ± 0.1 ppm yr−1), SOCEAN was 2.9  ± 0.4 GtC yr−1, and SLAND was 3.5 ± 0.9 GtC yr−1, with a BIM of −0.6 GtC yr−1 (i.e., the total estimated sources were too low or sinks were too high). The global atmospheric CO2 concentration averaged over 2021 reached 414.71 ± 0.1 ppm. Preliminary data for 2022 suggest an increase in EFOS relative to 2021 of +1.0 % (0.1 % to 1.9 %) globally and atmospheric CO2 concentration reaching 417.2 ppm, more than 50 % above pre-industrial levels (around 278 ppm). Overall, the mean and trend in the components of the global carbon budget are consistently estimated over the period 1959–2021, but discrepancies of up to 1 GtC yr−1 persist for the representation of annual to semi-decadal variability in CO2 fluxes. Comparison of estimates from multiple approaches and observations shows (1) a persistent large uncertainty in the estimate of land-use change emissions, (2) a low agreement between the different methods on the magnitude of the land CO2 flux in the northern extratropics, and (3) a discrepancy between the different methods on the strength of the ocean sink over the last decade. This living data update documents changes in the methods and data sets used in this new global carbon budget and the progress in understanding of the global carbon cycle compared with previous publications of this data set. The data presented in this work are available at https://doi.org/10.18160/GCP-2022 (Friedlingstein, et al., 2022b).

Global Carbon Budget 2022