January 12, 2022
Graph of the Day: Atmospheric CO2 vs. global temperature change and climate conference dates, 1958-2020
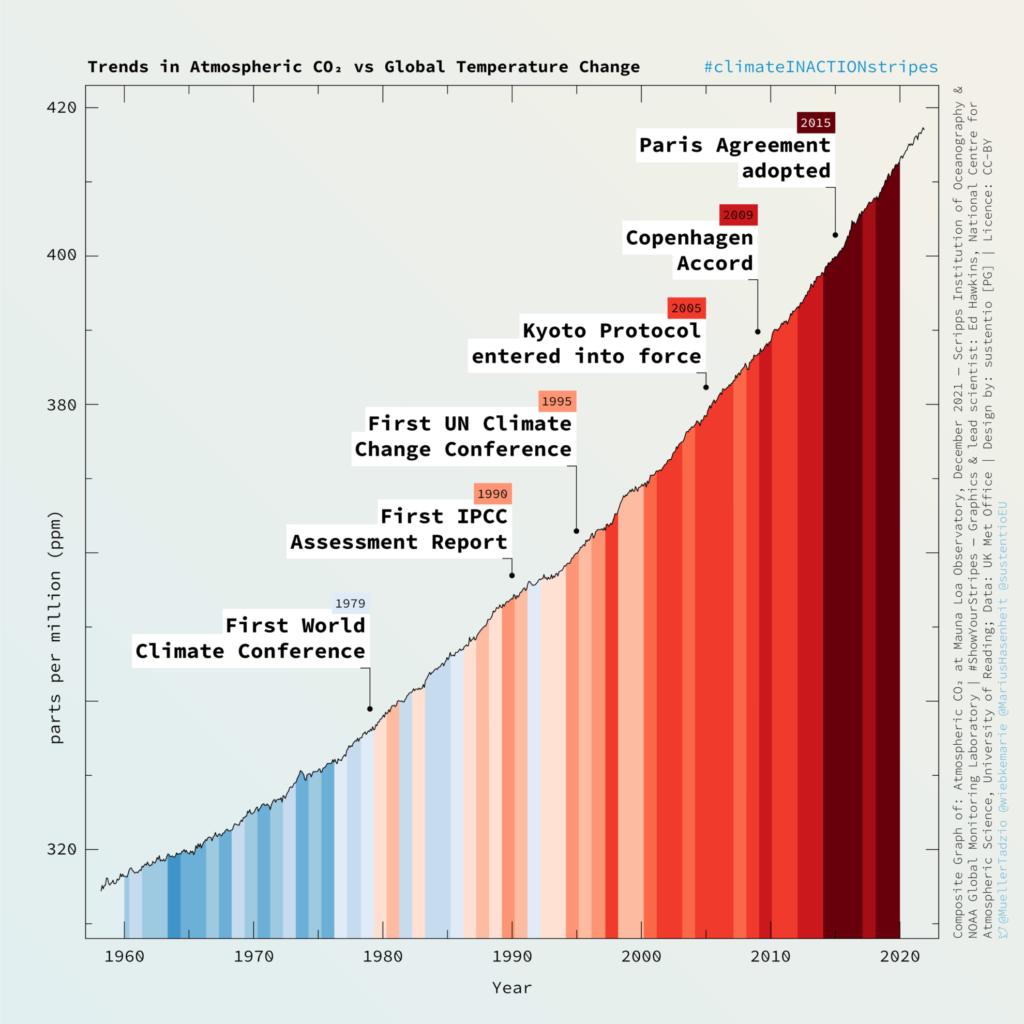
10 January 2022 (Sustentio) – Climate conferences? All well and good, but what we need is action! Peter Gericke, Marius Hasenheit from Sustentio, together with Tadzio Müller and Wiebke Witt, have visualized international climate diplomacy, the increase in CO2 concentration, and heating of our planet. And thus landed a huge success on Twitter: More than 1000 retweets and shares by Greta Thunberg, among others, speak for themselves.
We have published the graphic under CC-BY. Sources used:
Download
- PNG versions
- Original files (AI, PSD, PDF)
Attribution/Reference: @MuellerTadzio, @wiebkemarie, @MariusHasenheit, @sustentioEU [PG]