WWF’s Living Planet Report 2022 reveals devastating 69 percent average drop in wildlife populations since 1970 – “We have cut away the very foundation of life and the situation continues to worsen”
TORONTO, 12 October 2022 (WWF-Canada) – Monitored wildlife populations — mammals, birds, amphibians, reptiles, and fish — have seen a devastating 69 per cent drop on average since 1970 according to WWF’s Living Planet Report (LPR) 2022. The report highlights the stark outlook of the state of nature and urgently warns governments, businesses and the public to take transformative action to reverse the destruction of biodiversity.
The LPR found that populations of species in North America declined by an average of 20 per cent between 1970 and 2018, and while this decline is not as steep as other regions, it does not mean that Canada is safe from catastrophic losses. In fact, the Living Planet Report Canada 2020 showed that species of global conservation concern — assessed as threatened on the IUCN Red List — declined in Canada by 42%, on average, from 1970–2016.
With its biggest dataset yet, featuring almost 32,000 populations of 5,230 species, the Living Planet Index (LPI), provided within the report by ZSL (Zoological Society of London), shows it is within tropical regions that monitored vertebrate wildlife populations are plummeting at a particularly staggering rate.
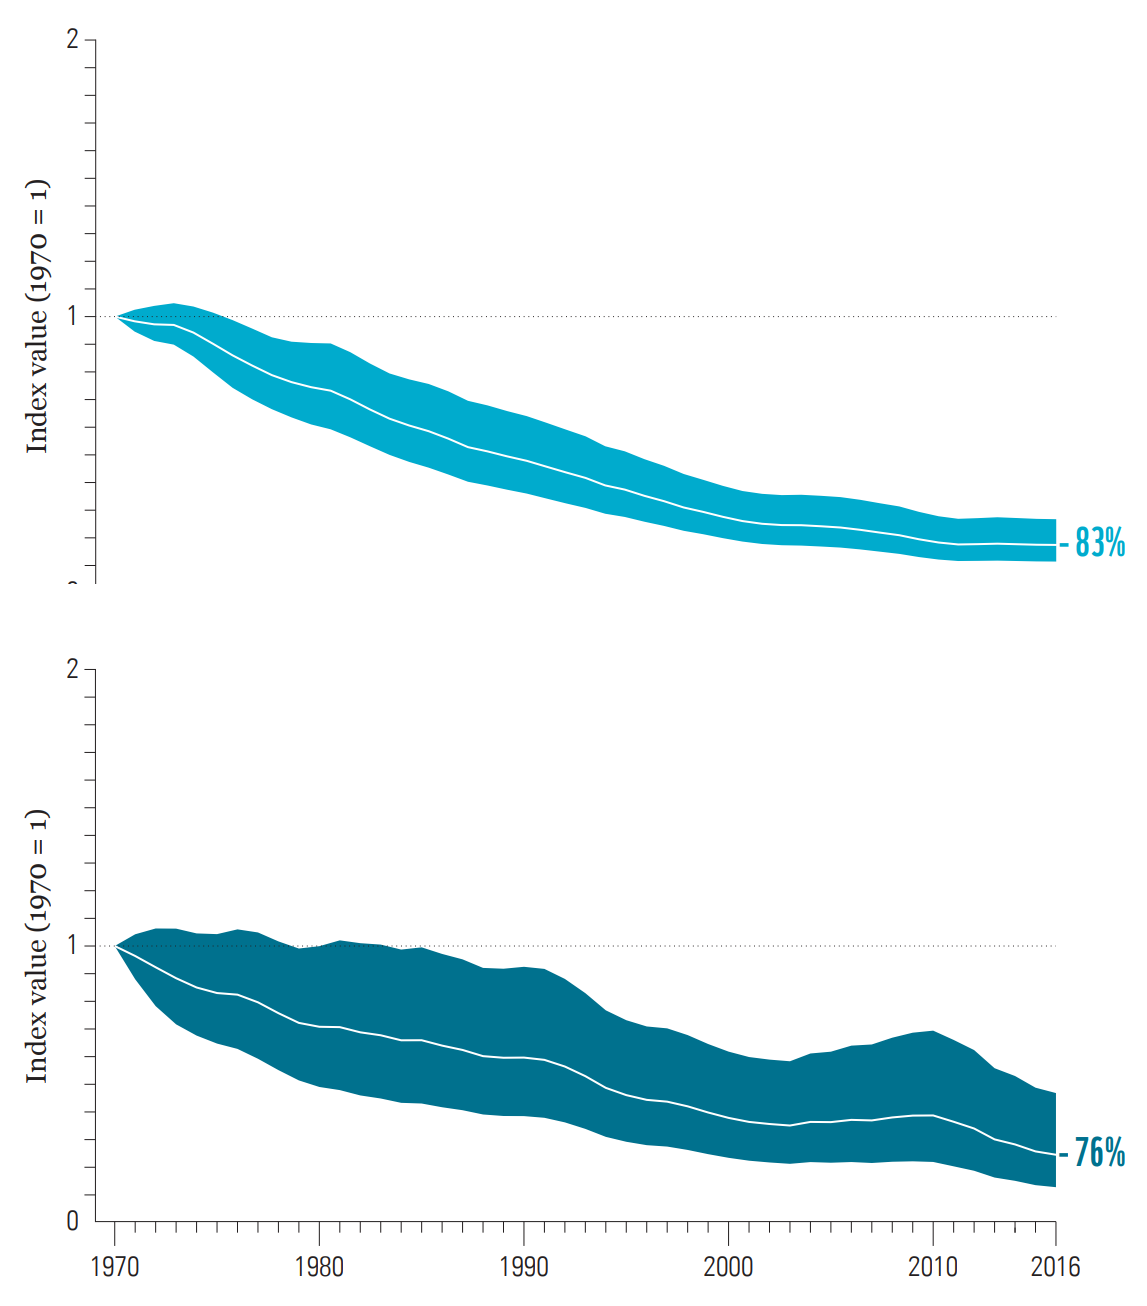
The biggest declines globally were seen in monitored freshwater populations, which have fallen by an average of 83 per cent. Habitat loss and barriers to migration routes are responsible for about half of the threats to monitored migratory fish species.
“The Living Planet Report contains shocking figures directly related to our interlinked climate and biodiversity crises and in response we must see transformative systems change if we’re to halt and reverse nature loss and secure a flourishing future for people and nature,” said Dr Marco Lambertini, Director General of WWF International. “Government leaders must step up at COP15. The world is watching.”
The report comes at a pivotal time. World leaders are due to meet at the 15th Conference of Parties to the Convention of Biological Diversity (CBD COP15) this December in Montreal for a once-in-a-decade opportunity to course-correct for the sake of people and the planet. WWF is advocating for leaders to commit to a ‘Paris-style’ agreement capable of reversing biodiversity loss to secure a nature-positive world by 2030.
“The findings of the LPR show the urgency with which we need to act as we approach CBD COP15 in Montreal. If we are going to reverse the dramatic species declines shown in this report, it’s important that Canada recognizes the role protected areas can play in helping us meet global biodiversity targets. What’s more is that when protected areas are established in a way that considers Indigenous rights, biodiversity and climate benefits at the same time, they can help us curb both biodiversity loss and the effects of climate change in a just and equitable way,” says Megan Leslie, WWF-Canada’s President and CEO.
Dr Andrew Terry, Director of Conservation and Policy at ZSL, said: “The Living Planet Index highlights how we have cut away the very foundation of life and the situation continues to worsen. Half of the global economy and billions of people are directly reliant on nature. Preventing further biodiversity loss and restoring vital ecosystems has to be at the top of global agendas to tackle the mounting climate, environmental and public health crises.”
Around the world, the report indicates that the main drivers of wildlife population decline are habitat degradation and loss, exploitation, the introduction of invasive species, pollution, climate change and disease.
The Living Planet Report makes clear that delivering a nature-positive future will not be possible without recognising and respecting the rights, governance, and conservation leadership of Indigenous Peoples and local communities around the world.
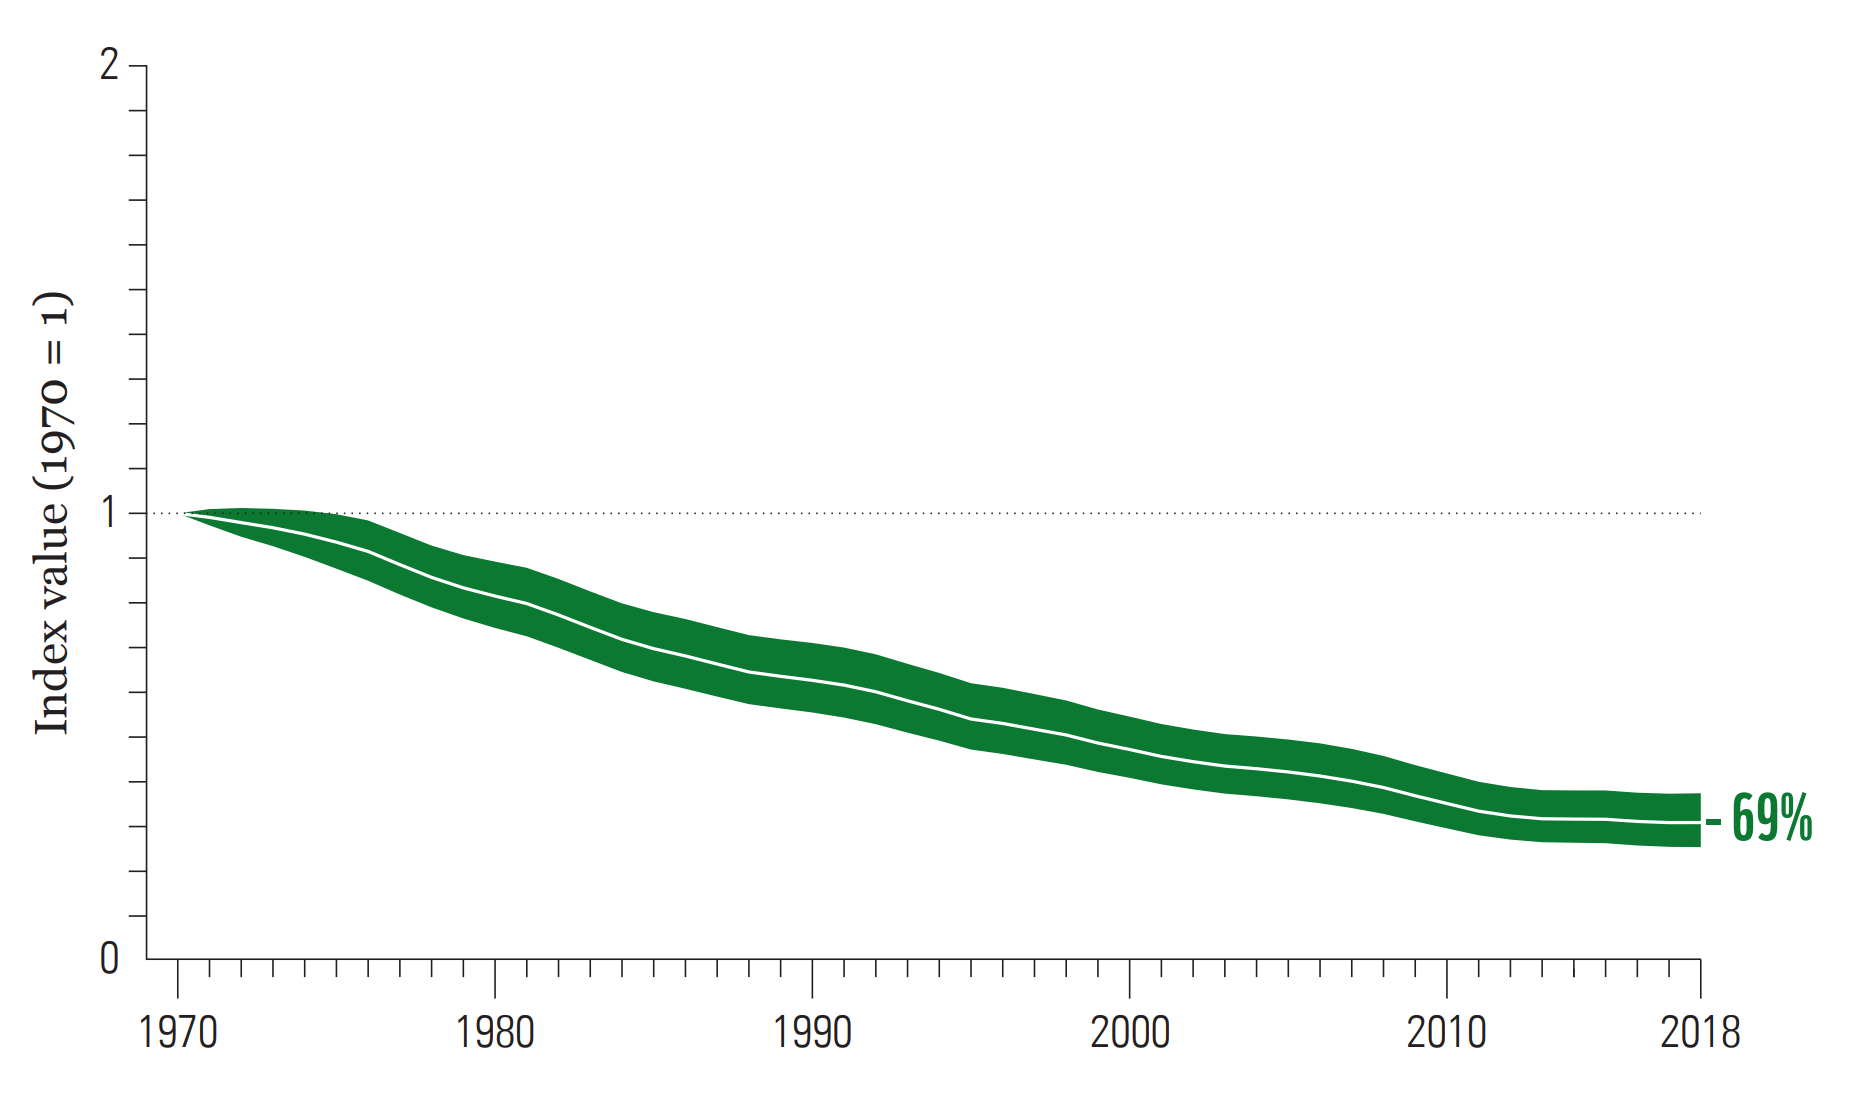
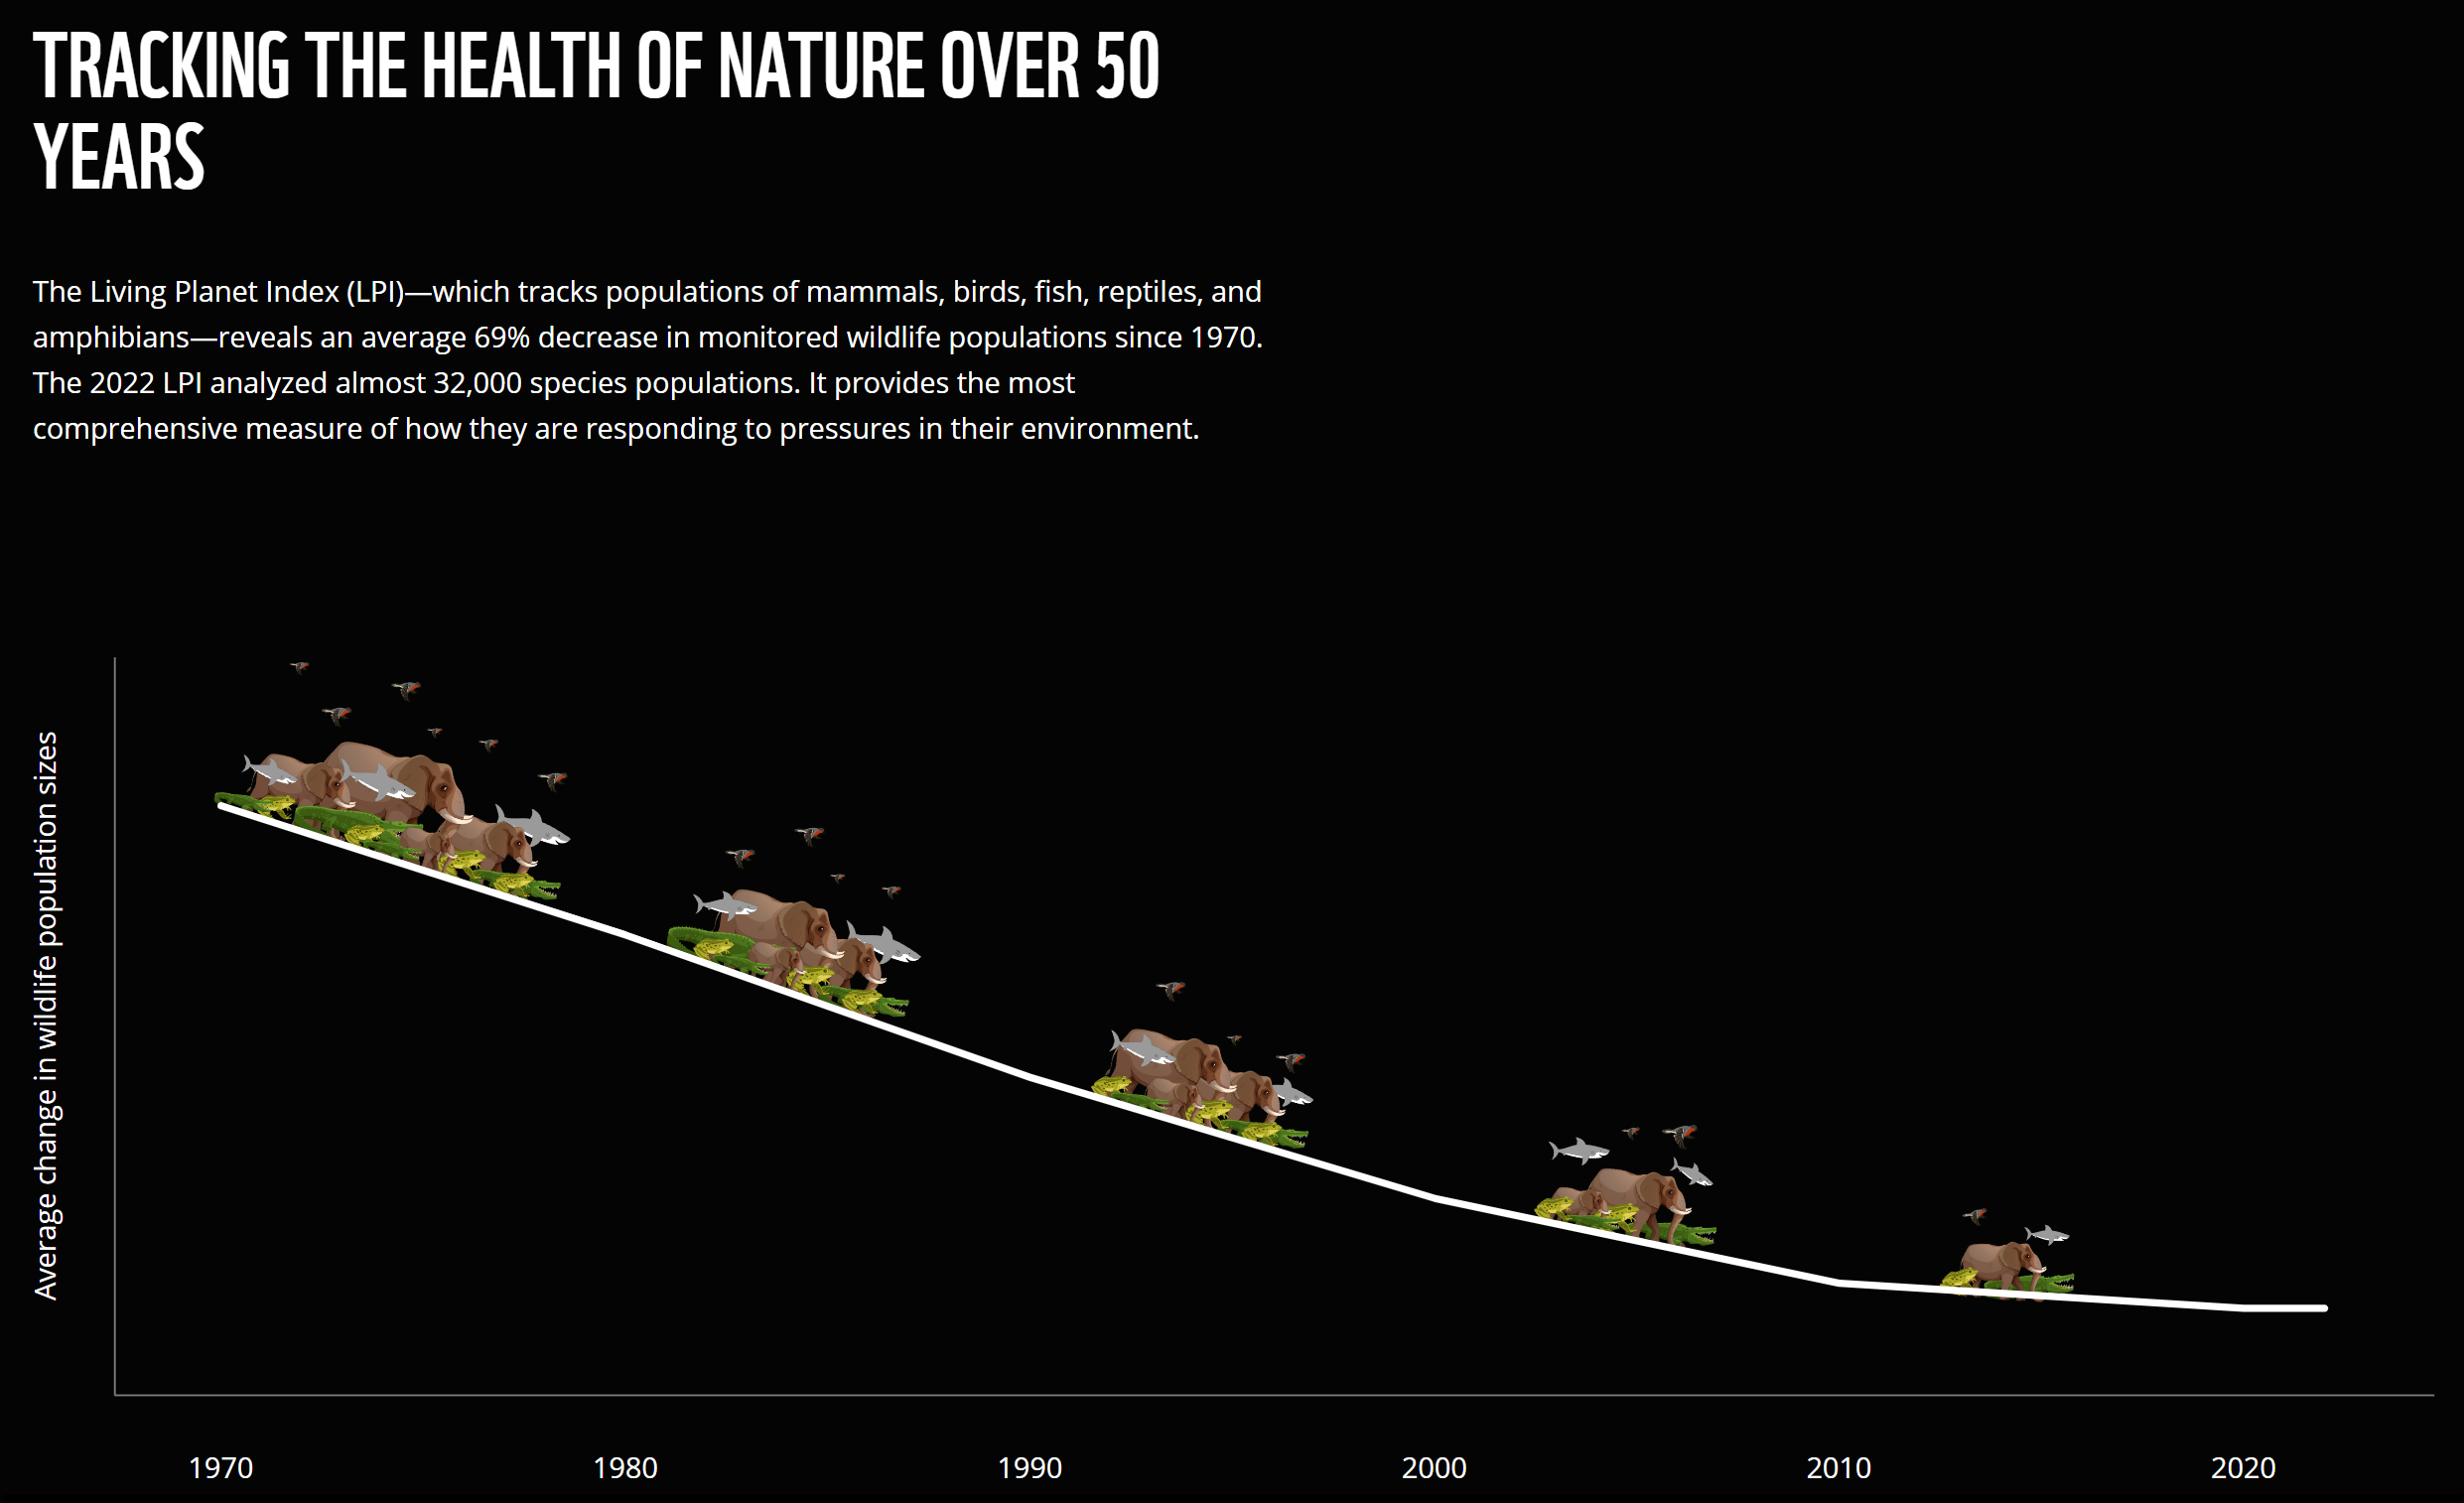
- *The 2022 global Living Planet Index (LPI) shows an average 69% decline in monitored vertebrate wildlife populations. The percentage change in the index reflects the average proportional change in animal population sizes tracked over 48 years – not the number of individual animals lost nor the number of populations lost.
- The LPR 2022 is the 14th edition of WWF’s biennial flagship publication.
- The full Living Planet Report 2022 and summary versions of the report are available. At this link, you will also find B-roll footage and images.
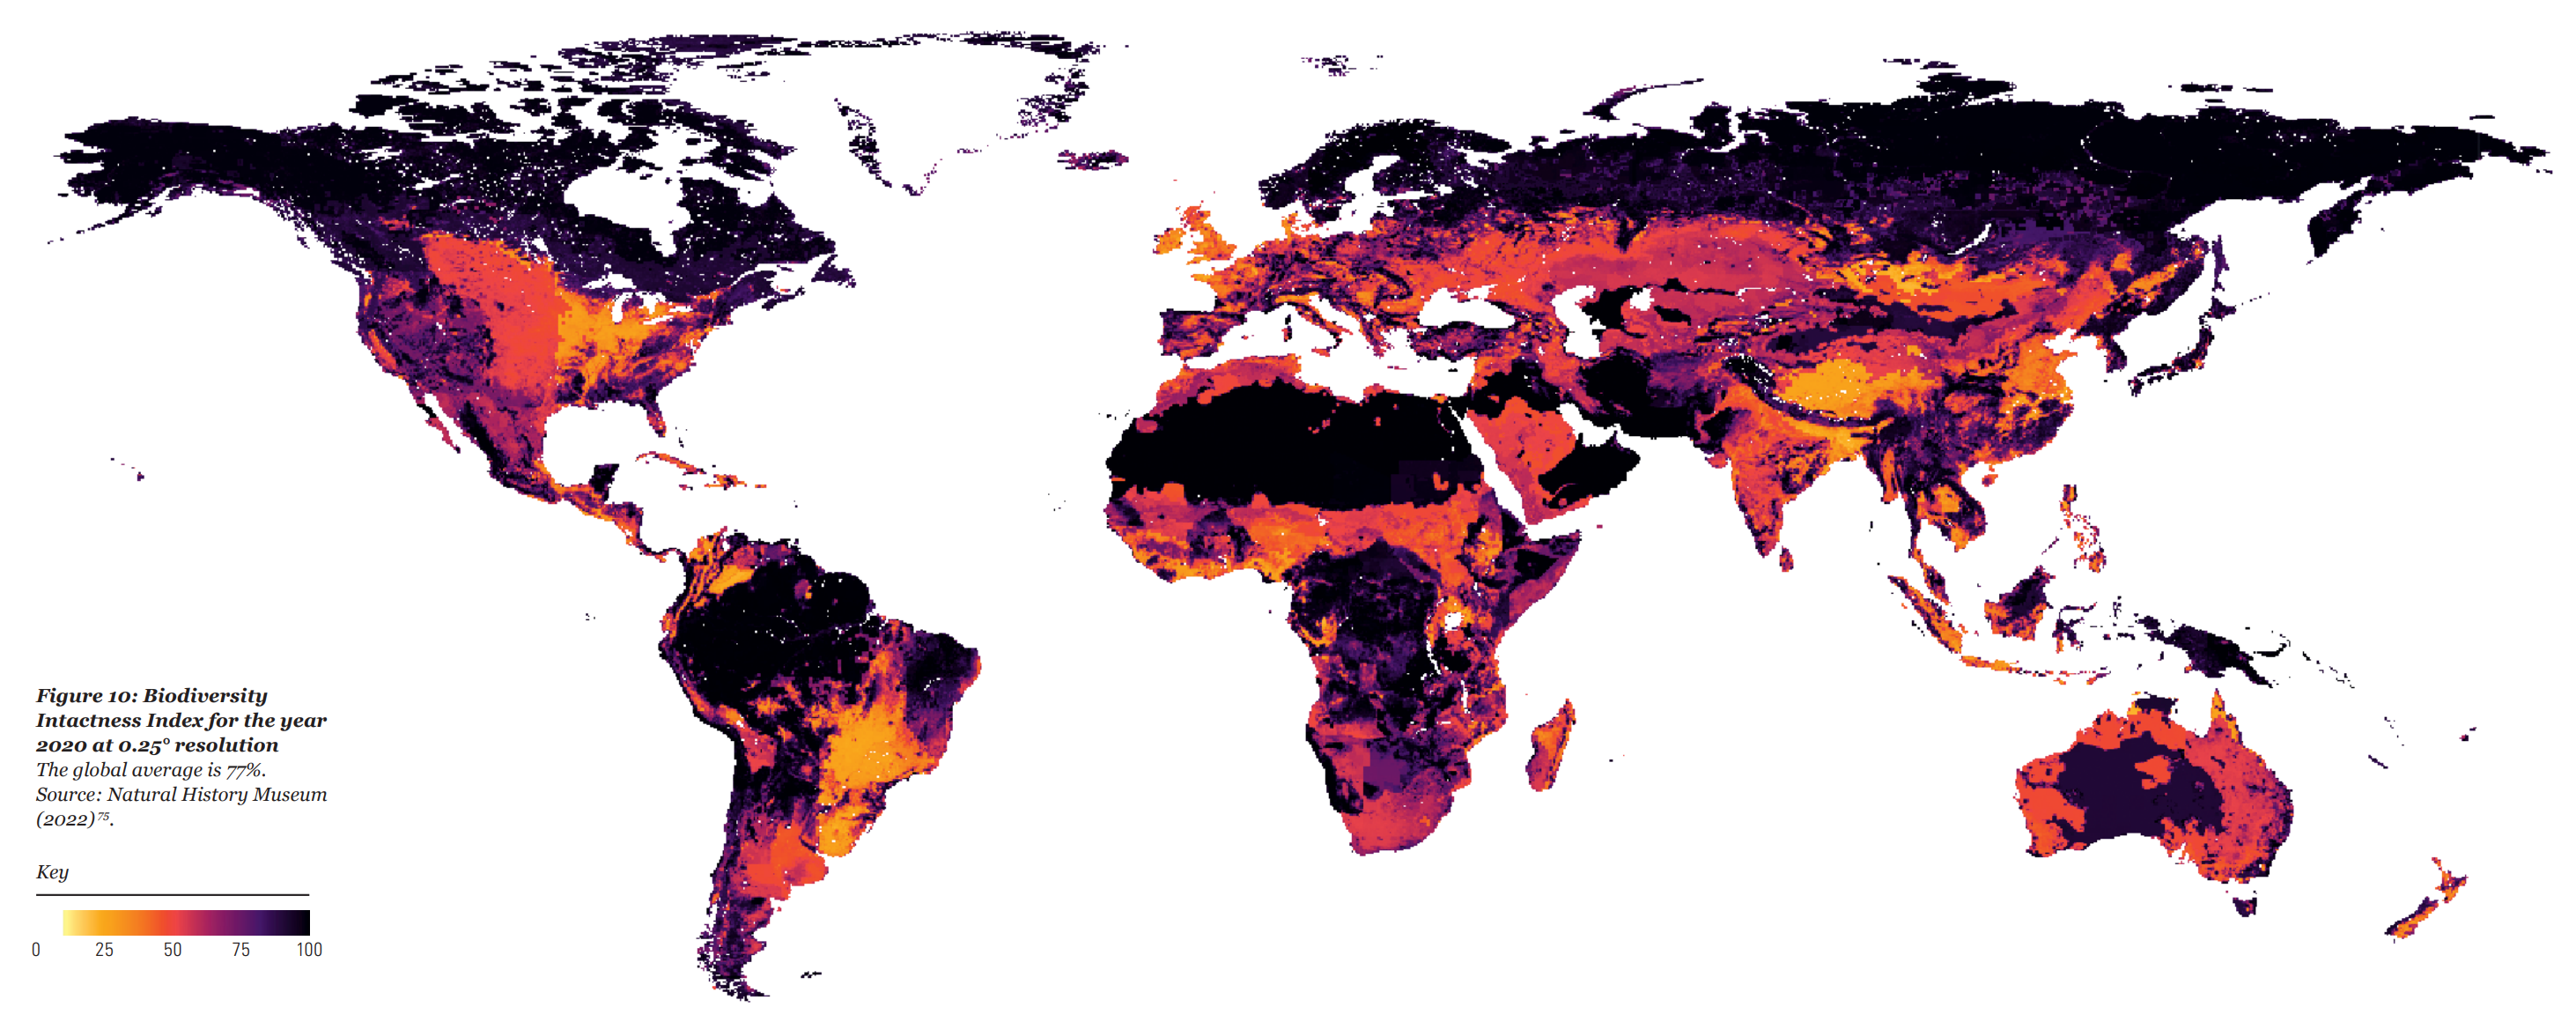
- Please note that successive iterations of the LPI are not directly comparable as they contain different sets of species. It is also important to note that the 1970 baseline holds different significance for the various regions monitored. In Europe and North America, pressures had been impacting species and habitats for many decades prior to 1970 so while the declines in these regions are ostensibly not as steep, it does not mean biodiversity is more intact in these regions. In fact, the report’s Biodiversity Intactness Index shows that Europe is one of the regions that scores lowest for biodiversity intactness. Conversely, tropical regions would have started at a more intact baseline in 1970 but have since experienced more rapid changes to their ecosystems.
- The LPI is an early warning indicator on the health of nature. This year’s edition analyses almost 32,000 species populations – with more than 838 new species and just over 11,000 new populations added since the previous report came out in 2020. It provides the most comprehensive measure of how species are responding to pressures in their environment driven by biodiversity loss and climate change, also allowing us to understand the impact of people on biodiversity.
- The Fifteenth Conference of Parties to the UN Convention on Biological Diversity (COP15) is scheduled to take place in Montreal, Canada, 7-19 December, under the Presidency of China.
- WWF-Canada’s Living Planet Report Canada (LPRC) 2020 analyzed wildlife population trends and found that populations of Canadian species assessed as at risk nationally by the Committee on the Status of Endangered Wildlife in Canada (COSEWIC) have declined by 59 per cent, on average, from 1970–2016.
Contact
World Wildlife Fund Canada
WWF-Canada is committed to equitable and effective conservation actions that restore nature, reverse wildlife loss and fight climate change. We draw on scientific analysis and Indigenous guidance to ensure all our efforts connect to a single goal: a future where wildlife, nature and people thrive. For more information visit wwf.ca.
WWF
WWF is an independent conservation organization, with over 30 million followers and a global network active in nearly 100 countries. Our mission is to stop the degradation of the planet’s natural environment and to build a future in which people live in harmony with nature, by conserving the world’s biological diversity, ensuring that the use of renewable natural resources is sustainable, and promoting the reduction of pollution and wasteful consumption. Visit panda.org/news for the latest news and media resources; follow us on Twitter @WWF_media
ZSL
ZSL (Zoological Society of London) is an international conservation charity working to create a world where wildlife thrives. From investigating the health threats facing animals to helping people and wildlife live alongside each other, ZSL is committed to bringing wildlife back from the brink of extinction. Our work is realised through our ground-breaking science, our field conservation around the world and engaging millions of people through our two zoos, ZSL London Zoo and ZSL Whipsnade Zoo. For more information, visit www.zsl.org.
Researchers Report a Staggering Decline in Wildlife. Here’s How to Understand It.
By Catrin Einhorn
12 October 2022
(The New York Times) – The latest update to an important assessment found that populations had declined by an average of 69 percent since 1970. But that might not mean what you think.
It’s clear that wildlife is suffering mightily on our planet, but scientists don’t know exactly how much. A comprehensive figure is exceedingly hard to determine. Counting wild animals — on land and at sea, from gnats to whales — is no small feat. Most countries lack national monitoring systems.
One of the most ambitious efforts to fill this void is published every two years. Known as the Living Planet Index, it’s a collaboration between two major conservation organizations, the World Wide Fund for Nature, widely known as the WWF, and the Zoological Society of London. But the report has repeatedly resulted in inaccurate headlines when journalists misinterpreted or overstated its results.
The assessment’s latest number, issued Wednesday by 89 authors from around the world, is its most alarming yet: From 1970 to 2018, monitored populations of vertebrates declined an average of 69 percent. That’s more than two-thirds in only 48 years. It’s a staggering figure with serious implications, especially as nations prepare to meet in Montreal this December in an effort to agree on a new global plan to protect biodiversity. But does it mean what you think?
What the data does, and doesn’t, mean
Remember that this number is only about vertebrates: mammals, birds, reptiles, amphibians and fish. Absent are creatures without spines, even though they make up the vast majority of animal species (scientists have even less data on them).
So, have wild vertebrates plummeted by 69 percent since 1970?
No.
The study tracks selected populations of 5,320 species, vacuuming up all the relevant published research that exists, adding more each year as new data permits. It includes, for example, a population of whale sharks in the Gulf of Mexico counted from small planes flying low over the water, and birds tallied by the number of nests on cliffs. Depending on the species, tools like camera traps and evidence like trail droppings help scientists estimate the population in a certain place.
This year’s update includes almost 32,000 such populations.
There’s a temptation to think that an average 69 percent decline in these populations means that’s the share of monitored wildlife that was wiped out. But that’s not true. An addendum to the report provides an example of why.
Imagine, the authors wrote, we start with three populations: birds, bears, and sharks. The birds decline to 5 from 25, a drop of 80 percent. The bears fall to 45 animals from 50, or 10 percent. And the sharks decrease to 8 from 20, or 60 percent.
That gives us an average decline of 50 percent. But the total number of animals fell to 92 from 150, a drop of about 39 percent.
The index is designed that way because it seeks to understand how populations are changing over time. It doesn’t measure how many individuals are present.
“The Living Planet Index is really a contemporary view on the health of the populations that underpin the functioning of nature across the planet,” said Rebecca Shaw, chief scientist at WWF and an author of the report.
Another important factor is the way monitored populations end up in the index. They don’t represent a broad, randomized sampling. Rather, they reflect the data that’s available. So there is quite likely bias in which species are tracked.
One controversy has been whether a small number of populations in drastic decline call into question the overall results. Two years ago, a study in Nature found that just 3 percent of populations were driving a drastic decline. When those were removed, the global trend switched to an increase.
The paper sparked a flurry of responses in Nature as well as additional explanation and stress testing for this year’s update. On the bright side, the authors note that about half of the populations in the Living Planet Index are stable or increasing. However, when they tried excluding populations with the most drastic changes in both directions, down and up, the average descent remained steep.
“Even after we removed 10 percent of the complete data set, we still see declines of about 65 percent,” said Robin Freeman, head of the indicators and assessments unit at the Zoological Society of London and an author of the report.
So, is it still bad?
Yes. Some scientists think the report actually underestimates the global biodiversity crisis, in part because devastating declines in amphibians may be underrepresented in the data.
And, over time, the trend is not turning around.
“Year after year we are not able to start improving the situation, despite major policies,” said Henrique M. Pereira, a professor of conservation biology at the German Center for Integrative Biodiversity Research who was not involved in this year’s report. “At most we have been able to kind of slow down the declines.”
Latin America and the Caribbean saw the worst regional drop, down 94 percent from 1970. The pattern was most pronounced in freshwater fish, reptiles and amphibians. Africa was next at 66 percent; Asia and the Pacific saw 55 percent. The region defined as Europe-Central Asia saw a smaller decline, at 18 percent, as did North America, at 20 percent. Scientists emphasized that far steeper biodiversity losses in those two areas likely occurred long before 1970 and aren’t reflected in this data.
Scientists know what’s causing biodiversity loss. On land, the top driver is agriculture, as people turn forests and other ecosystems into farmland for cattle or palm oil. At sea, it’s fishing. There are ways to do both more sustainably.
If climate change is not limited to 2 degrees Celsius, and preferably 1.5 degrees, its consequences are expected to become the leading cause of biodiversity loss in coming decades, the report said.
In December, the nations of the world will gather to try to reach a new agreement to safeguard the planet’s biodiversity. The last one mostly failed to meet its targets. The Living Planet Report offers evidence for how to succeed this time, Dr. Shaw said. A critical lesson is that conservation doesn’t work without the support of local communities.
“When we get really focused conservation efforts that incorporate the community, that have the communities stewarding the outcomes because they benefit from it, we see that it is possible to have increases in populations,” she said. “Which is really the bright spot.”
Researchers Report a Staggering Decline in Wildlife. Here’s How to Understand It.
Living Planet Report 2022 Executive Summary
By Marco Lambertini
12 October 2022
(WWF) – Today we face the double, interlinked emergencies of human-induced climate change and the loss of biodiversity, threatening the well-being of current and future generations. As our future is critically dependent on biodiversity and a stable climate, it is essential that we understand how nature’s decline and climate change are connected.
The nature of these connections, the impacts they have on people and biodiversity, and building a positive, equitable, and sustainable future, are key themes in this edition of the Living Planet Report.
In addressing these complex, interlinked challenges we recognise that there is no one-size-fits-all solution, nor one single source of knowledge. To create this edition, we have therefore woven together
multiple voices and drawn on different sources of knowledge from around the world.
Land-use change is still the biggest current threat to nature, destroying or fragmenting the natural habitats of many plant and animal species on land, in freshwater and in the sea. However, if we are unable to limit warming to 1.5°C, climate change is likely to become the dominant cause of biodiversity loss in the coming decades. Rising temperatures are already driving mass mortality events, as well as the first extinctions of entire species. Every degree of warming is expected to increase these losses and the impact they have on people. We feature 3 stories of people on the frontline and how they are dealing with the consequences of local changes in climate and biodiversity.
Biodiversity indicators help us understand how our natural world is changing over time. Tracking the health of nature over almost 50 years, the Living Planet Index acts as an early warning indicator by tracking trends in the abundance of mammals, fish, reptiles, birds and amphibians around the world.
In its most comprehensive finding to date, this edition shows an average 69% decline in the relative abundance of monitored wildlife populations around the world between 1970 and 2018. Latin America shows the greatest regional decline in average population abundance (94%), while freshwater species populations have seen the greatest overall global decline (83%).
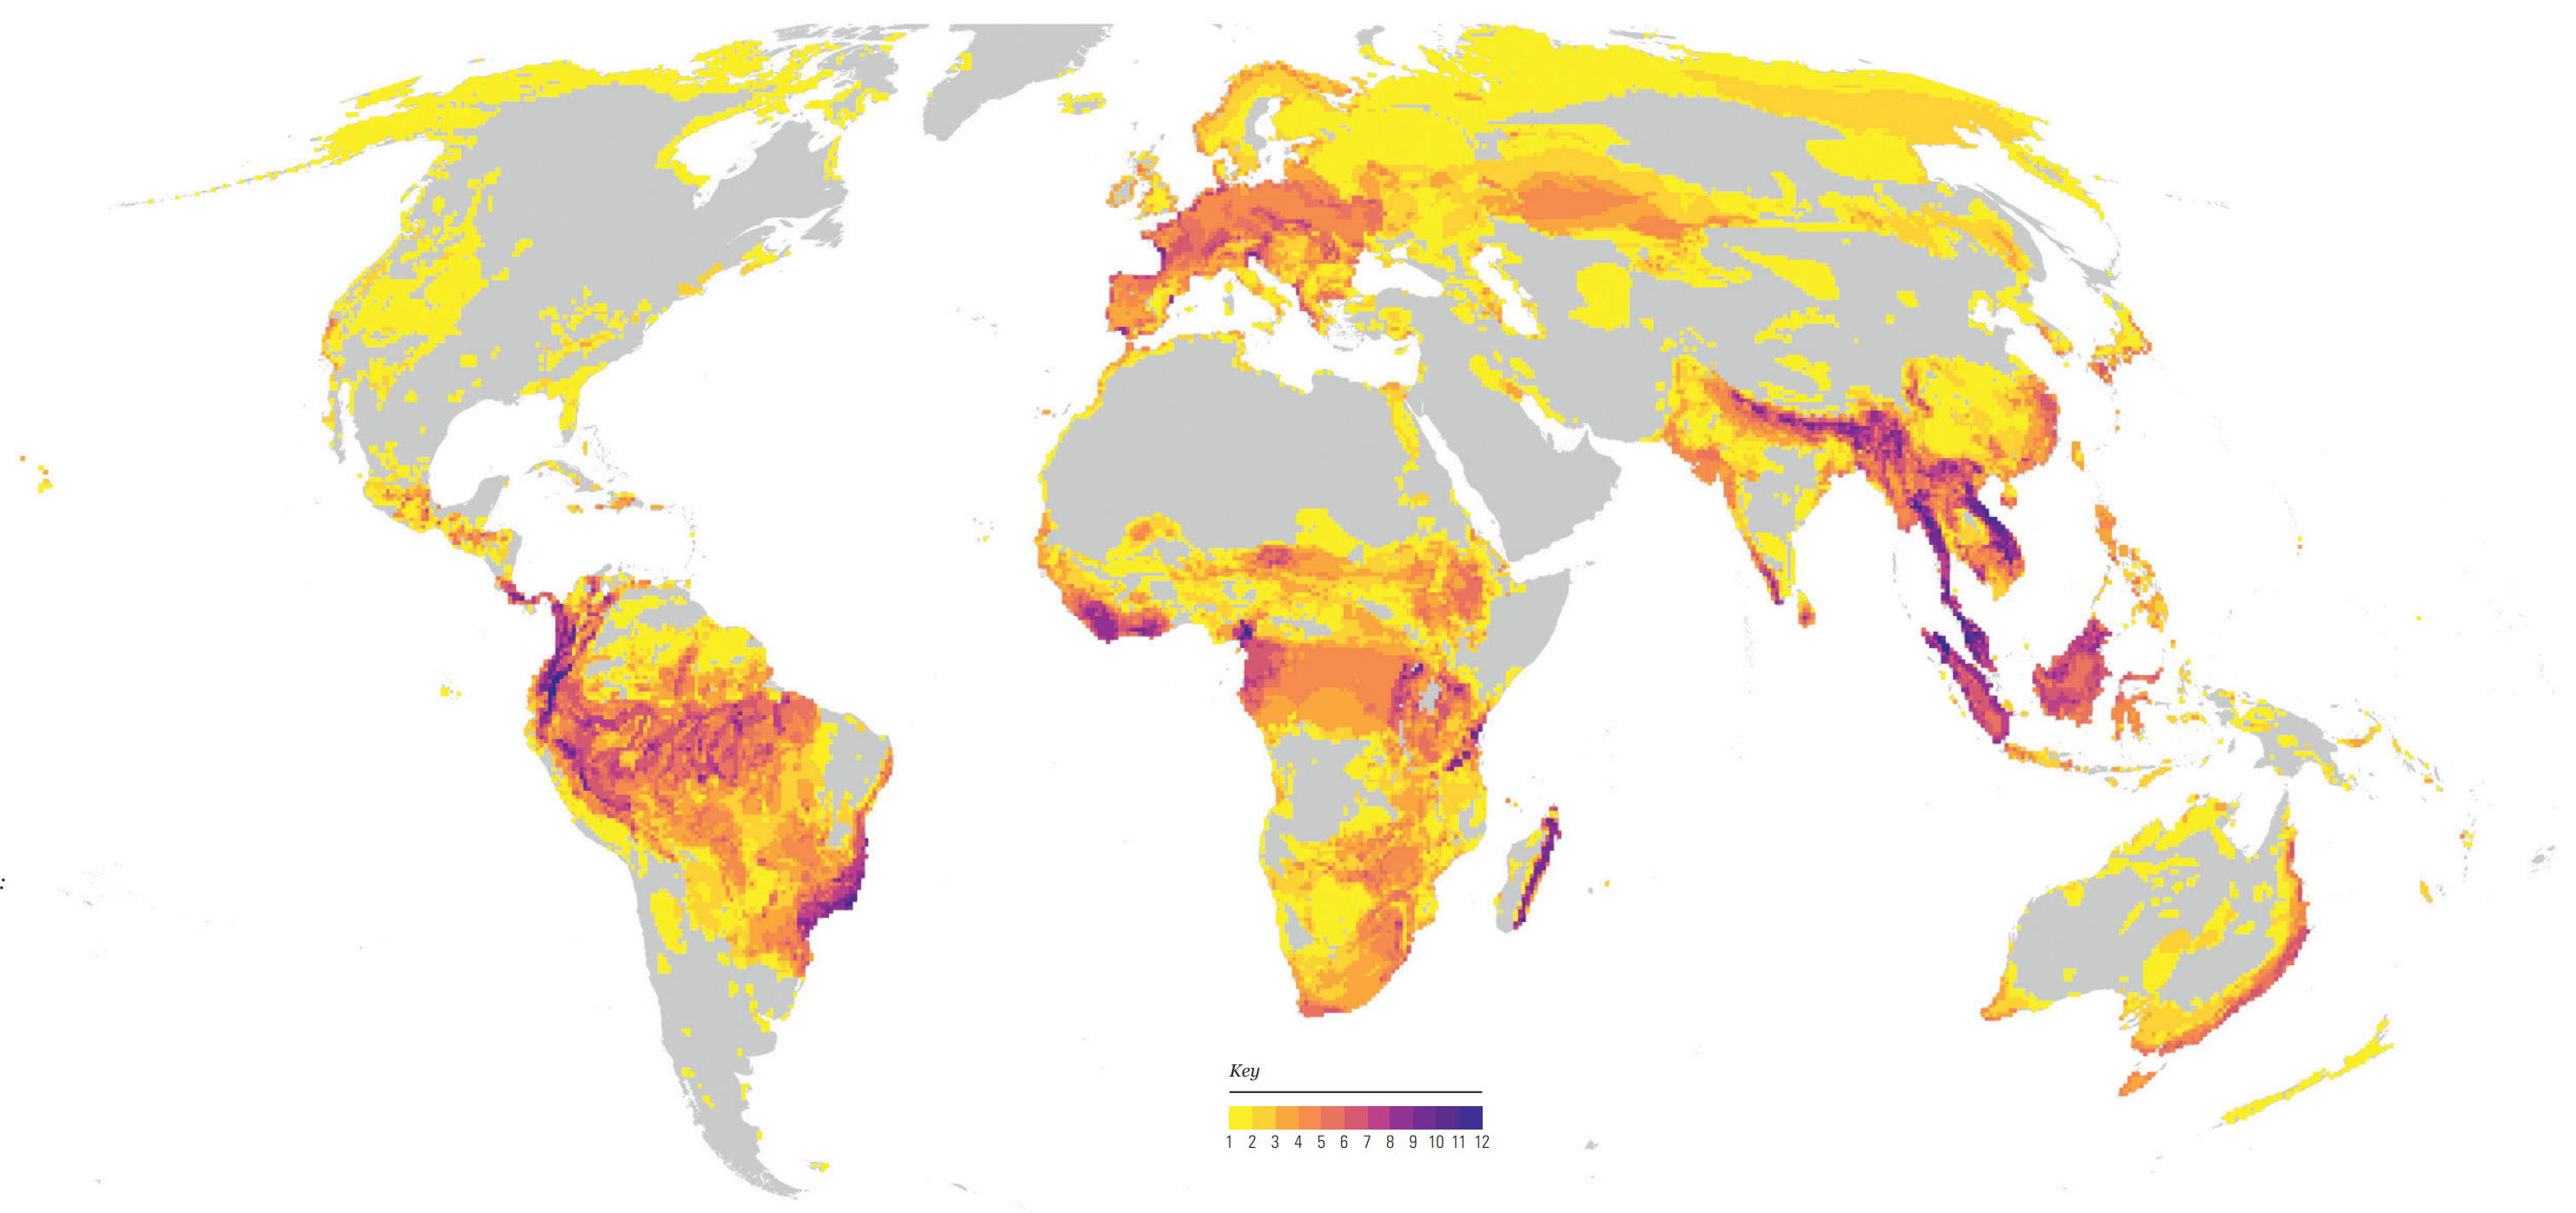
New mapping analysis techniques allow us to build up a more comprehensive picture of both the speed and the scale of changes in biodiversity and climate. For example, we feature the new biodiversity risk maps generated for the IPCC Working Group 2 report published in February 2022. These maps are the result of decades of work which has involved more than 1 million hours of computer time. We also explore an analysis using data from the IUCN Red List which allows us to overlay six key threats – agriculture, hunting, logging, pollution, invasive species, and climate change – to highlight ‘threat hotspots’ for terrestrial vertebrates.
To help us imagine a future where people and nature can thrive, scenarios and models – such as the Bending the Curve work featured in the 2020 Living Planet Report – can create ‘menus’ that indicate how we can most effectively address biodiversity loss under a range of climate and development scenarios. Now, researchers are exploring new lenses to add to this work, including the integration of equity and fairness. This could help to better target the urgent and unprecedented action needed to change our business-as-usual trajectory.
We know that transformational change – game-changing shifts – will be essential to put theory into practice. We need system-wide changes in how we produce and consume, the technology we use, and our economic and financial systems. Underpinning these changes must be a move from goals and targets to values and rights, in policy-making and in day-to-day life.
To catalyse this, in 2022, the United Nations General Assembly recognised that everyone, everywhere, has the right to live in a clean, healthy and sustainable environment, meaning that for those in power respecting this is no longer an option but an obligation. Although not legally binding, the UN resolution is expected to accelerate action, just as earlier resolutions on the right to water in 2010 turbocharged progress in delivering safe water to millions of people.
This edition of the Living Planet Report confirms the planet is in the midst of a biodiversity and climate crisis, and that we have a last chance to act. This goes beyond conservation. A nature-positive future needs transformative – game changing – shifts in how we produce, how we consume, how we govern, and what we finance. We hope it inspires you to be part of that change.
Code Red for the planet (and humanity)
The message is clear and the lights are flashing red. Our most comprehensive report ever on the state of global vertebrate wildlife populations presents terrifying figures: a shocking two-thirds decline in the global Living Planet Index less than 50 years. And this comes at a time when we are finally beginning to understand the deepening impacts of the interlinked climate and nature crises, and the fundamental role biodiversity plays in maintaining the health, productivity and stability of the many natural systems we and all life on Earth depend on. The COVID-19 pandemic has given many of us a new awareness of our vulnerability. This is beginning to challenge the unthinking assumption that we can continue to dominate the natural world irresponsibly, taking nature for granted, exploiting its resources wastefully and unsustainably, and distributing them unevenly without facing any consequences. Today, we know that there are consequences. Some of them are already here: the loss of lives and economic assets from extreme weather; aggravated poverty and food insecurity from droughts and floods; social unrest and increased migration flows; and zoonotic diseases that bring the whole world to its knees. Nature loss is now rarely perceived as a purely moral or ecological issue, with a broadened sense of its vital importance to our economy, social stability, individual well-being and health, and as a matter of justice. The most vulnerable populations are already the most affected by environmental damage, and we are leaving a terrible legacy to our children and future generations to come. We need a global plan for nature, as we have for climate.
A global goal for nature: nature positive
We know what’s happening, we know the risks and we know the solutions. What we urgently need now is a plan that unites the world in dealing with this existential challenge. A plan that is agreed globally and implemented locally. A plan that clearly sets a measurable and time-bound global goal for nature as the 2016 Paris accord, with the net-zero emissions goal by 2050, did for climate. But what can be the ‘net-zero emissions’ equivalent for biodiversity?
Achieving net-zero loss for nature is certainly not enough; we need a nature- or net-positive goal to restore nature and not simply halt its loss. Firstly, because we have lost and continue to lose so much nature at such a speed that we need this higher ambition. And, secondly, because nature has shown us that it can bounce back – and quickly – if given a chance. We have many local examples of nature and wildlife comebacks, whether it is forests or wetlands, tigers or tuna, bees or earthworms.
We need nature positive by 2030 – which, in simple terms, means more nature by the end of this decade than at its start (see the explanatory infographic on page 100). More natural forests, more fish in the ocean and river systems, more pollinators in our farmlands, more biodiversity worldwide. A nature-positive future will bring countless benefits to human and economic well-being, including to our climate, food and water security. Together, the complementary goals of net-zero emissions by 2050 and net-positive biodiversity by 2030 represent the compass to guide us towards a safe future for humanity, to shift to a sustainable development model, to support the delivery of the 2030 Sustainable Development Goals.
Unmissable opportunity
For me, for WWF, and for many other organizations and a growing number of country and business leaders (e.g. the Leaders’ Pledge for Nature group of 93 heads of state and the President of the European Commission, and the Business For Nature, the Taskforce on Nature-Related Financial Disclosure and the Finance for Biodiversity coalitions), agreeing on a nature-positive global goal is crucial and urgent.
World leaders have an unmissable opportunity in December 2022 to embrace a nature-positive mission at the long-awaited 15th conference of the UN Convention on Biological Diversity (COP15) in Montreal, Canada, under the presidency of China. This is key to ensuring the right level of ambition and measurability in the goals and targets of the agreement.
It is key to mobilizing and aligning governments, communities, businesses, financial institutions and even consumers towards contributing to the same shared global goal, inspiring a whole-of-society approach. And it is key to injecting the same high degree of accountability that we are beginning to witness around climate action.
Just as the global goal of ‘net-zero emissions by 2050’ is disrupting the energy sector so that it shifts towards renewables, ‘nature positive by 2030’ will disrupt the sectors that are drivers of nature loss – agriculture, fishing, forestry, infrastructure and extractives – driving innovation and acceleration towards sustainable production and consumption behaviours.
Our society is at the most important fork in its history and is facing its deepest systems change challenge around what is perhaps the most existential of all our relationships: the one with nature. And all this at a time when we are beginning to understand that we depend on nature much more than nature depends on us. The COP15 biodiversity conference can be the moment when the world comes together on nature.
Marco Lambertini, Director General, WWF International

![Effect of political contributions from oil and gas companies on U.S. legislators that vote against the environment. Coefficients and 95 percent CIs for tests of investment (Left) and influence (Right) hypotheses and their corresponding metaanalytic effects for the years 1992 to 2018. In 13 out of 14 analyses, lower LCV scores (i.e., more antienvironmental votes) in one election cycle predicted significantly increased contributions in the following election cycle. For example, the strongest result was observed for the 2016 election: For every additional 10 percent of congressional votes against the environment in 2014, a legislator would receive an additional $5,400 in campaign contributions from oil and gas companies in 2016 (b = −0.54, SE = 0.12; P < 0.001; 95 percent CI [−0.77, −0.31]). This is an especially strong relationship considering that many elected officials vote against environmental policies nearly 100 percent of the time, thereby compounding the cycle of antienvironmentalism and increasing rewards in the form of contributions. Graphic: Goldberg, et al., 2020 / PNAS](https://desdemonadespair.net/wp-content/uploads/2024/05/image-8-1200x675.png)