BP Statistical Review of World Energy 2022: Carbon emissions rebound after pandemic dip – Coal prices surge – “The world remains on an unsustainable path”
By Spencer Dale
28 June 2022
(BP) – The challenges and uncertainties facing the global energy system are at their greatest for almost 50 years, at the time of the last great energy shocks of the 1970s.
Most immediate is the impact of the terrible events taking place in Ukraine, with its tragic toll on lives and communities. The war also threatens to lead to shortages in food and energy, which could detract materially from health and wellbeing across the globe. From an energy perspective, the growing shortages and increasing prices highlight the continuing importance of energy ‘security’ and ‘affordability’ alongside ‘lower carbon’ when addressing the energy trilemma.
This immediate challenge sits alongside the need for the world to achieve a deep and rapid decarbonization consistent with meeting the Paris climate goals. Considerable progress has been made in sovereign pledges to achieve net zero, but in global aggregate terms those growing ambitions have yet to translate into tangible progress on the ground: carbon emissions have risen in every year since the Paris goals were agreed (other than in 2020 at the height of the COVID-19 pandemic). The world remains on an unsustainable path.
Added to those challenges, as COVID-19 restrictions around much of the world are relaxed and economic activity recovers, energy consumption is expanding sharply, increasing the demands on available energy supplies, and highlighting fragilities in the system.
Responding to those multiple challenges and uncertainties requires timely, objective and comprehensive data. That is the role bp’s Statistical Review of World Energy has been playing for the past 71 years and continues to play this year.
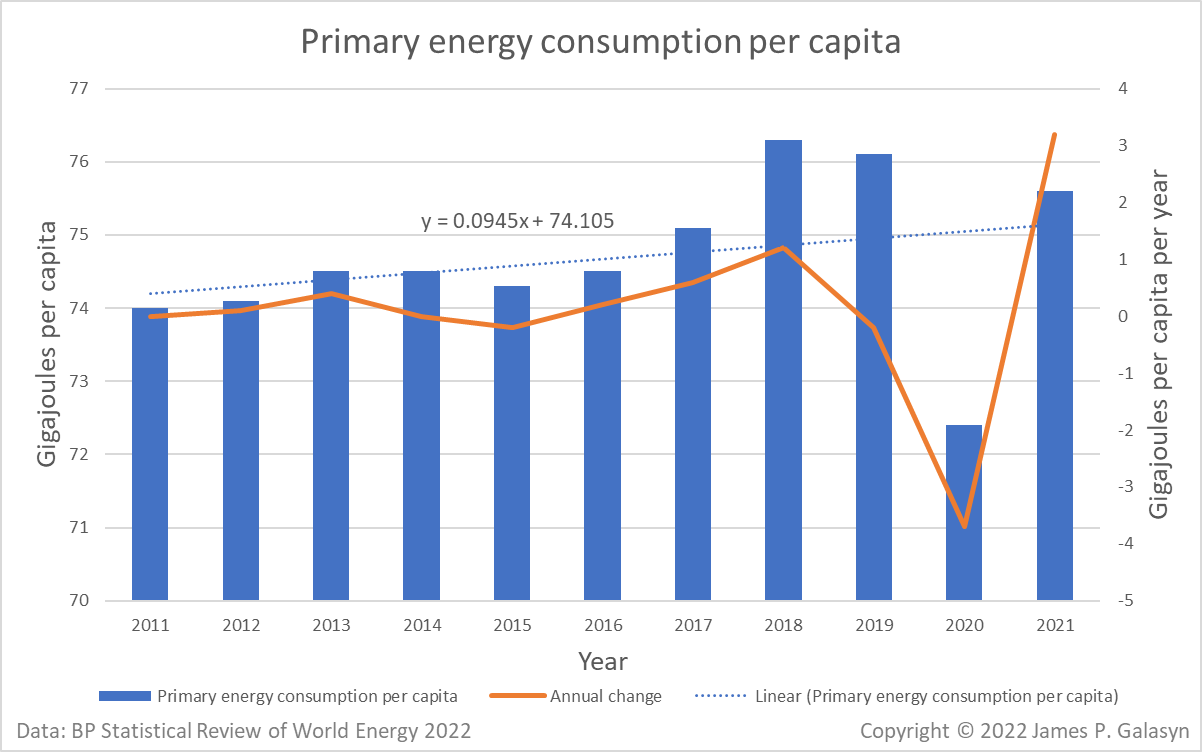
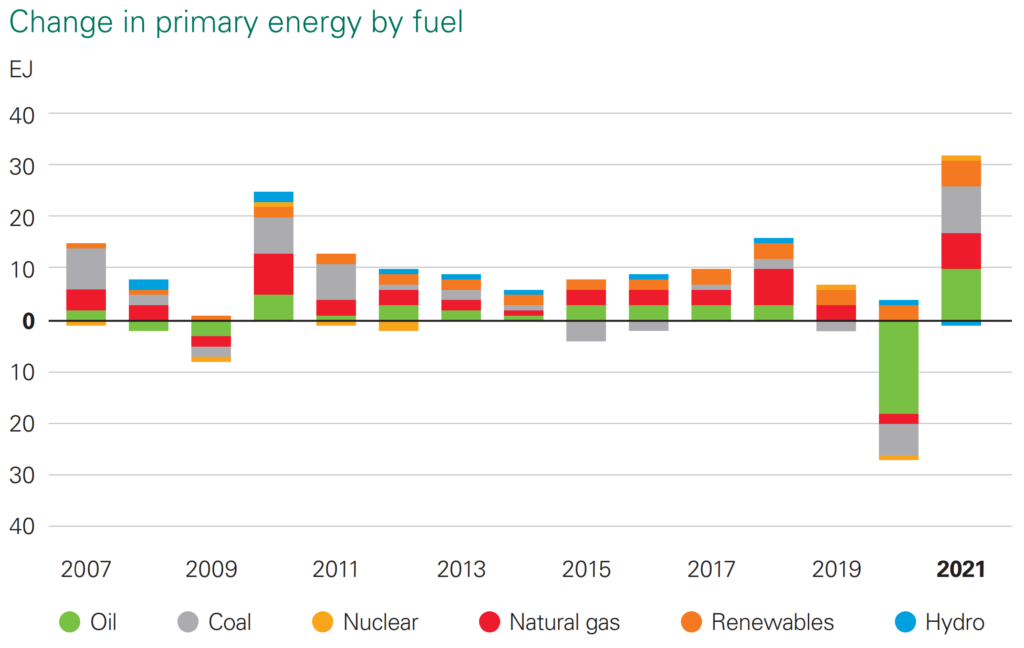
This year’s data show a sharp bounce back in global primary energy in 2021, increasing by almost 6% and more than reversing the sharp fall in energy consumption in 2020 as much of the world locked down. Primary energy use in 2021 is estimated to be more than 1% above its 2019 level.
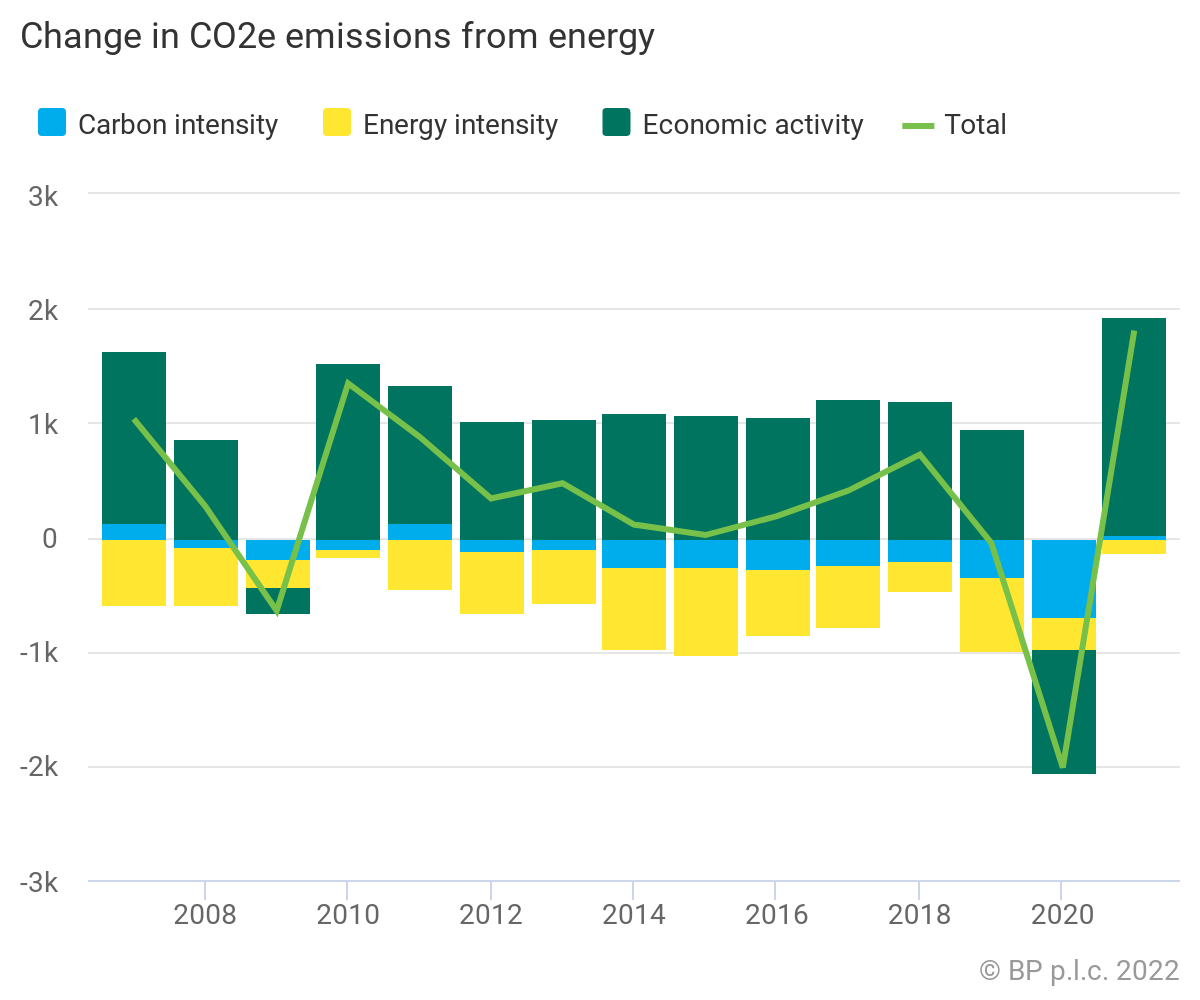
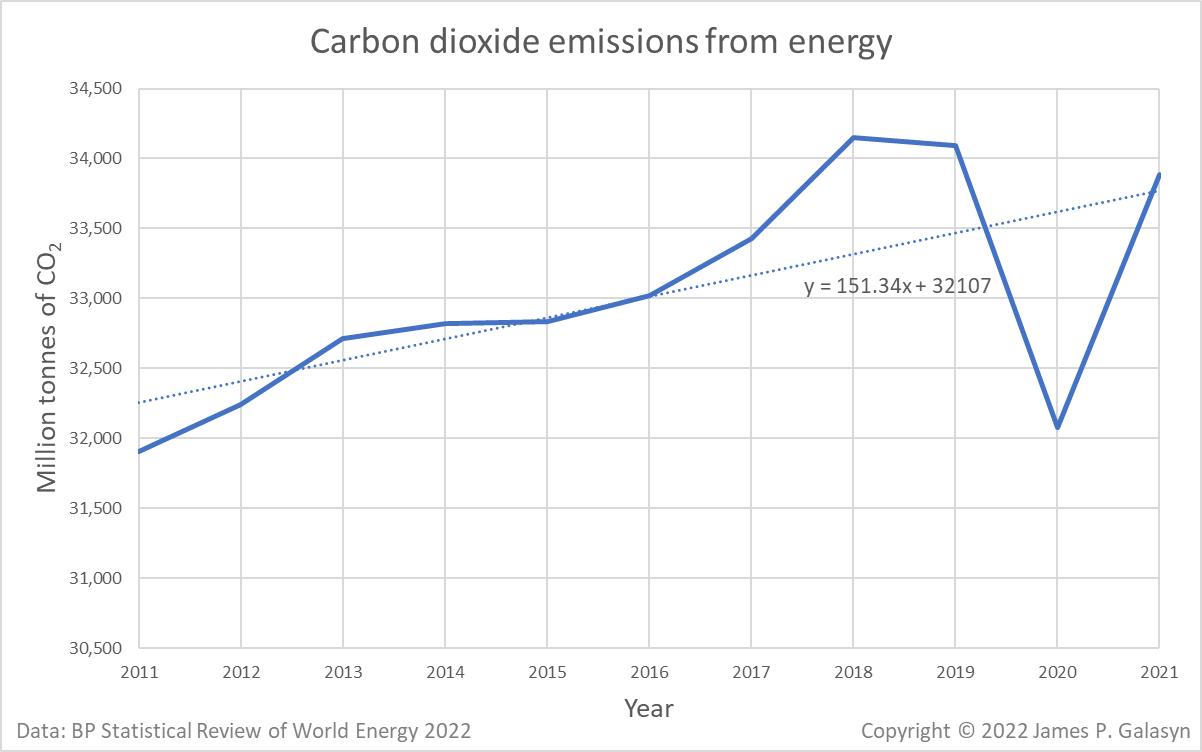
In many ways, this sharp rebound in energy demand is a sign of global success, driven by a rapid recovery in economic activity as the widespread distribution of effective vaccines allowed for an easing in Covid restrictions in many parts of the world and a return to our everyday lives. But it also highlights that the pronounced dip in carbon emissions in 2020 was only temporary: carbon equivalent emissions from energy (including methane), industrial processes, and flaring increased by 5.7% last year.
Smoothing through the impact of the pandemic, emissions were broadly unchanged over the past two years.
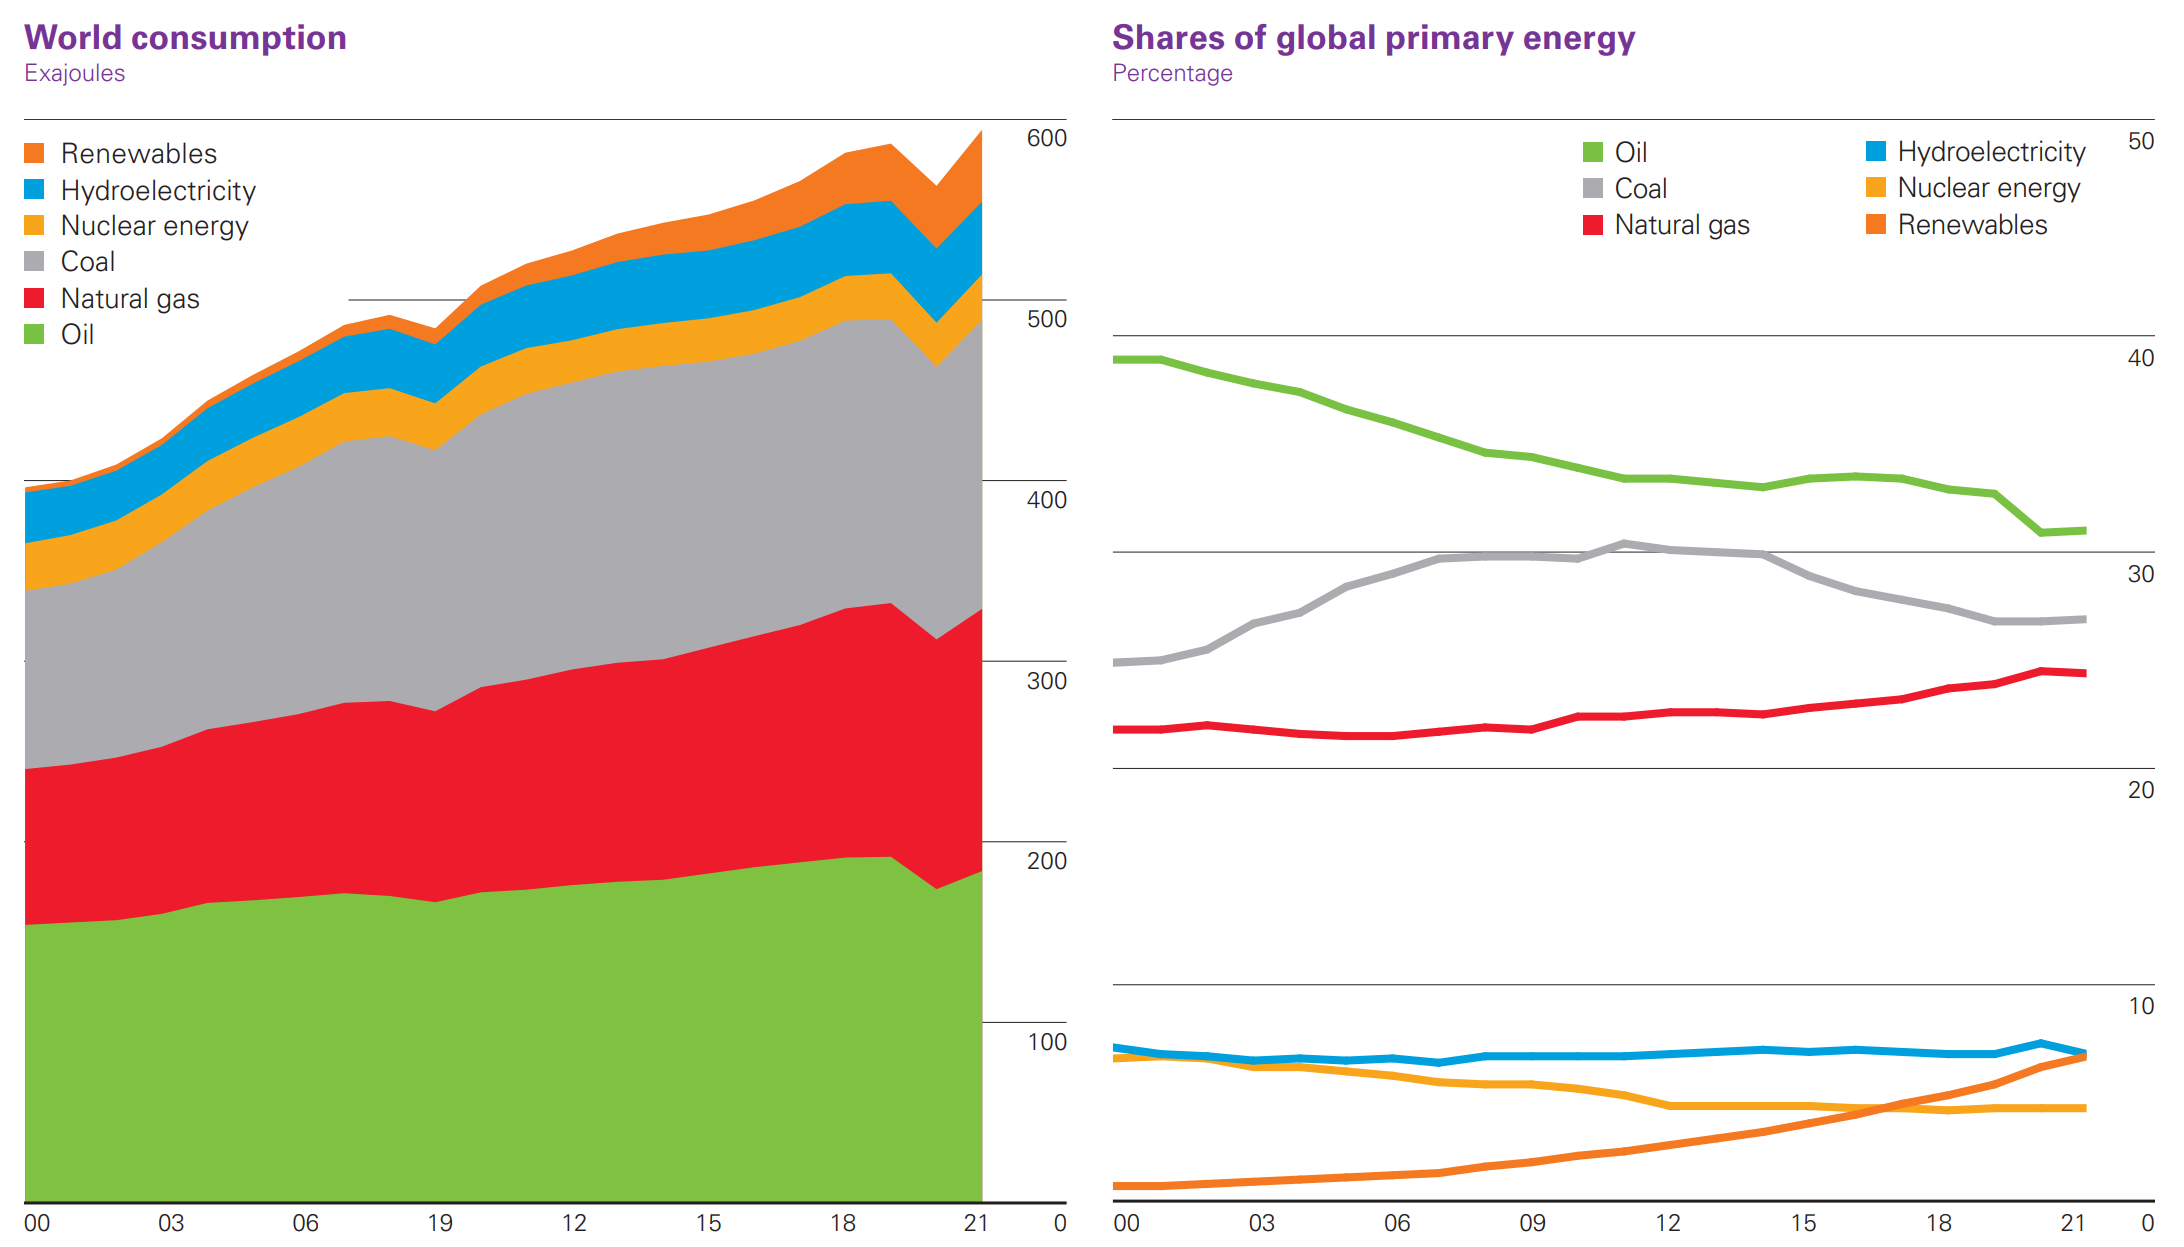
Encouragingly, renewable energy, led by wind and solar power, continued to grow strongly and now accounts for 13% of total generation. Renewable generation (excluding hydro) increased by almost 17% in 2021 and accounted for over half of the increase in global power generation over the past two years.
The low carbon energy sources, vectors and technologies needed to achieve a fast and deep decarbonization exist today – wind and solar power, biofuels, blue and green hydrogen, CCUS (carbon capture, use and storage), and carbon dioxide removals. The challenge is to apply them at unprecedented pace and scale. At bp, we remain committed to playing our role as we pursue our net zero ambition. I hope this year’s Review is of use to others following a similar pathway. I would like to thank all those who help us compile the Review, including the governments and statistical agencies around the world who have contributed their official data again. The Statistical Review would not be possible without your continuing support and transparency. Thank you.
Energy developments
- Primary energy demand increased by 5.8% in 2021, exceeding 2019 levels by 1.3%.
- Between 2019 and 2021, renewable energy increased by over 8 EJ. Consumption of fossil fuels was broadly unchanged.
- Fossil fuels accounted for 82% of primary energy use last year, down from 83% in 2019 and 85% five years ago.
Carbon emissions
- Carbon dioxide emissions from energy use, industrial processes, flaring and methane (in carbon dioxide equivalent) rose 5.7% in 2021 to 39.0 GtCO2e, with carbon dioxide emissions from energy rising 5.9% to 33.9 GtCO2, close to 2019 levels.
- Carbon dioxide emissions from flaring and emissions from methane and industrial processes rose more modestly by 2.9% and 4.6% respectively.
Oil
- Oil prices averaged $70.91/bbl in 2021, the second highest level since 2015.
- Oil consumption increased by 5.3 million barrels per day (b/d) in 2021 but remained 3.7 million b/d below 2019 levels.
- A majority of the consumption growth came from gasoline (1.8 million b/d) and diesel/gasoil (1.3 million b/d). Regionally, most of the growth took place in the US (1.5 million b/d), China (1.3 million b/d) and the EU (570,000 b/d).
- Global oil production increased by 1.4 million b/d in 2021, with OPEC+ accounting for more than three-quarters of the increase. Among all countries, Libya (840,000 b/d), Iran (540,000 b/d) and
- Canada (300,000 b/d) saw the largest increases. Nigeria (-200,000 b/d), the UK (-170,000 b/d) and Angola (-150,000 b/d) reported the biggest declines.
- Refinery capacity declined for the first time in over 30 years by almost 500,000 b/d last year driven by a sharp reduction in the OECD (1.1 million b/d). As a result, refining capacity in the OECD in 2021 was at its lowest level since 1998.
Natural gas
- Natural gas prices rebounded strongly across all three major gas regions in 2021, rising fourfold to record annual levels in Europe (TTF averaging $16/mmBtu) and tripling in the Asian LNG spot
market (JKM averaging $18.6/mmBtu). US Henry Hub prices nearly doubled to average $3.8/mmBtu in 2021 – their highest annual level since 2014. - Global natural gas demand grew 5.3% in 2021, recovering above pre-pandemic 2019 levels and crossing the 4 Tcm mark for the first time. Its share in primary energy in 2021 was unchanged
from the previous year at 24%. - LNG supply grew 5.6% (+26 Bcm) to 516 Bcm in 2021, its slowest rate of growth since 2015 (other than in 2020). LNG supply from the US rose by 34 Bcm, accounting for most of the new incremental supplies and more than offsetting declines from mainly other Atlantic Basin exporters.
- China surpassed Japan as the world’s largest LNG importer and accounted for close to 60% of global LNG demand growth in 2021.
- Algerian pipeline exports to Europe were the largest source of pipeline supply growth to the region (+13 Bcm) last year, followed by Azerbaijan (+6 Bcm). While Russian pipeline supply to Europe
overall was steady at 167 Bcm in 2021, exports to the EU decreased by 8.2% (-12 Bcm).
Coal
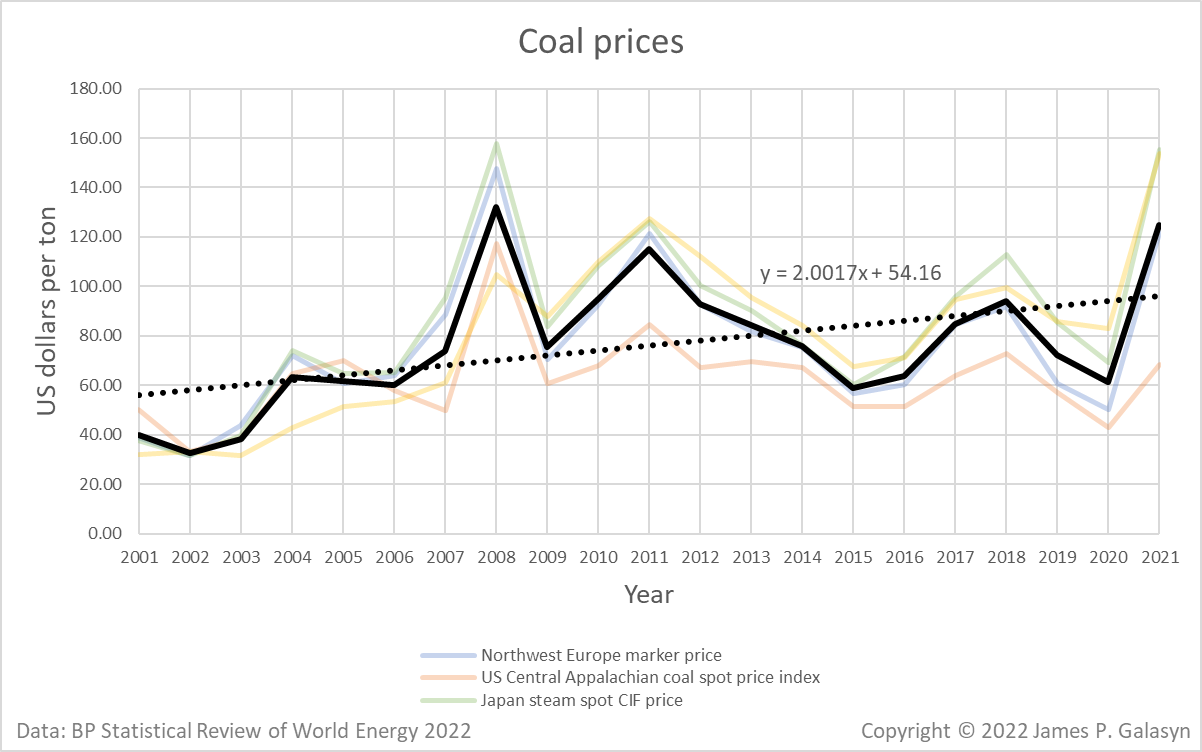
- Coal prices rose dramatically in 2021, with European prices averaging $121/tonne and the Asian marker price averaging $145/t, its highest since 2008.
- Coal consumption grew over 6% in 2021 to 160 EJ, slightly above 2019 levels and its highest level since 2014.
- China and India accounted for over 70% of the growth in coal demand in 2021, increasing by 3.7 and 2.7 EJ, respectively.
- Global production matched consumption with an increase in supply of 440 Mt. China and India accounted for much of the increase in production, which was largely consumed domestically, as well as Indonesia, supporting higher exports.
- Notably, both Europe and North America showed an increase in coal consumption in 2021 after nearly 10 years of back-to-back declines.
Renewables, hydro, and nuclear
- Renewable primary energy (including biofuels but excluding hydro) increased by around 5.1 EJ in 2021 – corresponding to an annual growth rate of 15%, stronger than the previous year’s 9%, and higher than that of any other fuel in 2021.
- Solar and wind capacity continued to grow rapidly in 2021, increasing by 226 GW, close to the record increase of 236 GW seen in 2020.
- China remained the main driver of solar and wind capacity growth last year, accounting for about 36% and 40% of the global capacity additions, respectively.
- Hydroelectricity generation decreased by around 1.4% in 2021, the first fall since 2015. In contrast, nuclear generation increased by 4.2% – the strongest increase since 2004 – led by China.
Electricity
- Electricity generation increased by 6.2% in 2021 – similar to the strong bounce back seen in 2010 in the aftermath of the financial crisis (6.4%).
- Wind and solar reached a 10.2% share of power generation in 2021, the first time wind and solar power have provided more than 10% of global power and surpassing the contribution of nuclear energy.
- Coal remained the dominant fuel for power generation in 2021, with its share increasing to 36%, up from 35.1% in 2020.
- Natural gas in power generation increased by 2.6% in 2021, although its share decreased from 23.7% in 2020 to 22.9% in 2021.
Key minerals
- The price of cobalt increased 63% in 2021 to average $51,000/tonne. Similarly, lithium carbonate prices rose 58% to average $11,000/tonne. So far in 2022, mineral prices have continued to surge.
- Lithium production rose sharply by 27%, cobalt output was up by only 4%.